
-
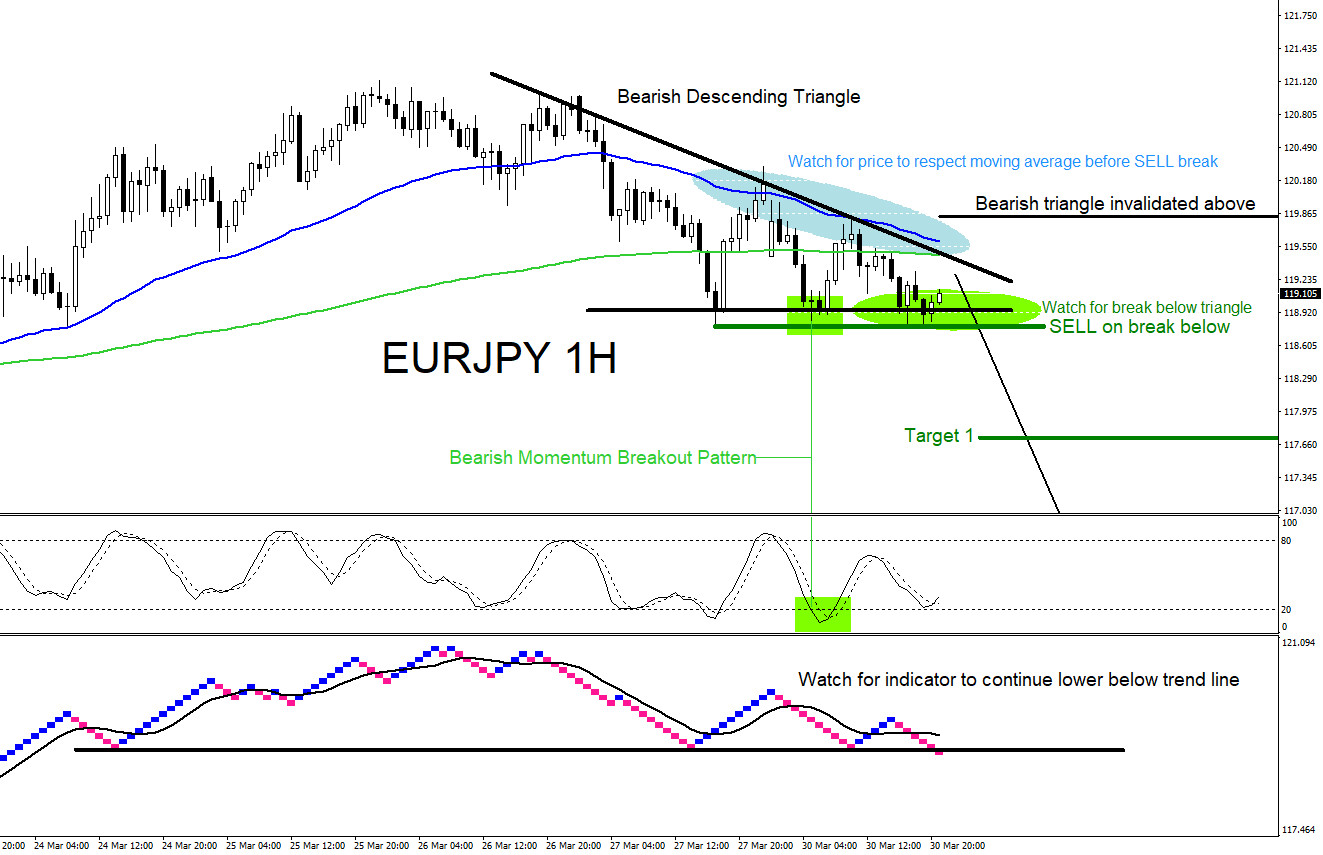
EURJPY : Trading a Triangle Breakout Pattern
Read MoreEURJPY Technical Analysis On March 30/2020 I posted on social media (Stocktwits/Twitter) @AidanFX “Will be watching for possible selling opportunities $EURJPY“ EURJPY 1 Hour Chart March 30.2020 : The chart below was also posted on social media (StockTwits/Twitter) @AidanFX March 30/2020 showing that a bearish descending triangle breakout pattern (black) was forming. I called for traders […]
-
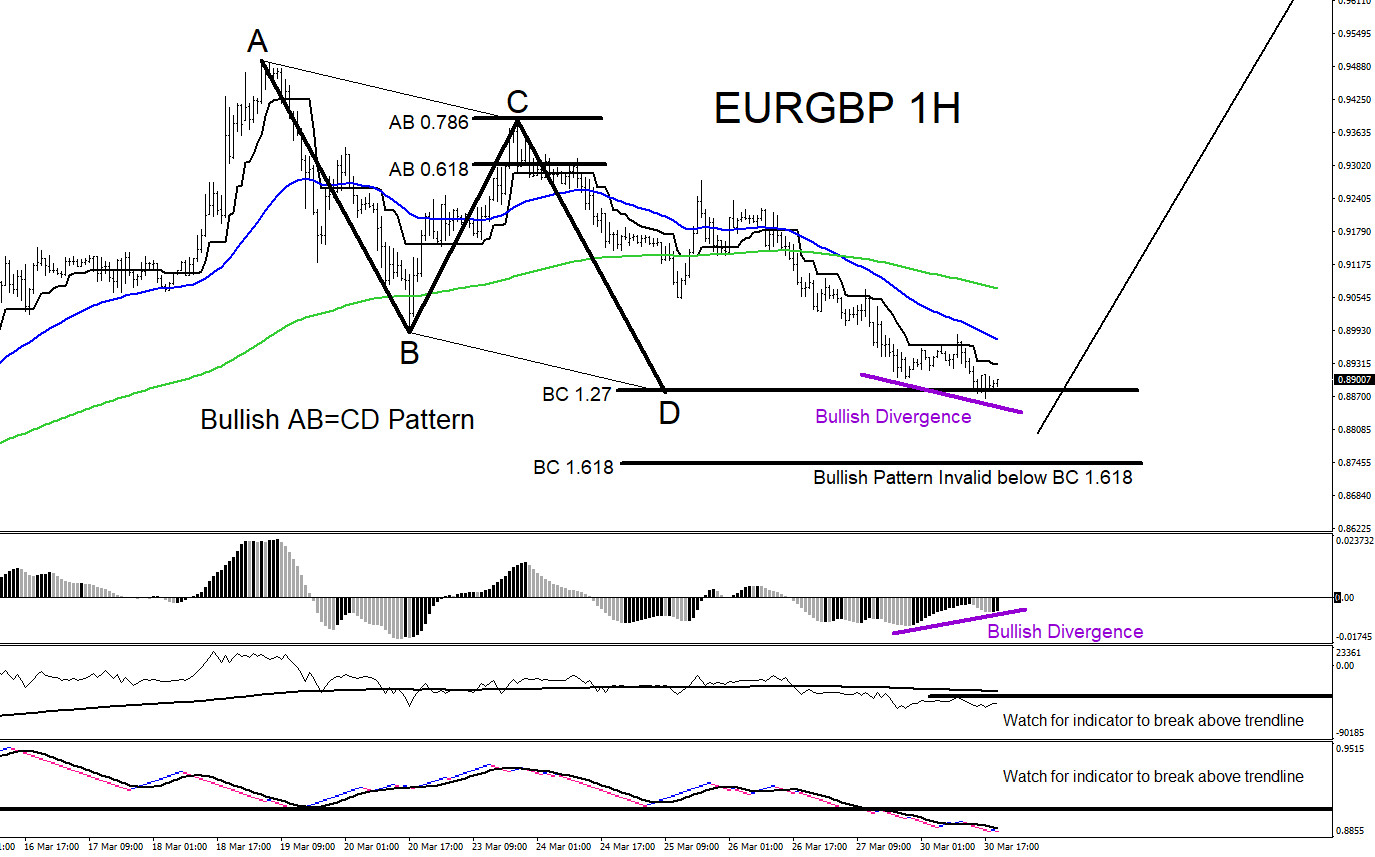
EURGBP : Will the Pair Bounce Higher?
Read MoreEURGBP Technical Analysis March 30/2020 EURGBP : There are clear visible bullish market patterns on the 1 hour chart but traders will still need to wait for more confirmation that a bottom will form and for price to bounce higher. Bullish AB=CD pattern triggers BUYS in the BC 1.27-1.618 Fib. levels. Price has already reached […]
-
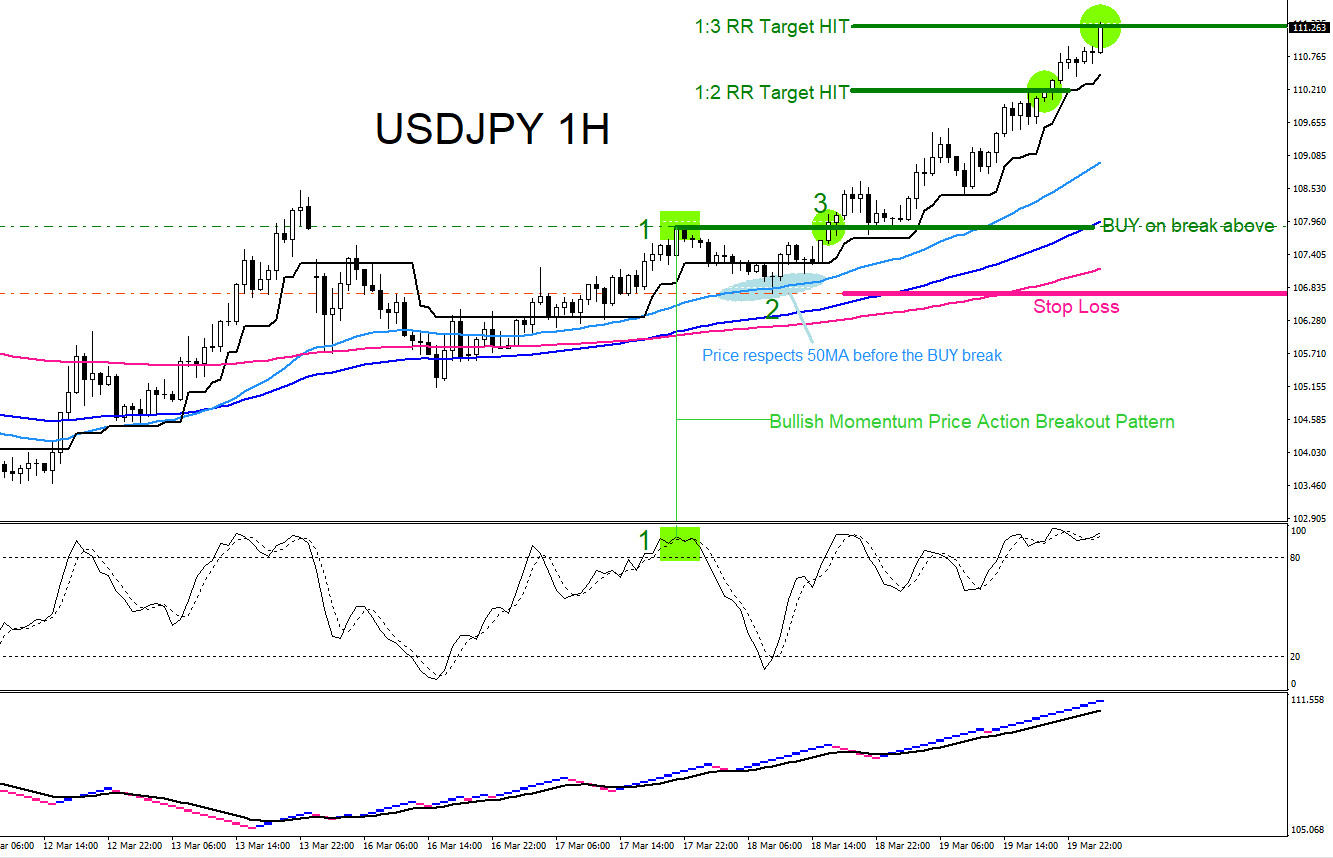
USDJPY : Bullish Momentum Breakout Pattern
Read MoreUSDJPY Technical Analysis In our members only area, we posted the USDJPY 1 Hour Chart (London Update) advising our members/clients that the pair would continue rallying higher and for traders to continue looking for possible buying opportunities. USDJPY 1 Hour Chart March 18/2020 (Members Only Area) USDJPY 1 Hour Chart March 19/2020: Once price broke above […]
-
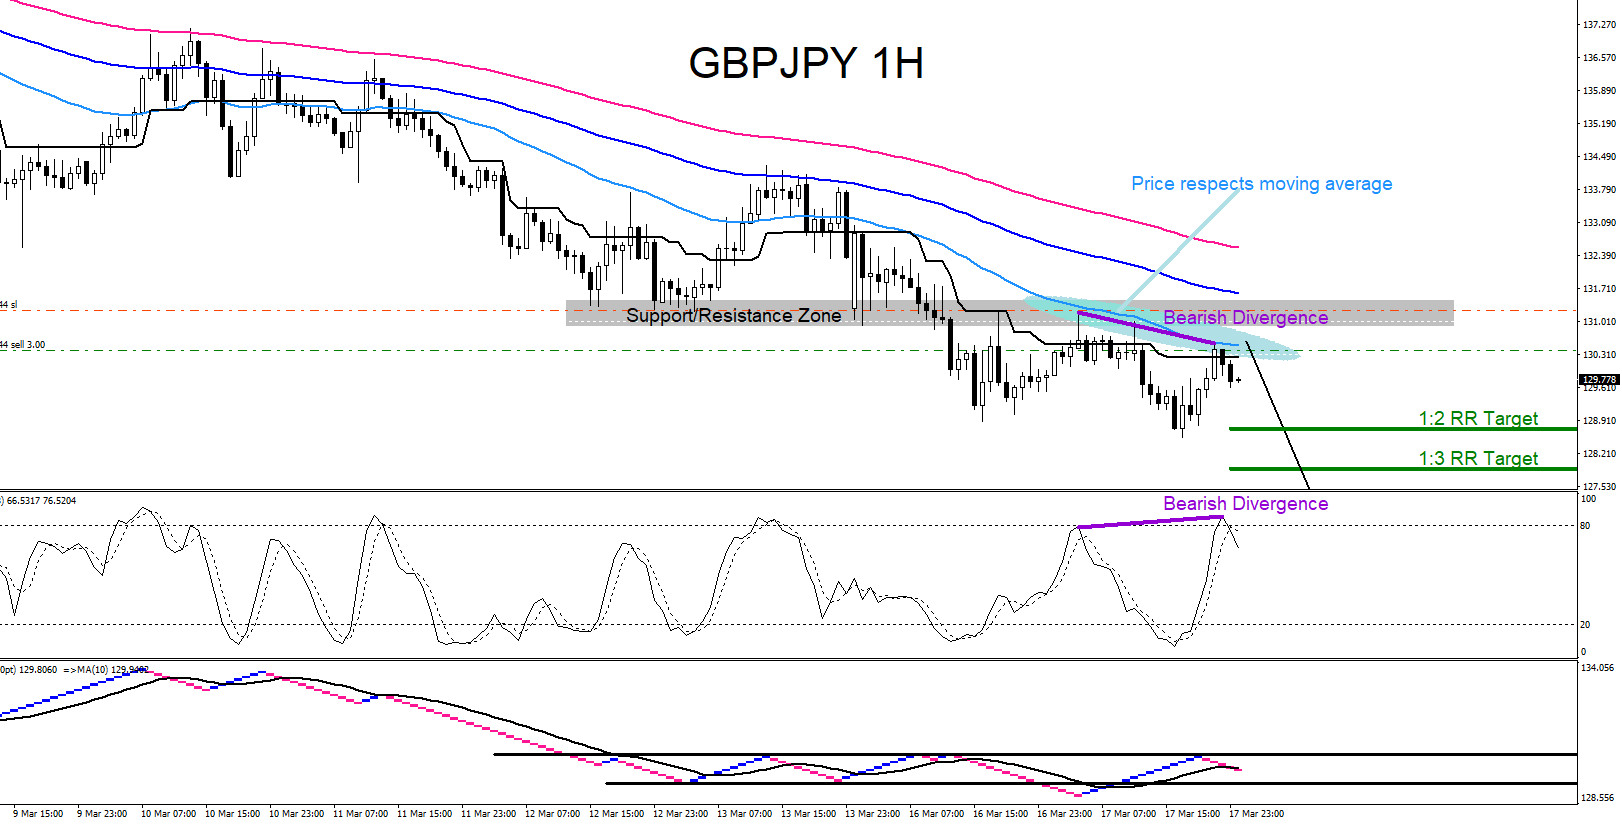
GBPJPY AUDJPY : Calling the Move Lower
Read MoreGBPJPY Technical Analysis On March 17/2020 I posted on social media (Stocktwits/Twitter) @AidanFX “$GBPJPY will extend lower towards 126.60 area.“ GBPJPY 1 Hour Chart 3.17.2020 : The chart below was also posted on social media (StockTwits/Twitter) @AidanFX March 17/2020 showing that a bearish divergence pattern (purple) was forming on price and indicator. The GBPJPY chart shows that […]
-
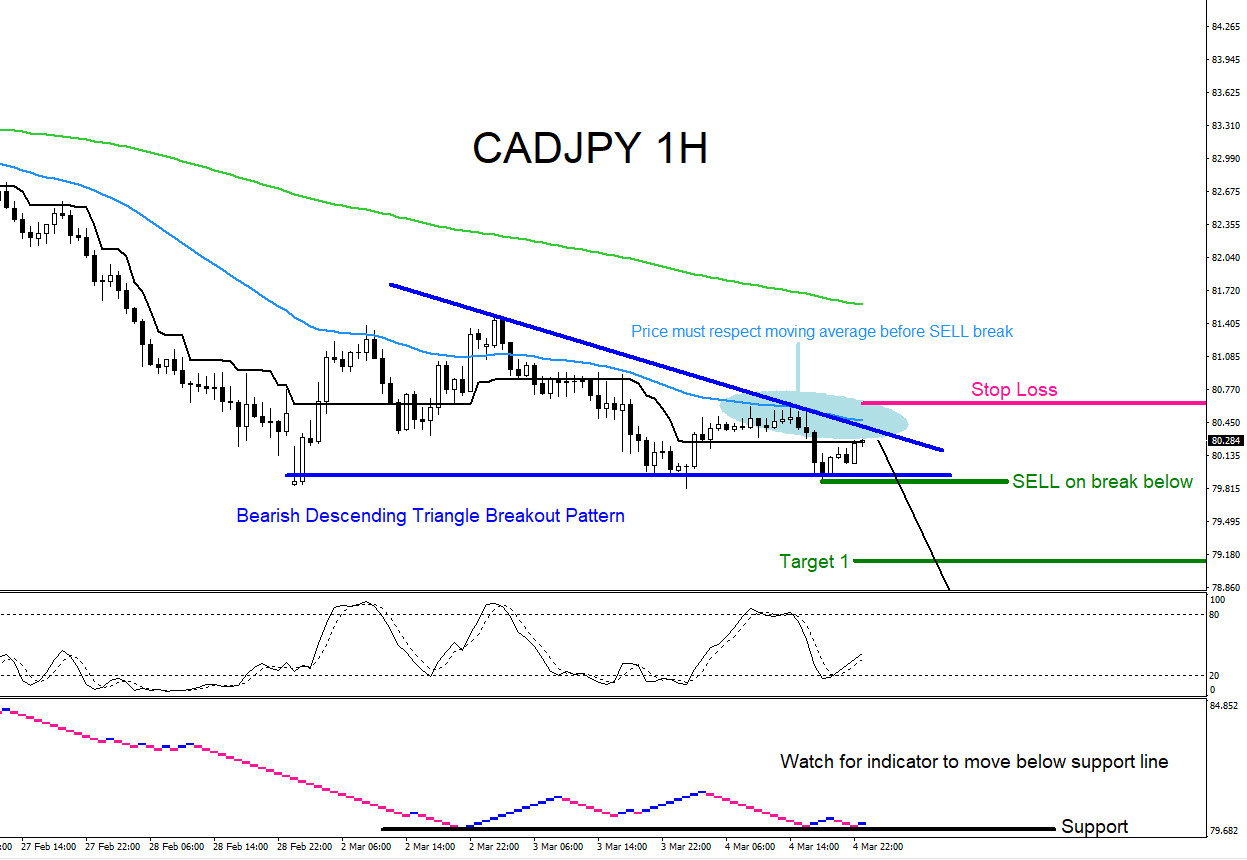
CADJPY : Catching the 600 Pip Drop
Read MoreCADJPY Technical Analysis On March 4/2020 I posted on social media (Stocktwits/Twitter) @AidanFX “$CADJPY Break below 79.88 and I’m selling … lets see if we see any downside momentum“ CADJPY 1 Hour Chart 3.4.2020 : The chart below was also posted on social media (StockTwits/Twitter) @AidanFX March 4/2020 showing that a bearish descending triangle breakout pattern […]
-
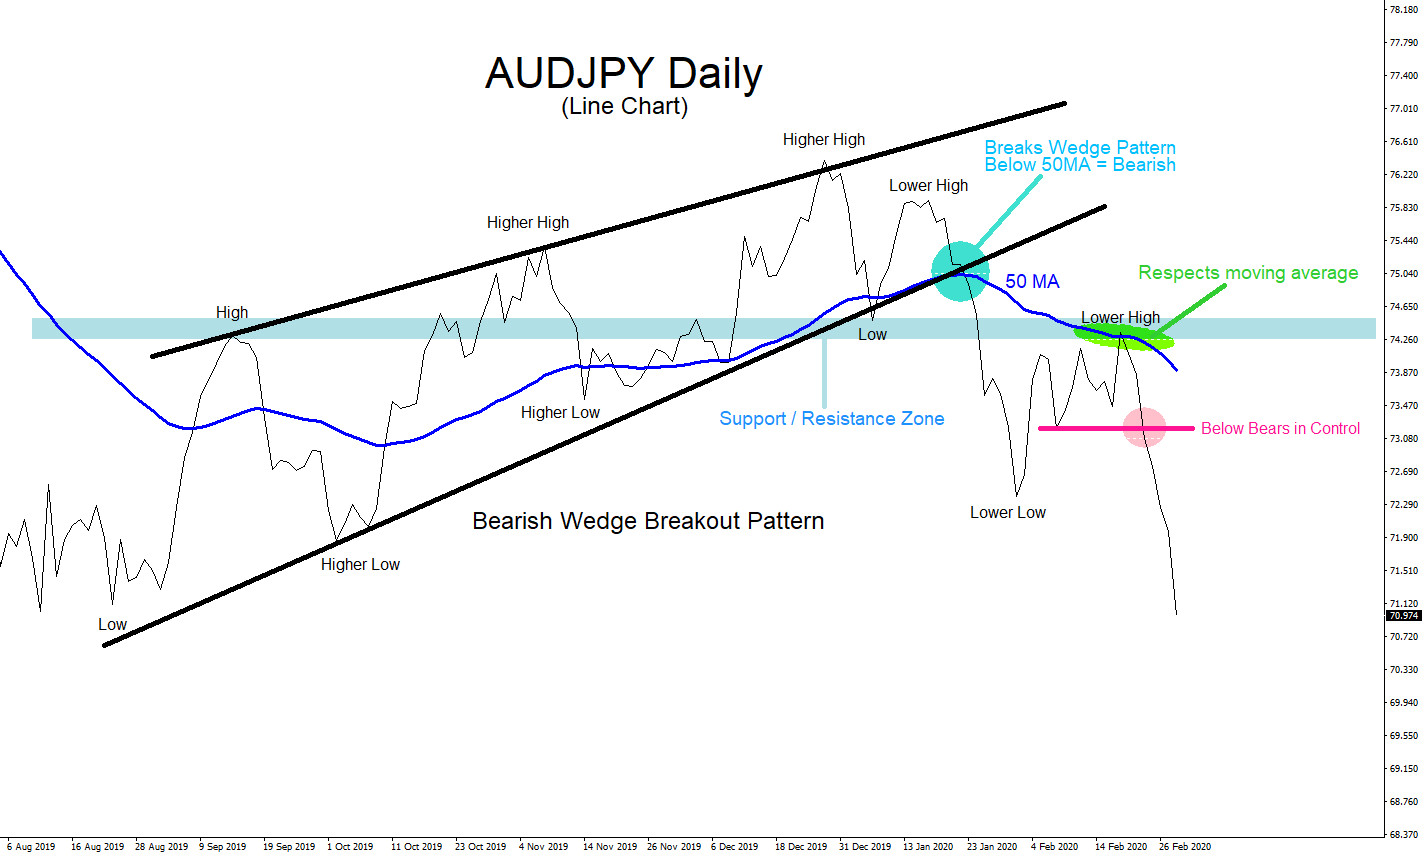
AUDJPY : Multiple Time Frames to Identify a Trade Setup
Read MoreAUDJPY Technical Analysis Every trader should always view the market in the “bigger picture” first. Viewing the market starting from a higher time frame down to a lower time frame will offer a trader a clearer picture of the markets and will also allow a trader to ultimately decide which side to trade. AUDJPY Daily Chart […]