
-
EURAUD : Remains Bearish Pushing for New Lows
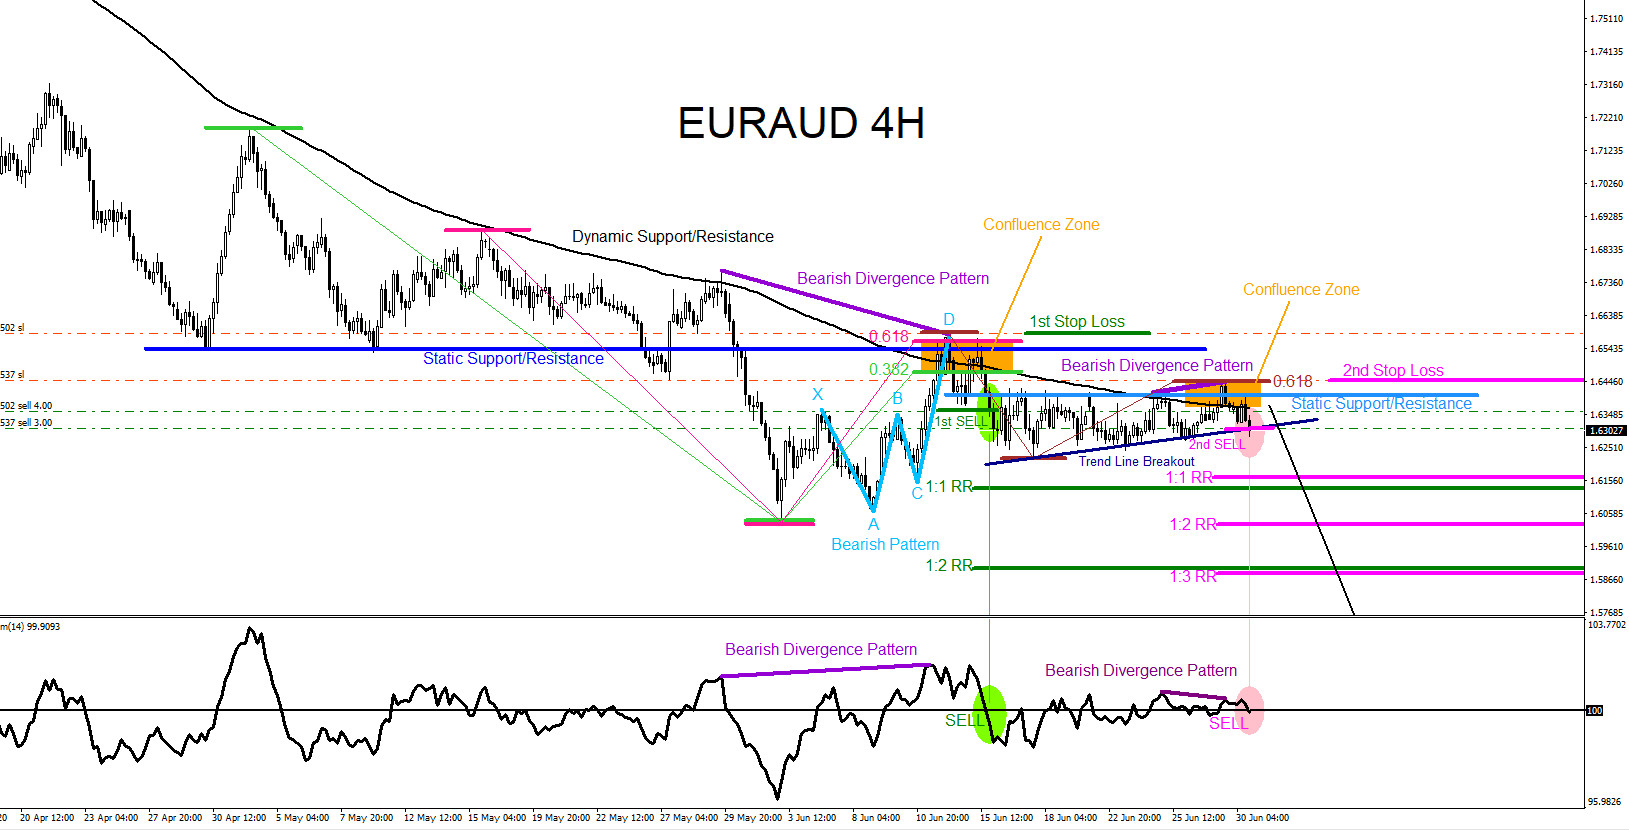
Read MoreOn June 30 2020 I posted on social media Stocktwits/Twitter @AidanFX “EURAUD Sold 2nd position at 1.6308 with Stop Loss at 1.6448“. The chart below was also posted on social media StockTwits/Twitter @AidanFX June 30 2020 showing that a bearish market pattern (light blue) terminated at the point D June 12 2020 high which signalled traders […]
-
EURGBP : Trading the Rally Higher
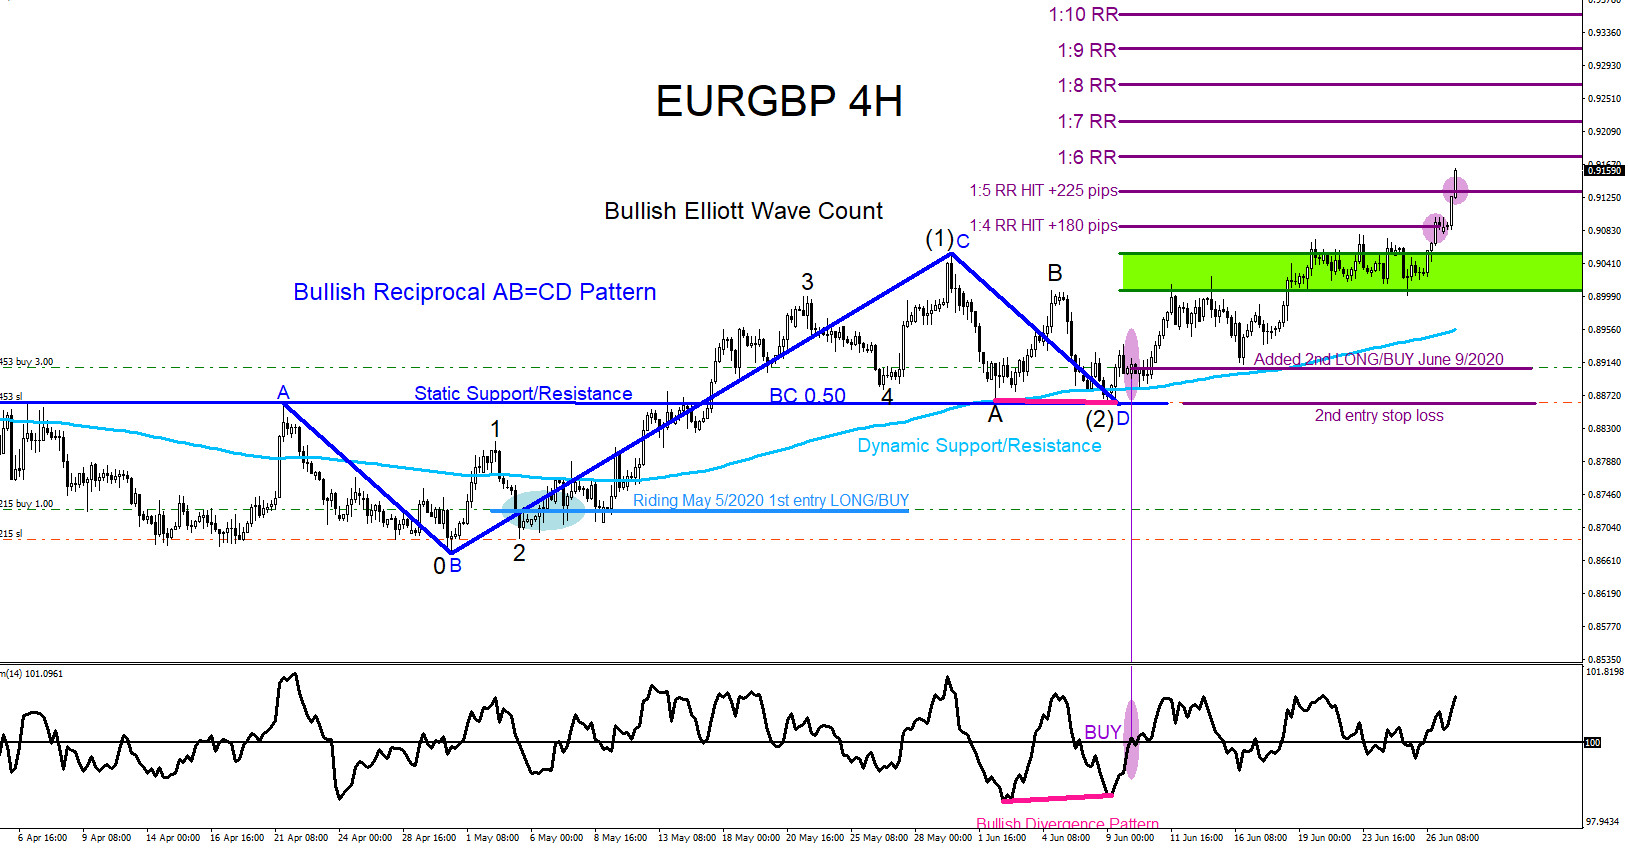
Read MoreSince the start of May 2020 we at ElliottWave-Forecast have been advising our members that the EURGBP pair was going to rally higher. I published an article in May 2020 and another article start of June 2020 calling for the EURGBP move higher. On June 9 2020 I posted on social media Stocktwits/Twitter @AidanFX “Added 2nd […]
-
GBPUSD : Market Patterns Signalling the Move Lower
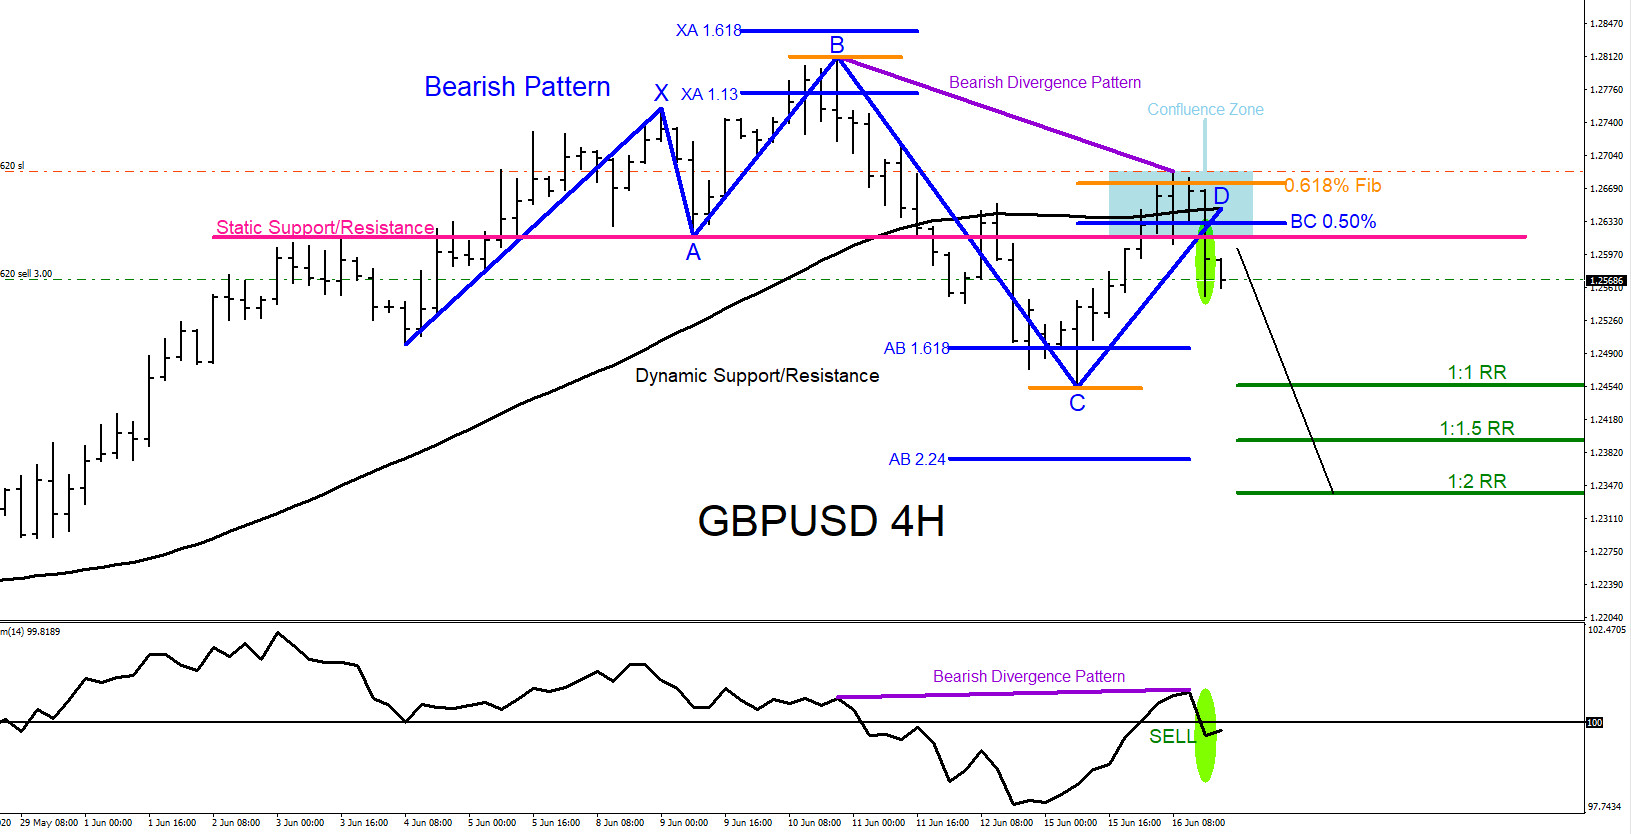
Read MoreOn June 16 2020 I posted on social media Stocktwits/Twitter @AidanFX “GBPUSD watching for SELLS“. The chart below was also posted on social media StockTwits/Twitter @AidanFX June 16 2020 showing that a bearish market pattern (blue) formed which then triggered the pair to react with a move lower. A bearish divergence pattern (purple) also formed […]
-
GBPUSD : Spotting and Trading Confluence Zones
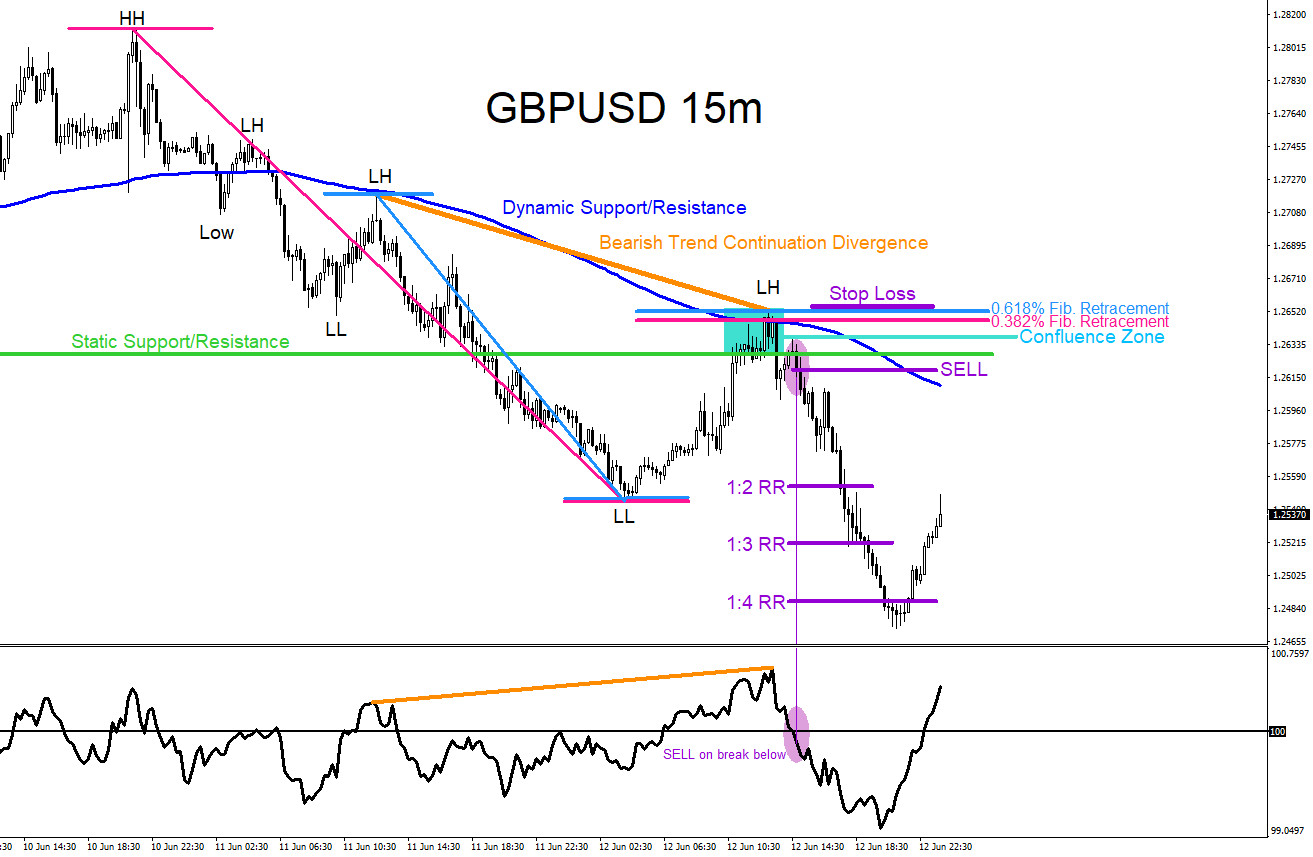
Read MoreThe GPBUSD pair last week formed a temporary top and reversed lower. Towards the end of the trading week GBPUSD made lower lows and lower highs signalling the pair was in a downside trend. Traders use confluence zones to catch possible trade setups. Confluence zones are when 2 or more trading techniques/strategies come together and […]
-
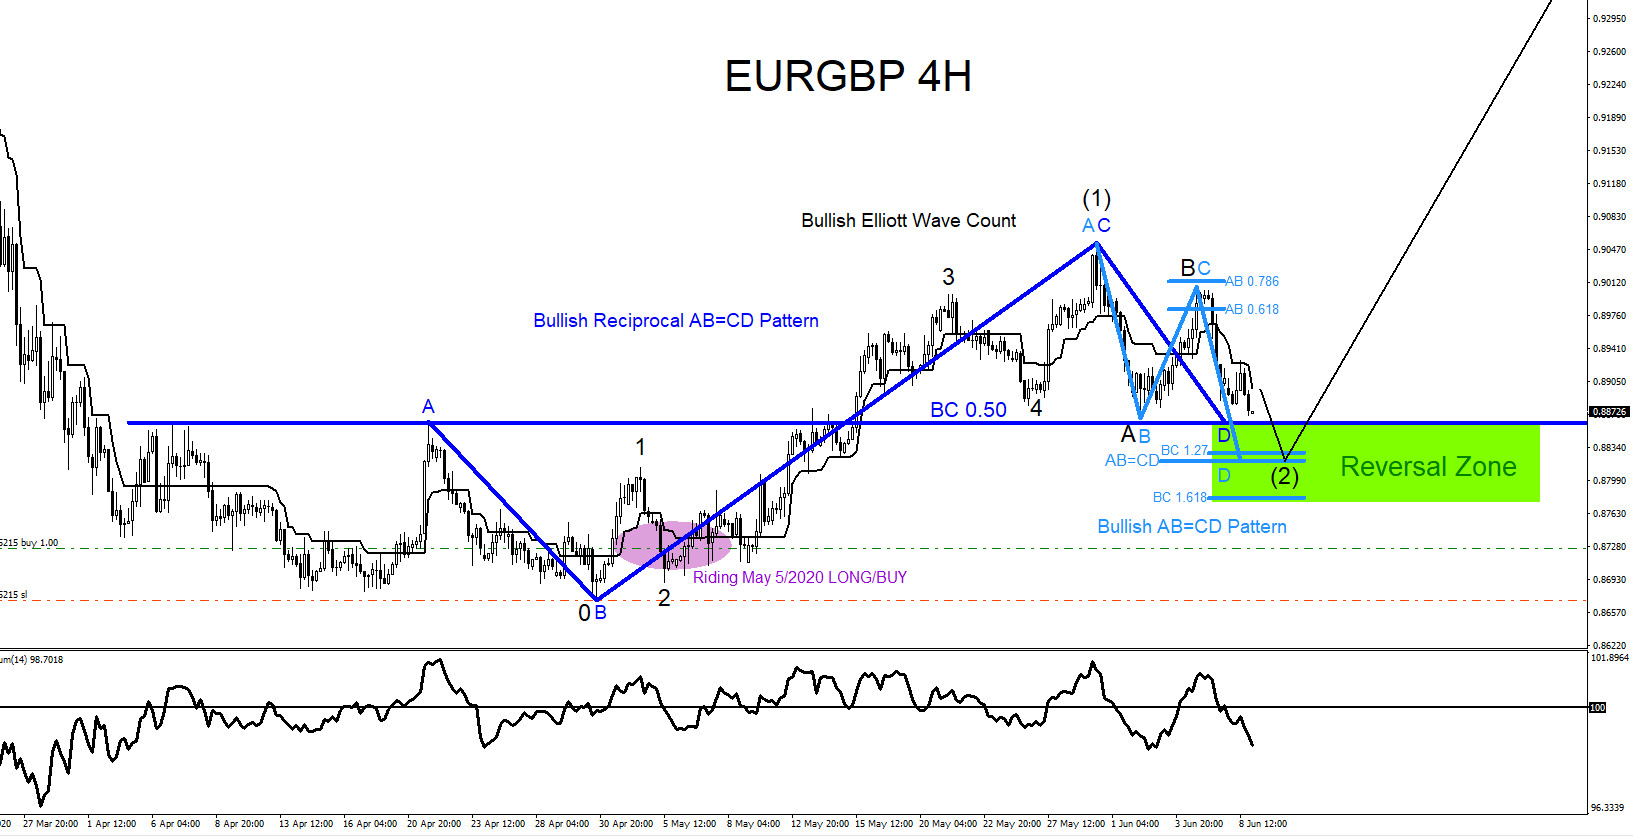
EURGBP : Watch For Possible Buying Opportunities
Read MoreEURGBP June 8 2020 Possible bullish patterns are visible on the EURGBP 4 hour time frame. The dark blue bullish reciprocal AB=CD pattern still needs to make a push lower to complete point D at the BC 0.50% Fib. retracement buy level and the light blue bullish AB=CD pattern also still needs to make a […]
-
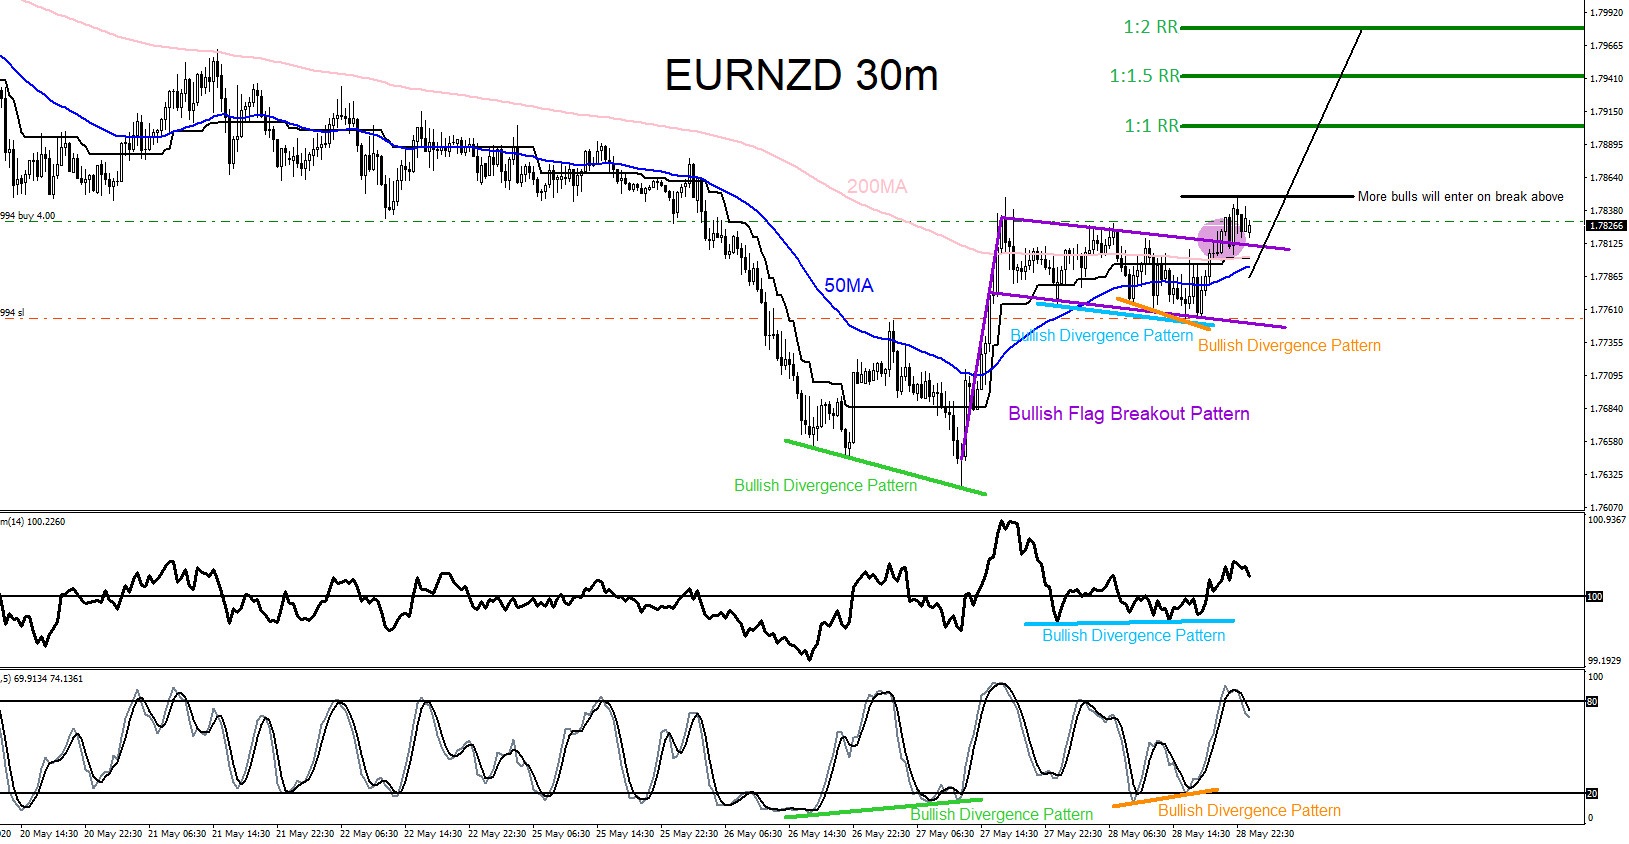
EURNZD : Catching the Move Higher
Read MoreOn May 28 2020 I posted on social media Stocktwits/Twitter @AidanFX “EURNZD Break above 1.7830 will look to BUY targeting the 1.7900 area“. The chart below shows that there were clearly visible bullish patterns calling for a breakout higher. EURNZD formed a bullish flag breakout pattern (purple) and broke above the top of flag signalling […]