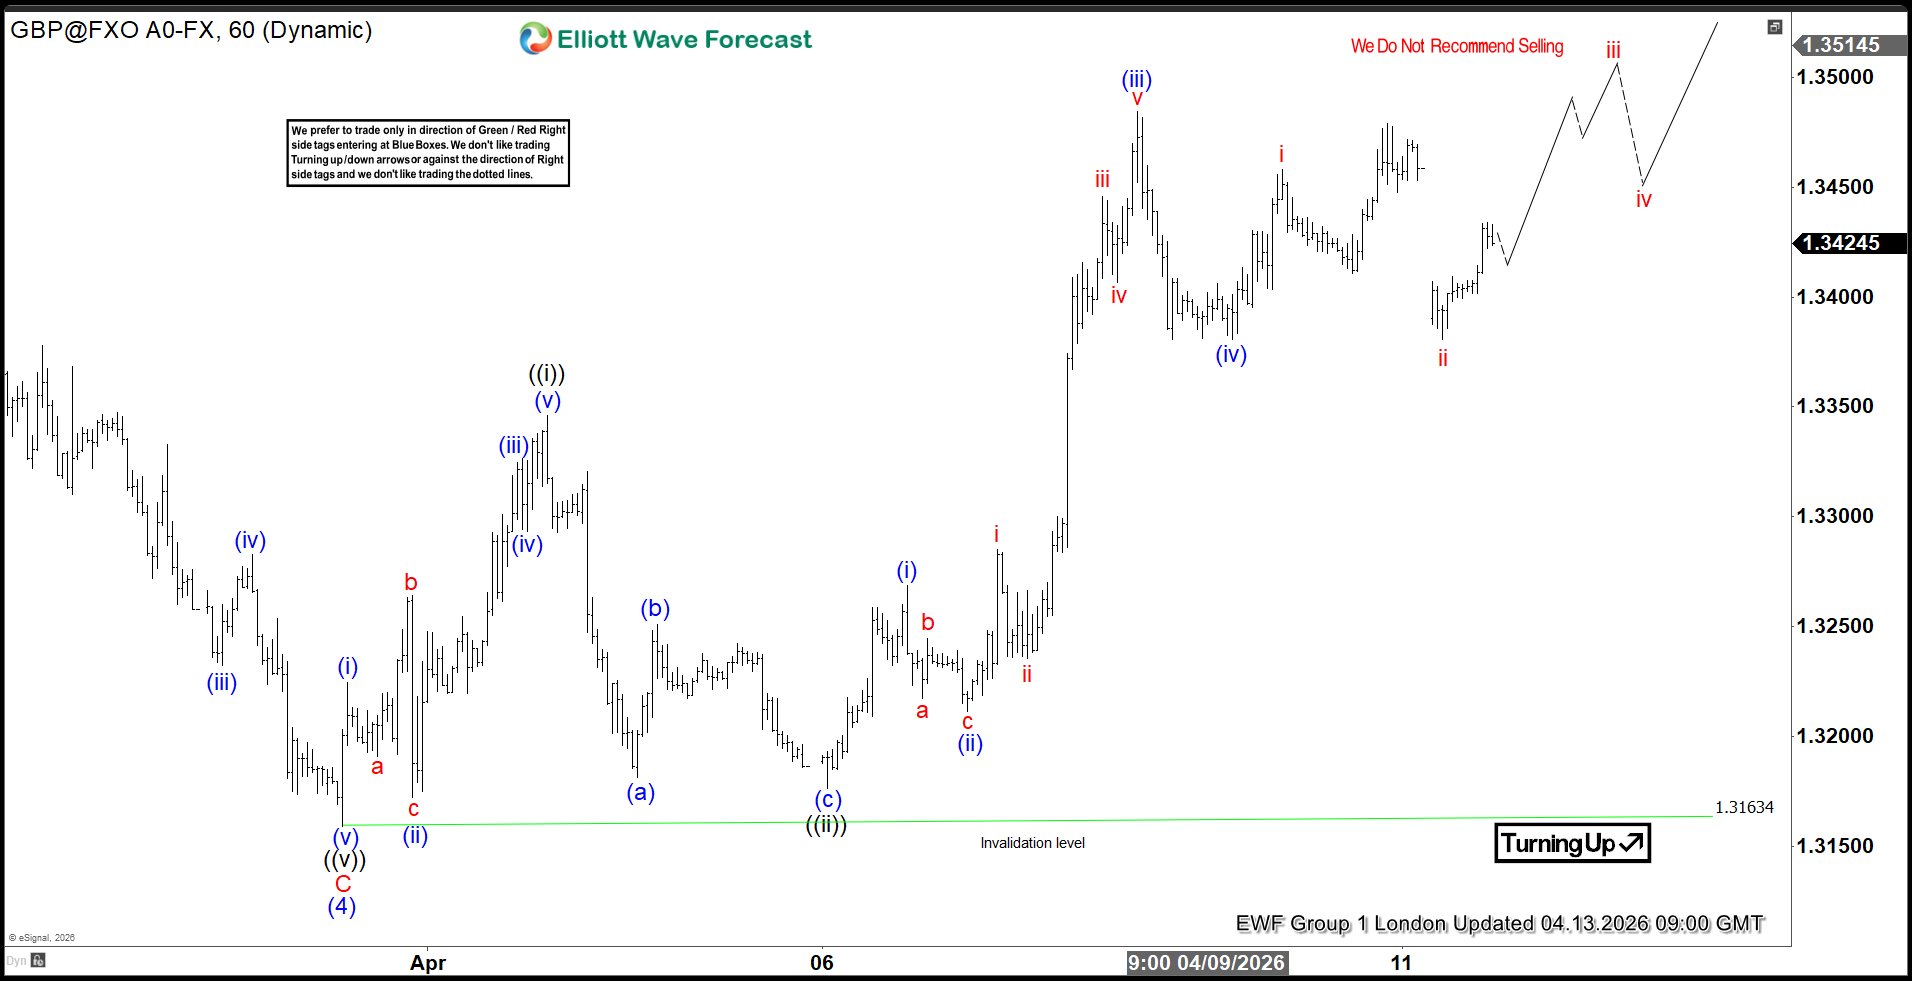
April 13 2026 we advised EWF members that the GBPUSD pair was in a bullish wave count and that a move higher was coming.
GBPUSD 1 Hour Chart London Update April 13 2026 (Bullish Wave Count)
 On April 13 2026 I entered the BUY trade when GBPUSD tapped the 1H FVG (Gray). Visible bullish signals, before the buy entry, was the bullish divergence pattern (Red) and the break above CHoCH level (Black) signalling more upside.
GBPUSD 15 Minute Chart April 13 2026
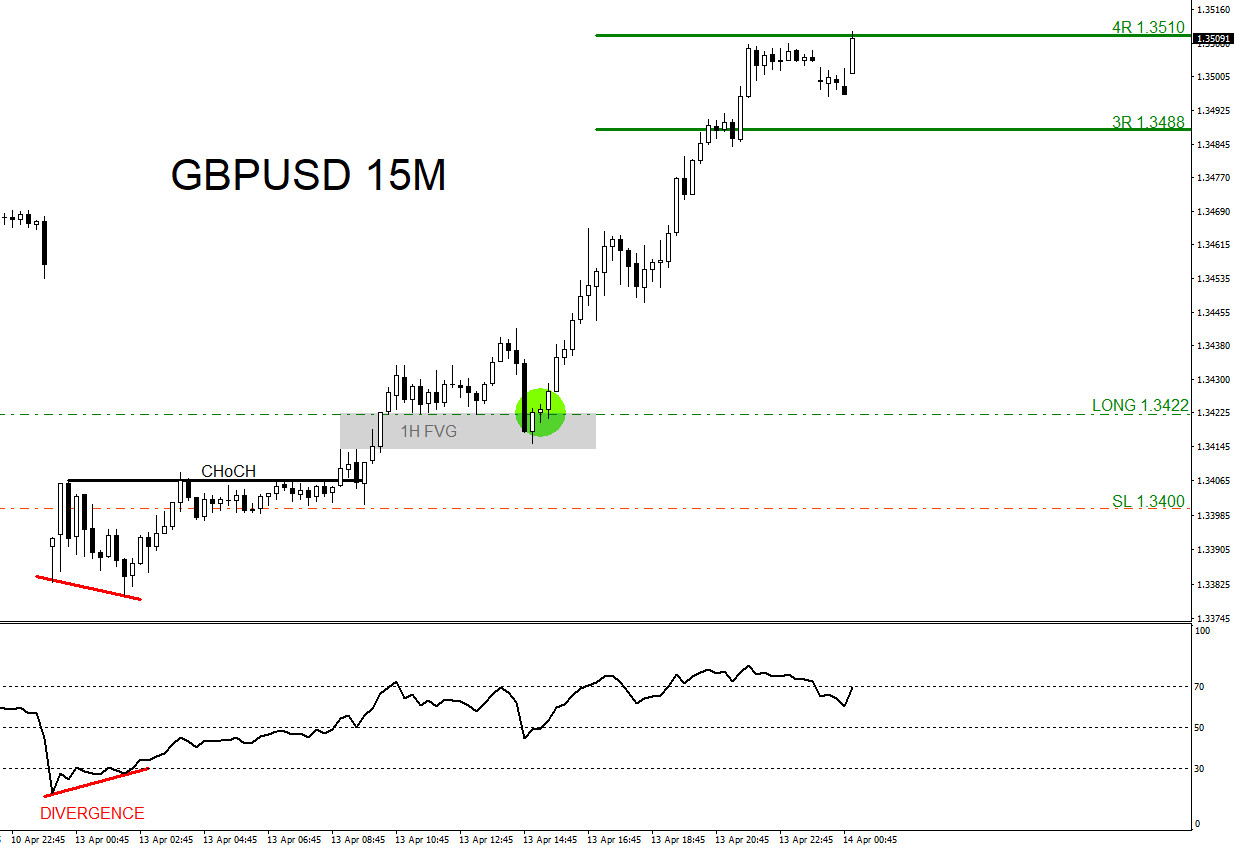 GBPUSD moves higher and on April 13 2026 price hits the 4R target at 1.3510 from 1.3422 and I closed the buy trade for +88 pips (+4% gain risking 1% on every trade)
A trader should always have multiple strategies all lined up before entering a trade. Never trade off one simple strategy. When multiple strategies all line up it allows a trader to see a clearer trade setup. We at EWF never say we are always right. No market service provider can forecast markets with 100% accuracy. Only thing we at EWF 100%, is that we are RIGHT more than we are WRONG.
Of course, like any strategy/technique, there will be times when the strategy/technique fails so proper money/risk management should always be used on every trade. Hope you enjoyed this article and follow me on social media for updates and questions> @AidanFX
At Elliottwave-Forecast we cover 78 instruments (Forex, Commodities, Indices, Cryptos, Stocks and ETFs) in 4 different time frames and we offer 5 Live Session Webinars everyday. We do Daily Technical Videos, Elliott Wave Trade Setup Videos and we have a 24 Hour Chat Room. Our clients are always in the loop for the next market move.
Try Elliottwave-Forecast for 14 days !!! Just click here –> 14 day trial


