The EURJPY pair was on a higher high/higher low sequence in February 2026 so the obvious was to only look for buy opportunities.
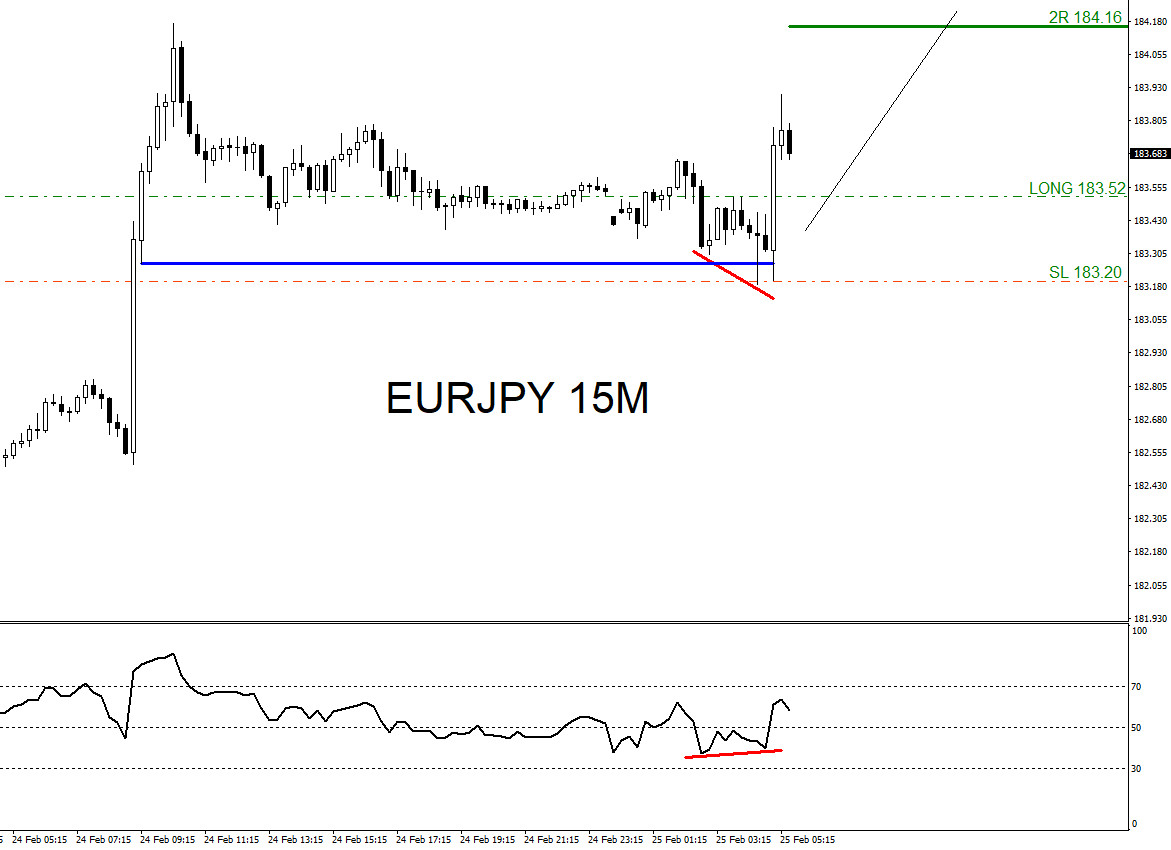
February 24 2026 the pair formed a bullish divergence pattern (Red) in the FVG top level (Blue line) then pushed higher and broke above the shift level (Black line) signalling that the pair was gearing up to rally higher again.
I posted on February 24 2026 the buy/long trade chart below on social media @AidanFX and also posted the entry, stop loss and targets.
“Bought at 183.52 with stop loss at 183.20 and minimum target at 2R 184.16 and maximum target at 3R 184.48.”
EURJPY 15 Minute Chart February 24 2026 (Entry)
EURJPY 15 Minute Chart February 25 2026 (Targets HIT)
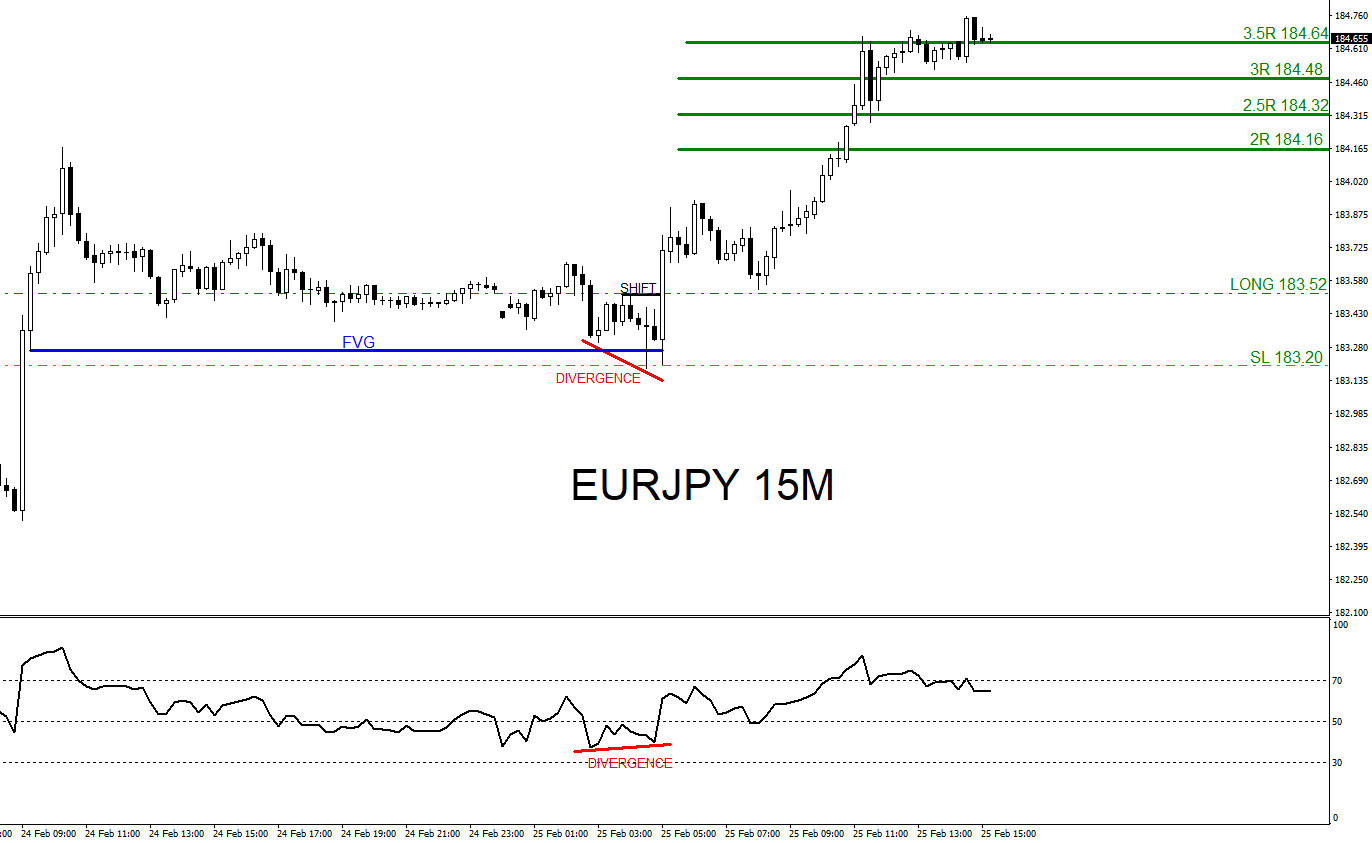
EURJPY hits 3.5R target at 184.64 from 183.52 and I closed buy trade for +112 pips (+3.5% gain risking 1% on every trade)
A trader should always have multiple strategies all lined up before entering a trade. Never trade off one simple strategy. When multiple strategies all line up it allows a trader to see a clearer trade setup. We at EWF never say we are always right. No market service provider can forecast markets with 100% accuracy. Only thing we at EWF 100%, is that we are RIGHT more than we are WRONG.
Of course, like any strategy/technique, there will be times when the strategy/technique fails so proper money/risk management should always be used on every trade. Hope you enjoyed this article and follow me on social media for updates and questions> @AidanFX
At Elliottwave-Forecast we cover 78 instruments (Forex, Commodities, Indices, Cryptos, Stocks and ETFs) in 4 different time frames and we offer 5 Live Session Webinars everyday. We do Daily Technical Videos, Elliott Wave Trade Setup Videos and we have a 24 Hour Chat Room. Our clients are always in the loop for the next market move.
Try Elliottwave-Forecast for 14 days !!! Just click here –> 14 day trial
