

Hello traders. In this technical article we’re going to take a quick look at the Elliott Wave charts of Palladium Futures (PA_F) published in members area of the website.
As our members know, Palladium Futures recently saw a rejection from the equal legs zone. In the following analysis, we explain the Elliott Wave pattern and discuss the market outlook.
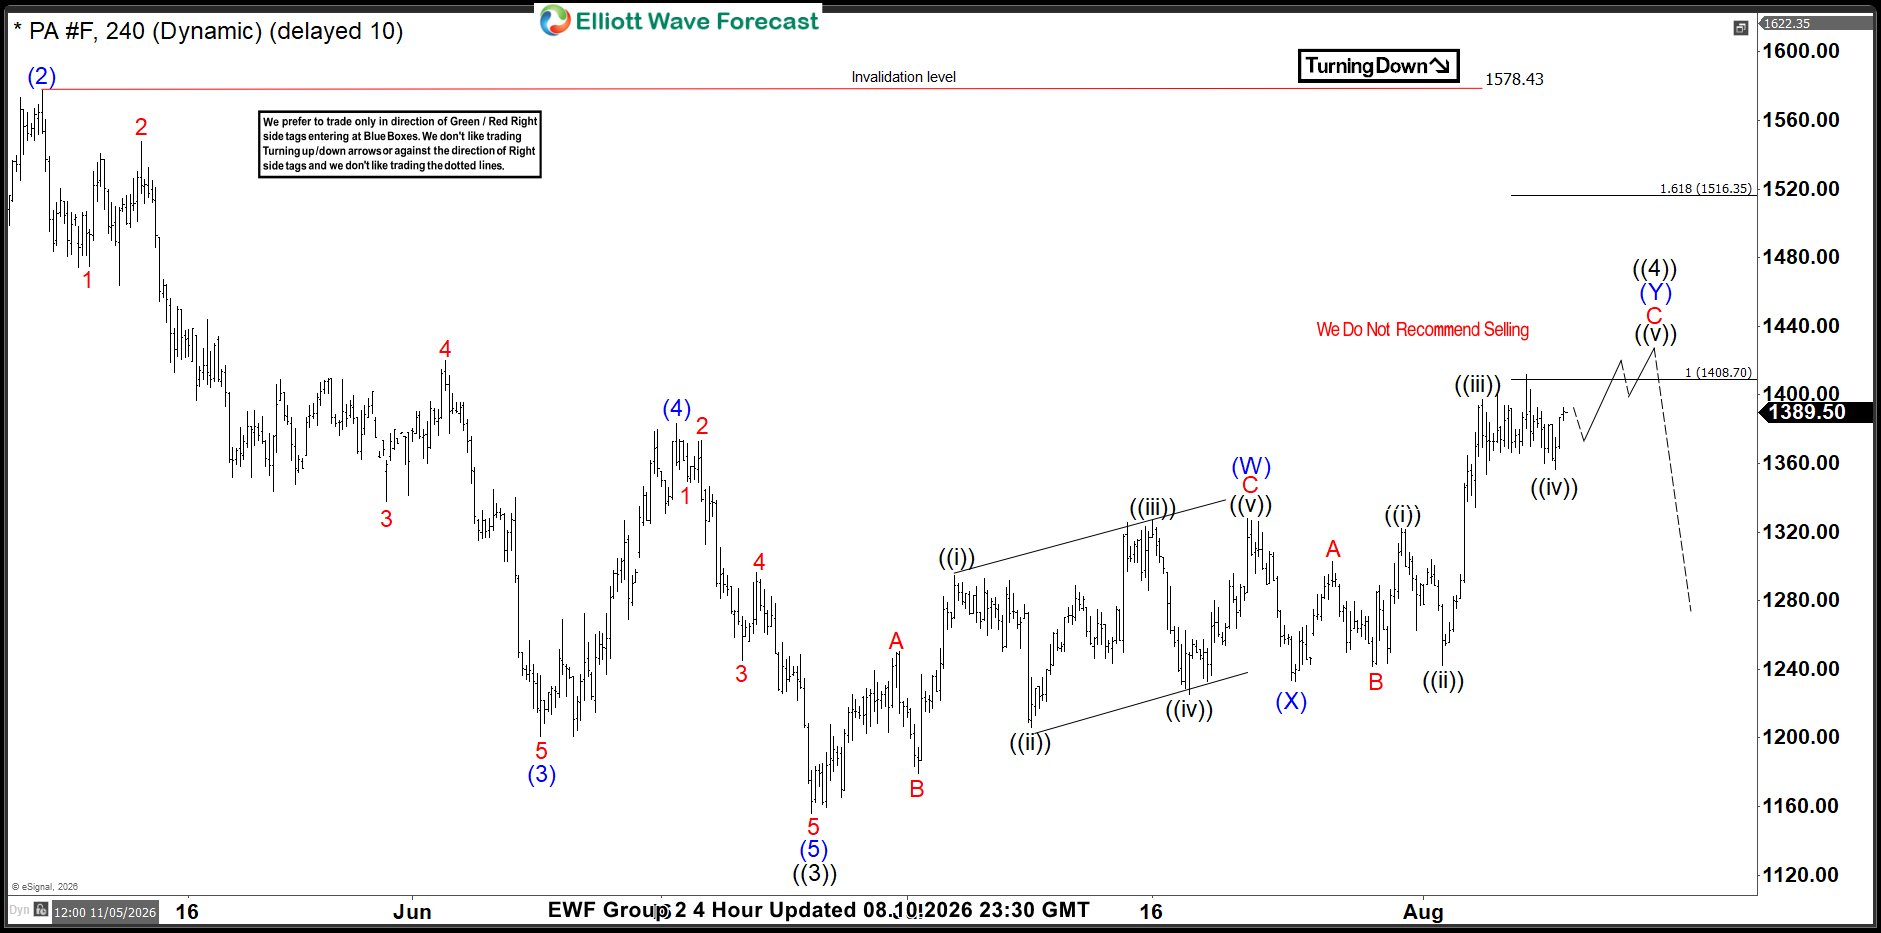
Palladium PA_F Elliott Wave 1-Hour Chart 08.10.2026
At the moment, Palladium Futures (PA_F) is forming a three-wave corrective recovery. However, the commodity remains bearish against the 1578.43 peak. Meanwhile, the recovery has reached a key technical resistance area at 1408.70–1516.35. Therefore, this area represents our Equal Legs selling zone. From this zone, we expect sellers to step in and produce at least a three-wave reaction lower.
As our members know, we use the Fibonacci extension tool to measure corrective swings and identify potential reversal areas. The Equal Legs area plays an important role in this process because it often highlights a zone where a correction may end and the dominant trend may resume. As a result, we closely monitor price action once the market reaches this area.
However, we do not treat every Equal Legs zone as an automatic trading signal. Instead, we wait for the Elliott Wave structure and other technical criteria to align. When they do, the zone can offer a high-probability setup with clear entry, invalidation and target levels. Consequently, this structured approach allows us to plan ahead, manage risk and avoid chasing the market after the move has already started.
Reminder: Not every market analysis qualifies as an official trading setup. Official trading recommendations are presented exclusively in our Live Trading Room.
Our member chat rooms are open 24/7, providing ongoing expert guidance on market trends and Elliott Wave analysis. Members are encouraged to ask questions about market structure and technical setups at any time. You can also learn more about Elliott Wave patterns on our Free Elliott Wave Educational Web Page.
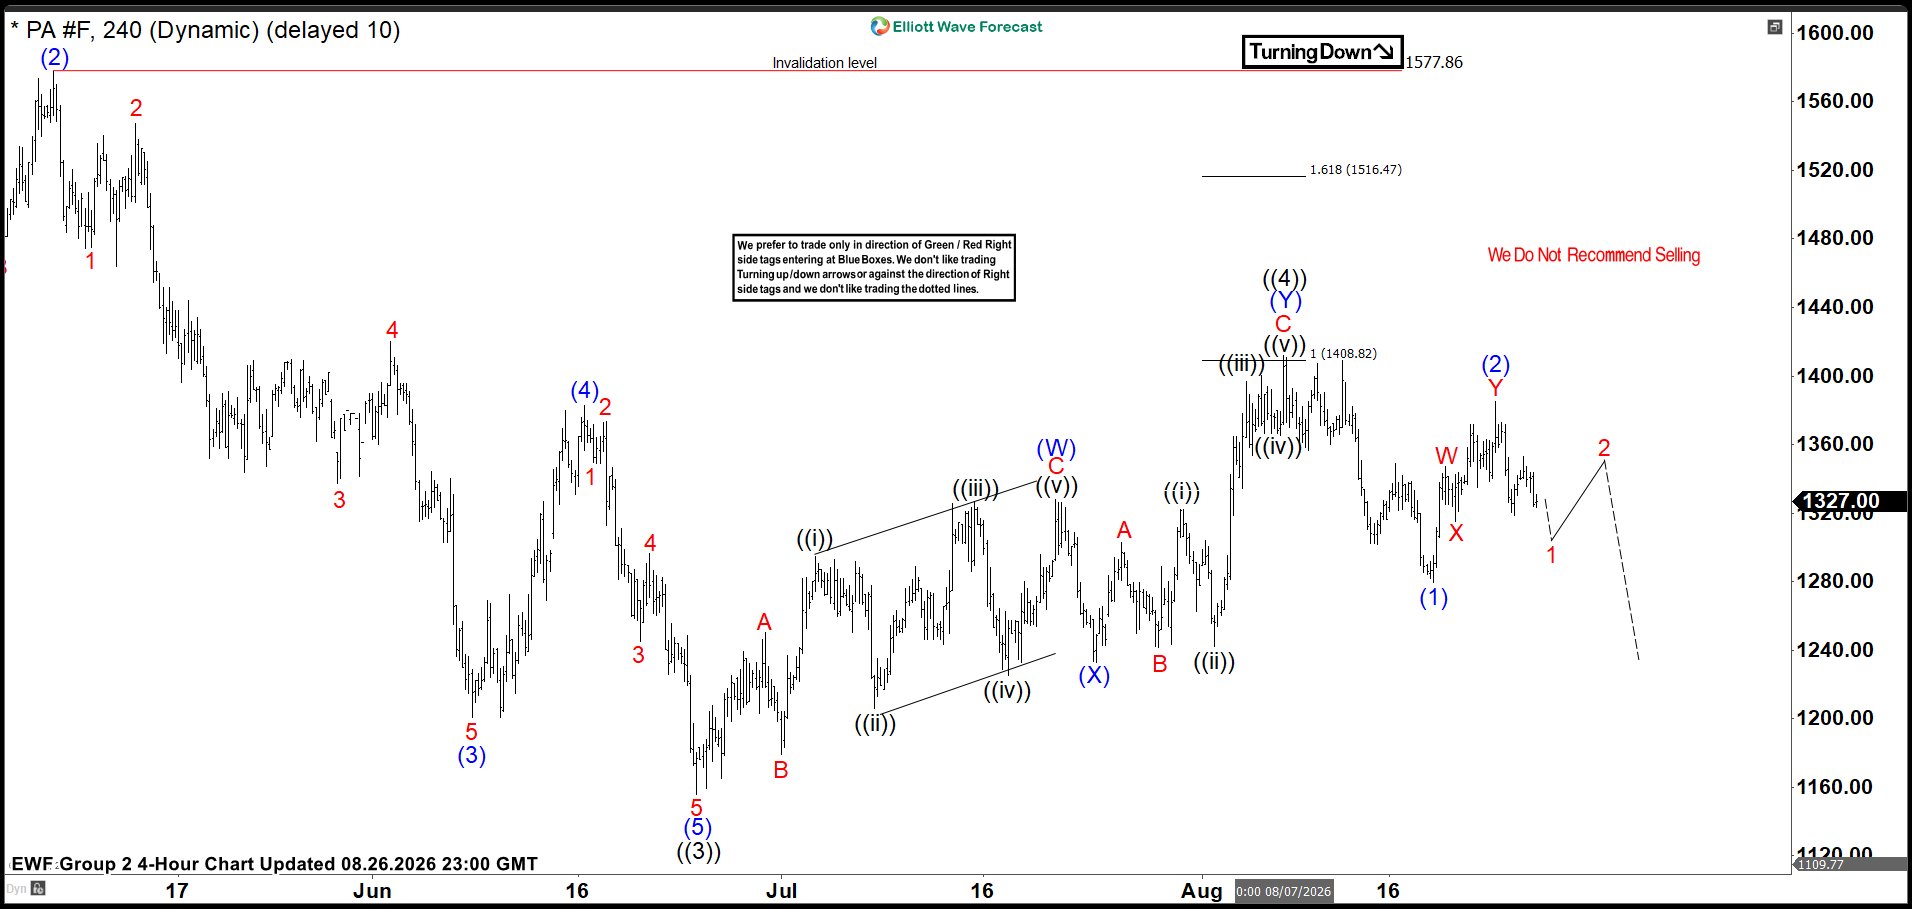
Palladium PA_F Elliott Wave 1-Hour Chart 08.26.2026
As expected, the commodity found sellers in the Equal Legs area and delivered a solid reaction lower. Consequently, the latest peak at 1412 has become the key short-term level. As long as the price remains below this level, the wave ((4)) recovery can be considered complete. In that case, wave ((5)) may already be in progress, targeting the 1095 area. However, a break above 1412 would suggest that the correction remains incomplete.
Keep in mind market is dynamic and presented view could have changed in the mean time. You can check most recent charts in the membership area of the site. Please keep in mind that now every chart is trading recommendation. Best instruments to trade are those having incomplete bullish or bearish swings sequences.We put them in Sequence Report and best among them are shown in the Live Trading Room.
Elliott Wave Forecast Membership
Trade with a clear plan. Trade with confidence.
Our team of professional analysts monitors 78 instruments across global markets every trading day, helping members identify high-probability setups, define risk before entering, and manage positions with a structured, rules-based approach.
Inside your membership, you’ll receive:
✅ Real-Time Trading Recommendations — clearly defined Entry, Stop Loss, and Take Profit levels for every setup.
✅ Live Trading Room Access — follow professional setups and trade management as they develop in real time.
✅ 24-Hour Analyst Support — ask unlimited questions and get expert guidance throughout the trading week.
✅ Expert Multi-Market Analysis — covering Forex, Stocks, Indices, ETFs, Commodities, and Cryptocurrencies.
✅ Education Built Into Every Setup — learn how experienced analysts identify opportunities, define risk, and manage positions. Exclusive educational videos are included at no additional cost.
Stop reacting after the market moves. Start preparing before it does.
See the setups our analysts are watching, follow the market in real time, and learn the strategy behind each trade.
Your membership starts with just a few clicks.
Regular 14-Day Trial: $9.99
Limited-Time Price: Only $0.99
👉 Start Your 14-Day Trial for Only $0.99





