

IWM (iShares Russell 2000 ETF) has been unfolding a bullish impulse from the March 23, 2026 low, maintaining a higher‑high sequence that favors continued upside. Our strategy guided members to avoid selling and instead buy dips in 3, 7, or 11 swings at defined blue box areas.
August 20, 2026 (1‑Hour Chart Update)
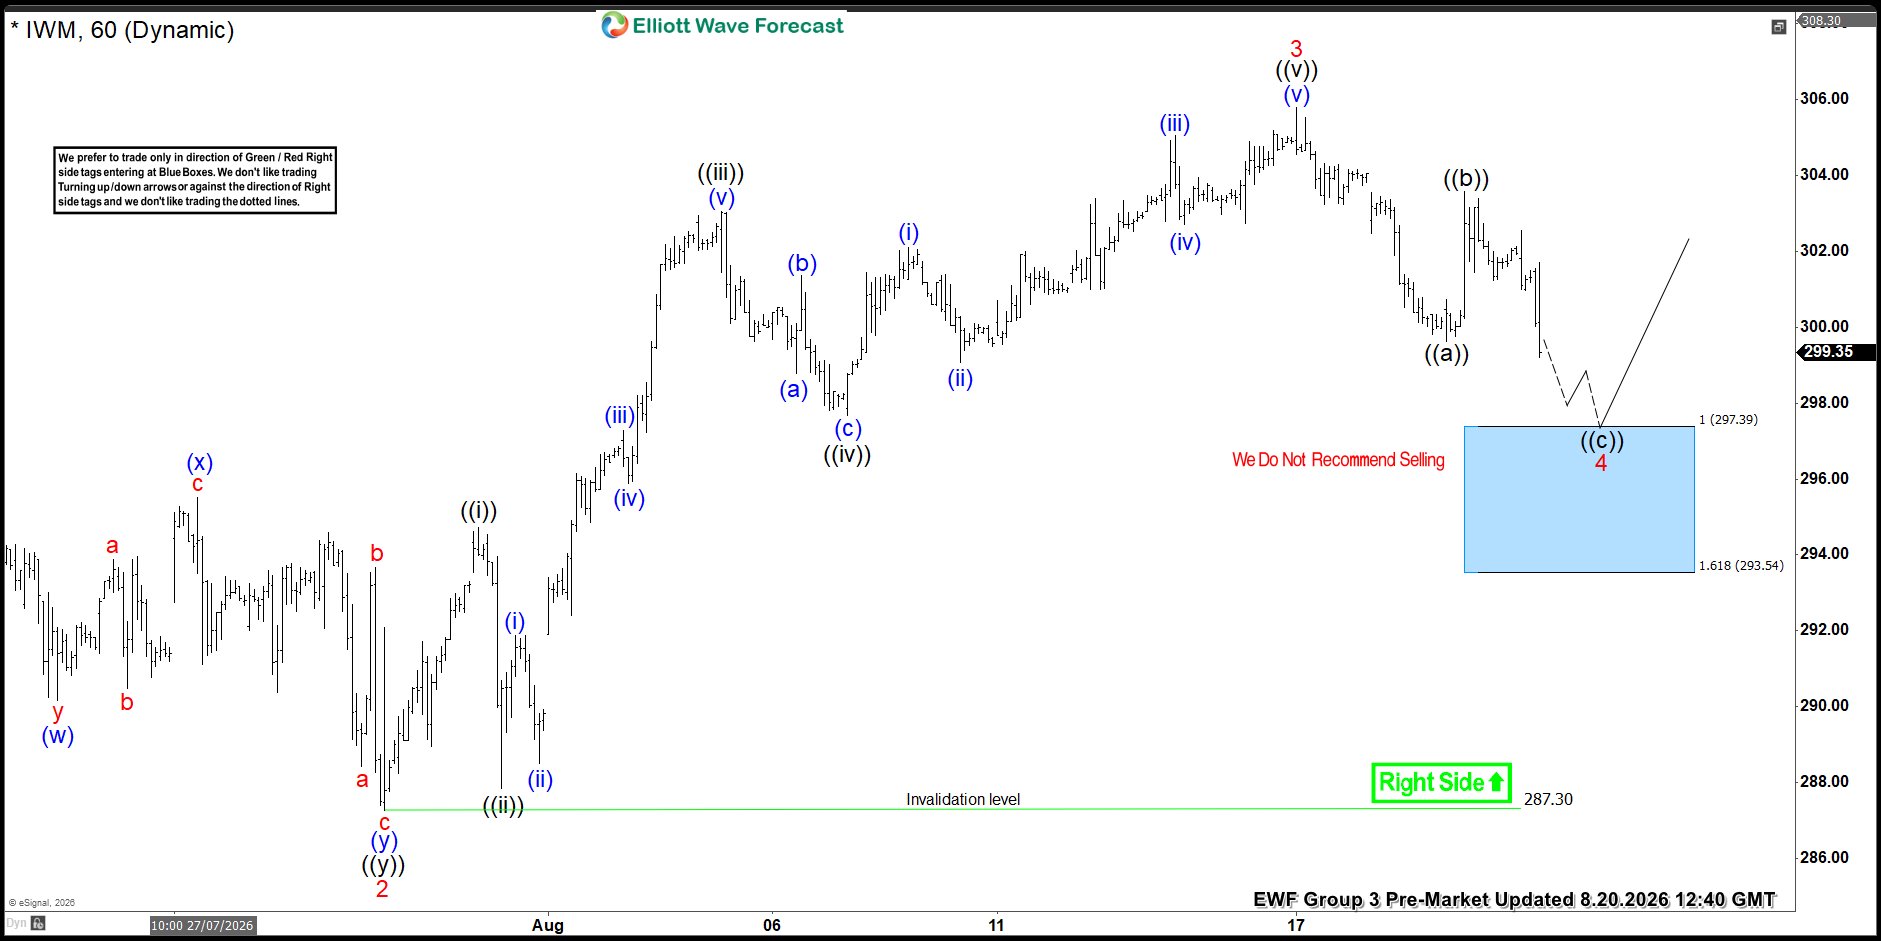
- Rally from July 29 low ended wave 3 at $305.20.
- Wave 4 pullback unfolded as a zigzag correction:
- ((a)) ended at $299.64.
- ((b)) bounced to $303.58.
- ((c)) reached the blue box at $297.39–$293.54.
- Buyers were expected to emerge from this zone for the next leg higher or at least a 3‑wave bounce.
August 24, 2026 (1‑Hour Chart Update)
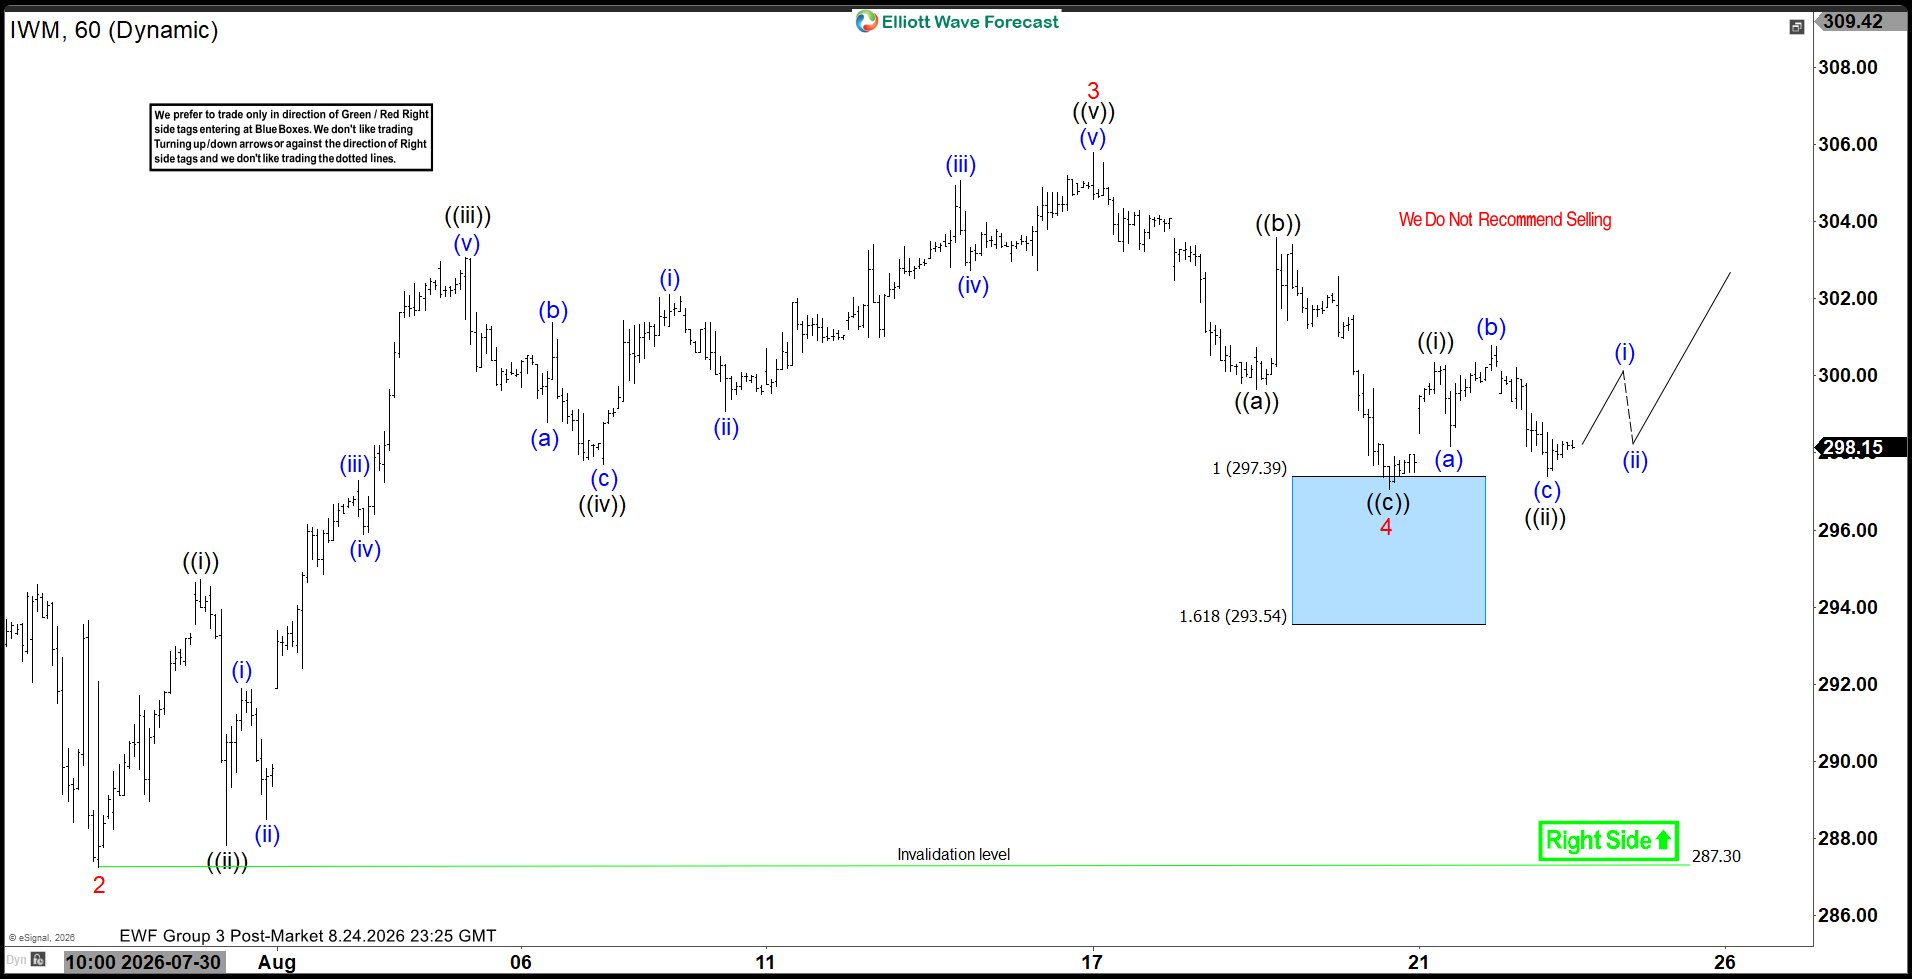
- IWM reacted strongly higher after completing the zigzag correction in the blue box.
- Members secured risk‑free positions shortly after entry.
- A decisive break above $305.20 is needed to confirm the next leg higher toward $307.88–$311.24, before profit‑taking and another pullback in 3 or 7 swings.
Trading Insight
Real‑time IWM analysis and intraday alerts are available with our 14‑Day Trial. Success in trading requires disciplined risk and money management, combined with a solid grasp of Elliott Wave, cycle analysis, and correlation. Our strategy defines precise entries, stop‑losses, and profit targets to help manage risk and capture high‑probability setups. Join today to learn the method and trade with professional‑grade rules.



