

Calling a market bottom after the rally is easy. Identifying the opportunity while the correction is still unfolding is what really matters.
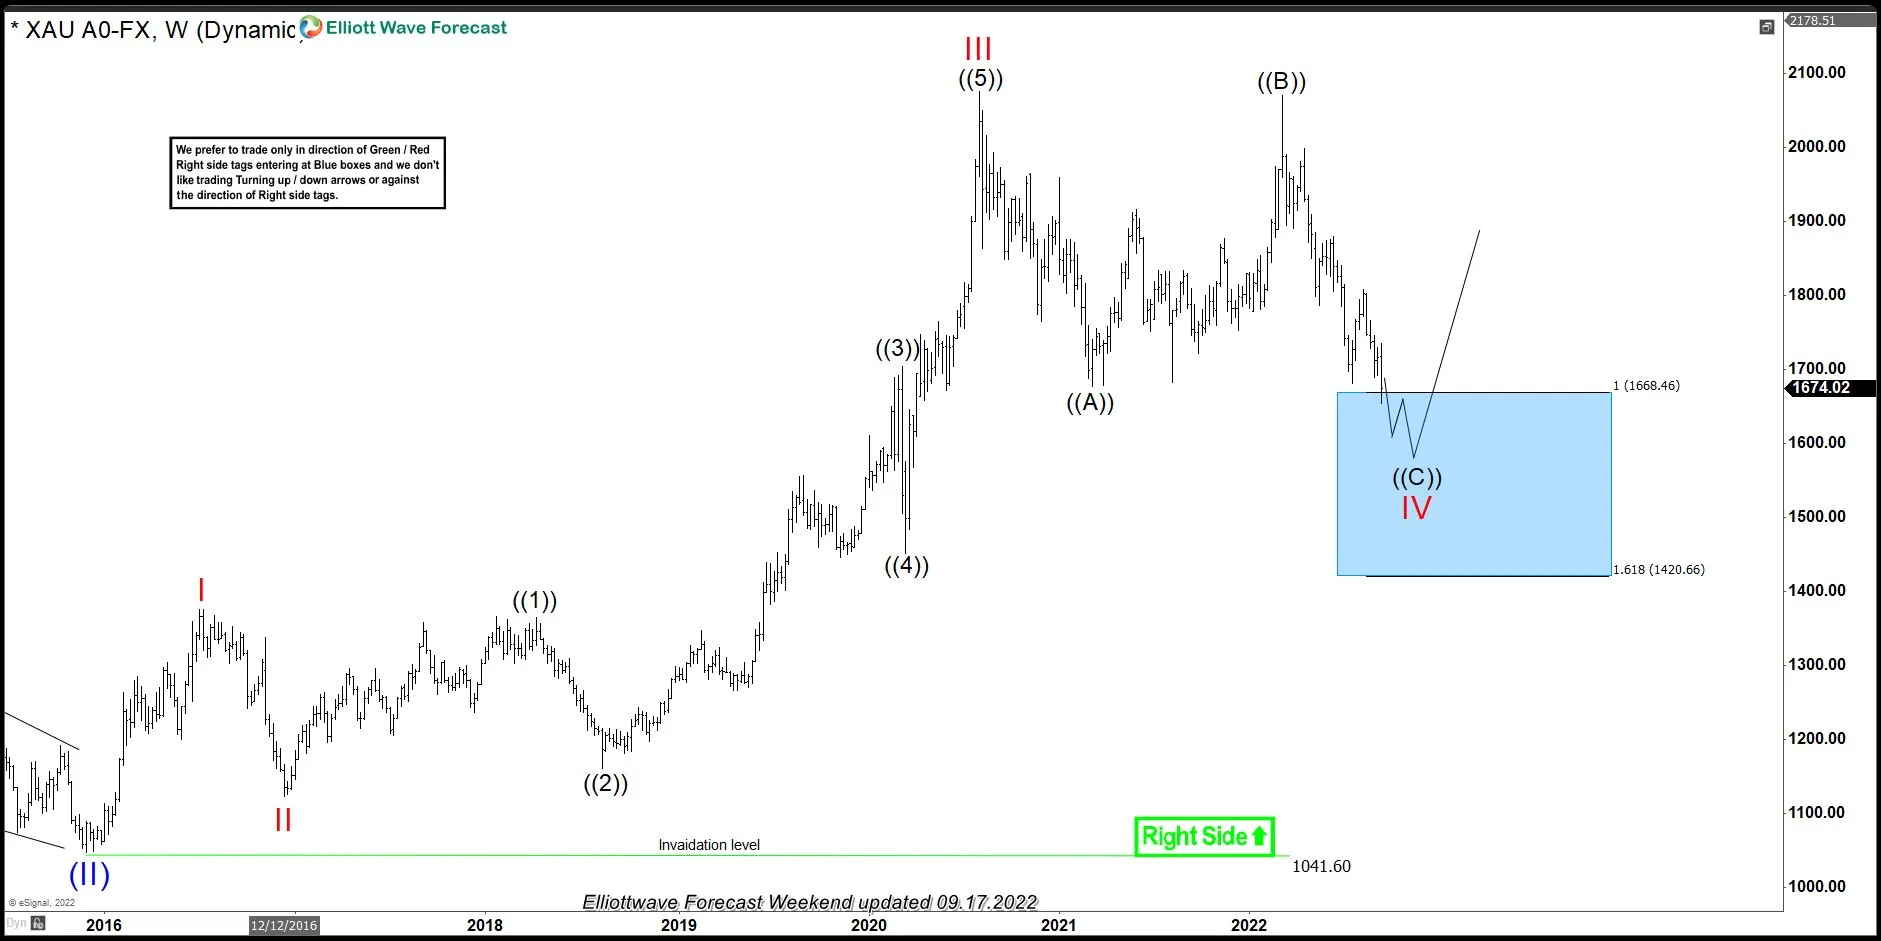
In September 2022, GOLD reached the Blue Box buying zone highlighted on our members’ weekly Elliott Wave charts. While the commodity remained under pressure, our analysis suggested that the correction was approaching completion. We advised members to avoid selling and maintained a bullish stance from the highlighted area.
What followed was one of the most powerful GOLD rallies in recent history.
In the following text, you will find an explanation of the 2022 trading setup, as well as our latest weekly chart update.
GOLD Weekly Elliott Wave Analysis: The 2022 Buying Zone
At the time of our original forecast, GOLD was correcting the bullish cycle from the 1041.60 low. The decline reached the Equal Legs area highlighted on our chart as a Blue Box buying zone : 1668-1420.
The Elliott Wave structure suggested that sellers were entering a high-risk area and that buyers could soon take control. Rather than chasing the decline, we advised members to avoid selling GOLD and prepare for a reaction from the Blue Box. From that area, we expected rally toward new highs. The setup also included a clearly defined invalidation level at 1420.66.
The plan was clear: identify the buying zone, define the risk and allow the bullish sequence to develop.
Quick Guide to Reading Our Charts
- Green bullish stamp + Blue Box = Buying setup
- Red bearish stamp + Blue Box = Selling setup
- Black stamp = No trade. The chart does not currently present a valid trading setup.
Official trading strategy on How to trade 3, 7, or 11 swing and equal leg is explained in details in Educational Video, available for members viewing inside the membership area.
GOLD Weekly Elliott Wave Analysis: 08.15.2026
Now we can see, our buying zone is far away. GOLD found buyers inside the highlighted Blue Box Area (1668-1420). The initial reaction developed into a powerful bullish cycle that eventually pushed the commodity toward the 5,500 area. At its peak, GOLD had advanced approximately 240% from the 2022 buying zone. Even after the latest pullback, the commodity remains around 174% above the area identified in our original forecast.
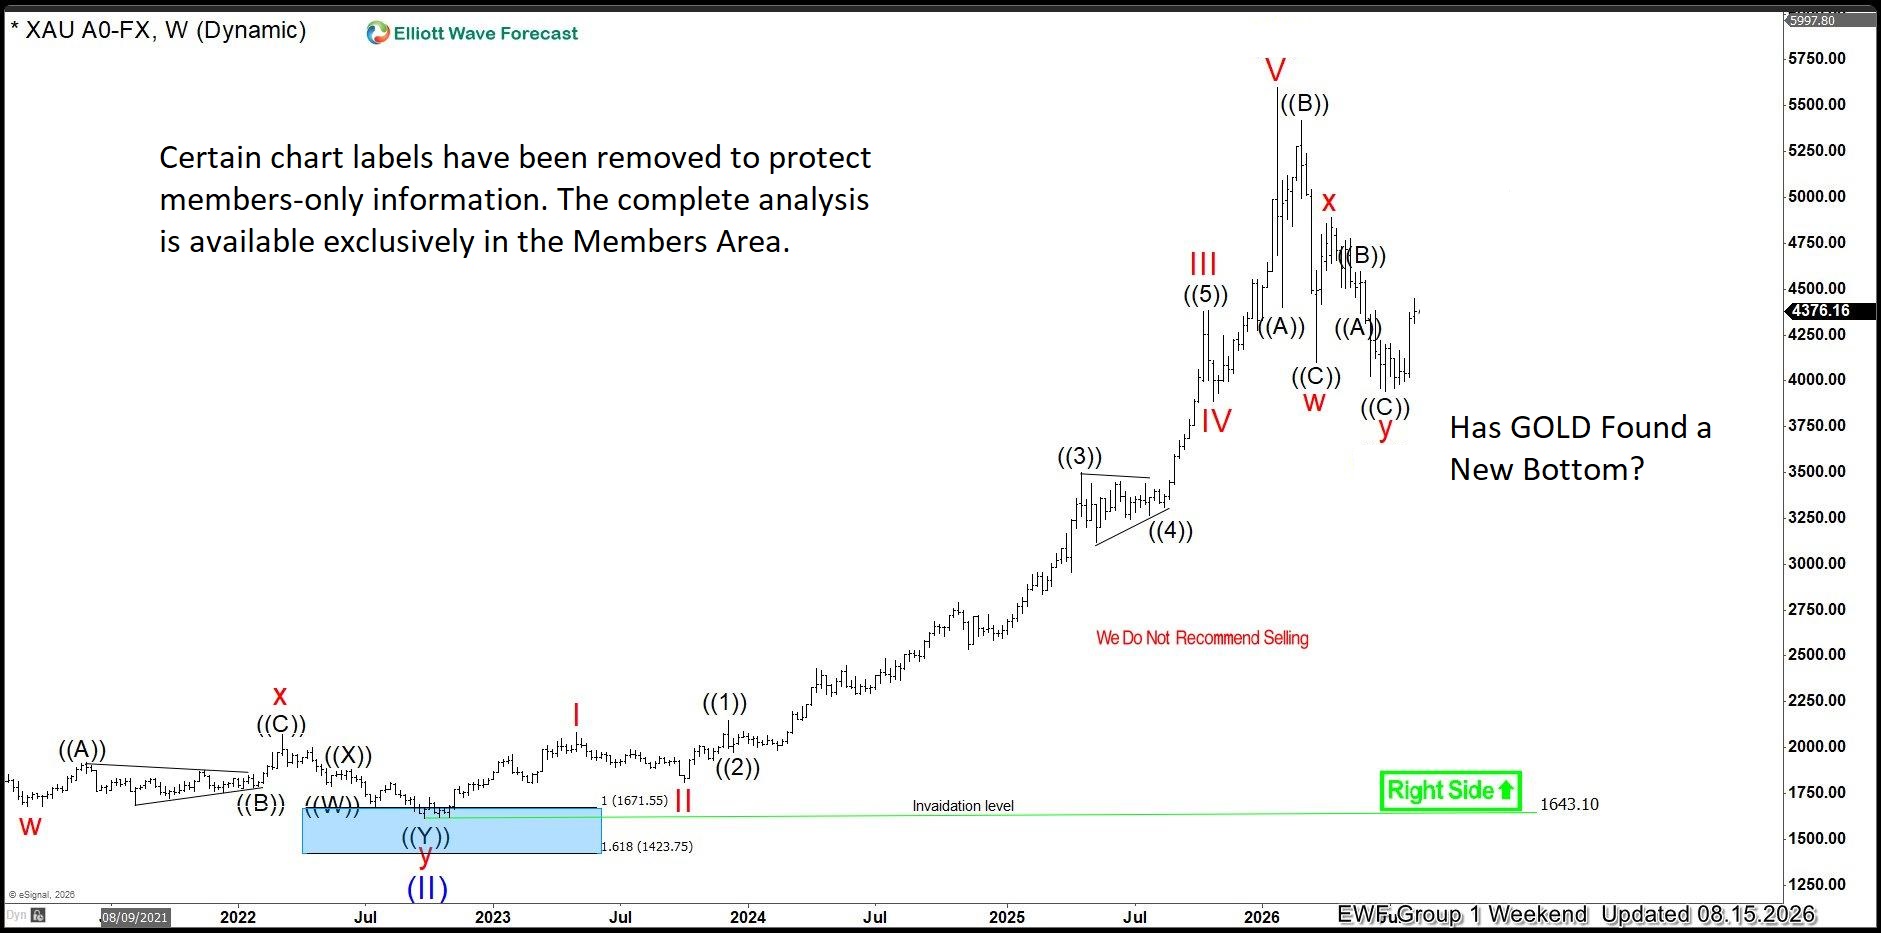
Our 2022 call is now history—and the 174% advance speaks for itself. The more important question is what GOLD may be preparing to do next.
Following its historic run and recent pullback, GOLD has already started to bounce from the latest low. But is this simply a short-term reaction, or the beginning of a new bullish cycle?
For another major rally to take shape, the current correction must remain above the key low at 3,936. Buyers would then need to confirm the bullish scenario by producing a clear impulsive advance. Such a move would strengthen the case that GOLD has established an important bottom and is preparing for its next leg higher.
The complete forecast—including our current wave count, key support, invalidation and upside target levels—is available exclusively to members.
Your full GOLD forecast is only a few clicks away.
Regular 14-Day Trial: $9.99
Limited-Time Price: Only $0.99
Access the Complete GOLD Analysis—Start Your 14-Day Trial for $0.99
Inside your membership, you’ll receive:
✅ Real-Time Trading Recommendations — with clearly defined Entry, Stop Loss, and Take Profit levels for each setup.
✅ Live Trading Room Access — follow professional trade setups as they develop in real time.
✅ 24-Hour Chat Room Support — ask unlimited questions and receive guidance from experienced analysts throughout the trading week.
✅ Expert Multi-Market Analysis — covering Forex, Stocks, Indices, ETFs, Commodities, and Cryptocurrencies.
✅ Exclusive Educational Videos — included at no additional cost, with practical lessons on Elliott Wave theory, trading strategies, risk management, and trade execution.
✅ Learn the Process Behind Every Setup — understand how experienced analysts identify opportunities, define risk, and manage trades as market conditions evolve.




