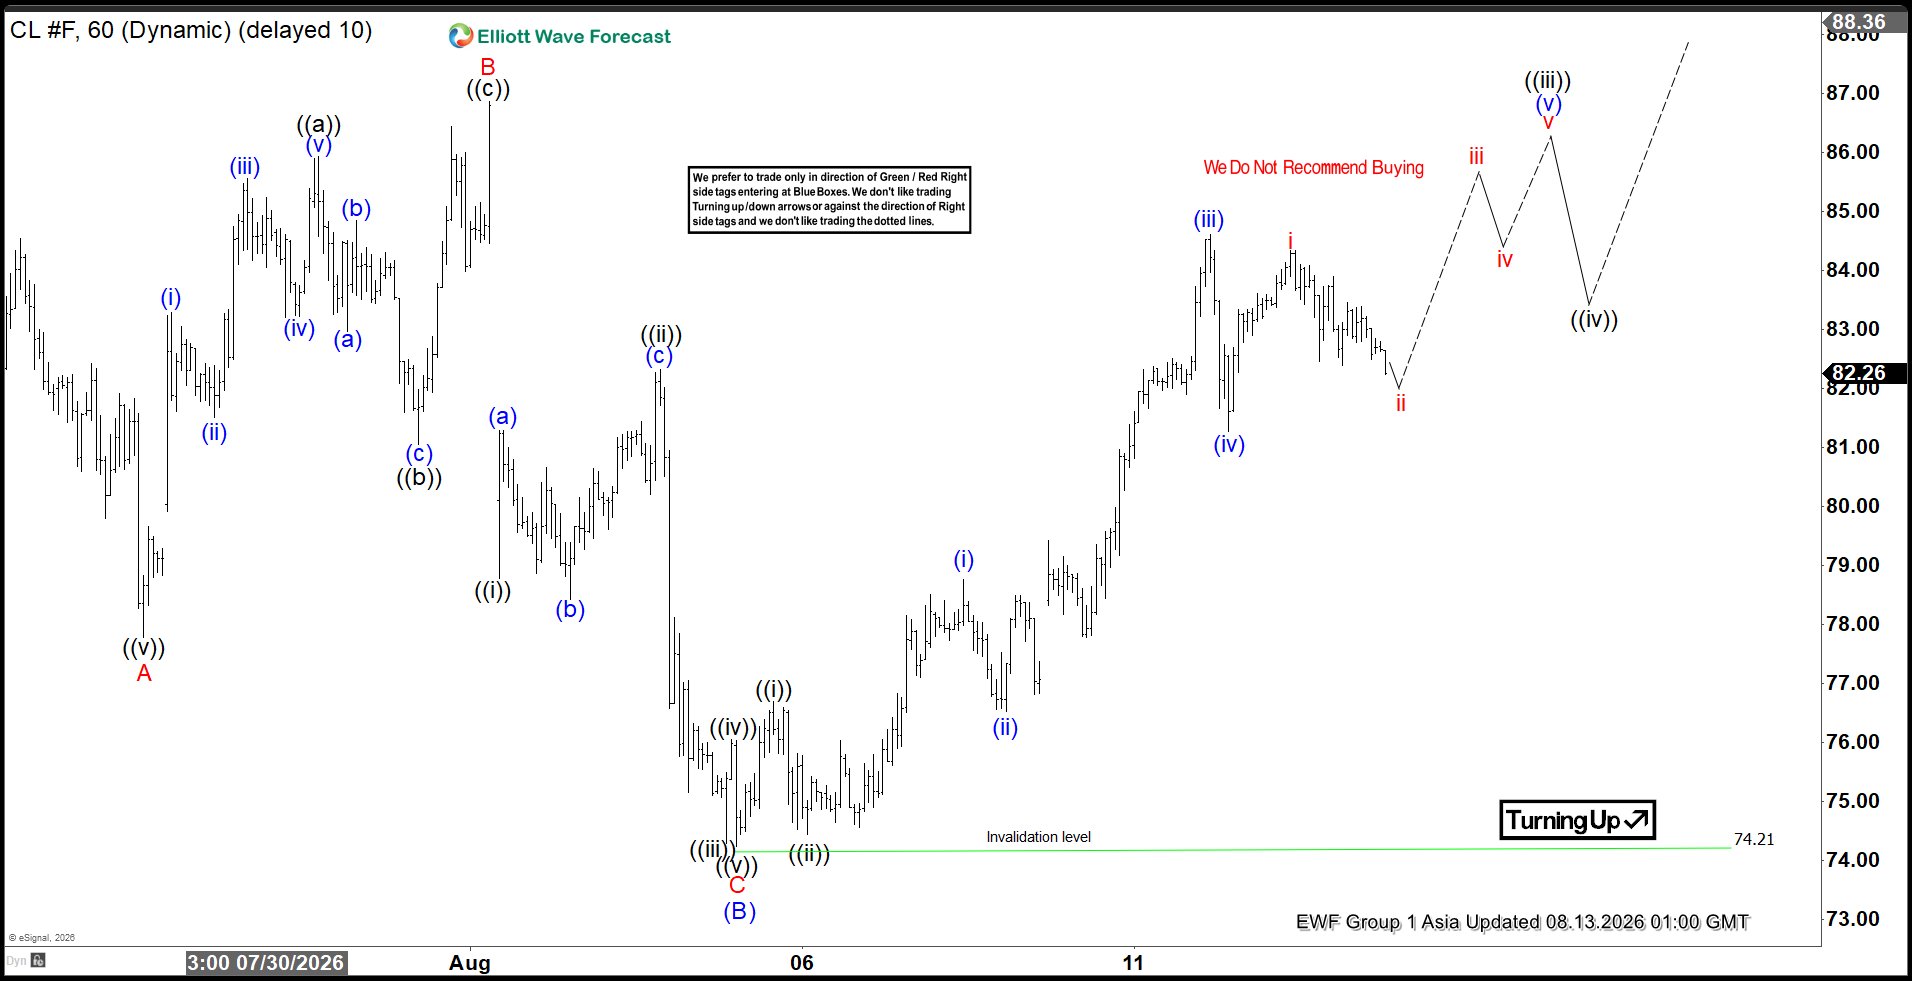
The short‑term Elliott Wave outlook in Oil indicates that the cycle from the July 2, 2026 low remains impulsive and favors further upside. The initial five‑wave rally from that low concluded in wave (A) at $93.50. A corrective pullback in wave (B) is proposed complete at $74.21, as reflected in the one‑hour chart. The internal subdivision of wave (B) unfolded as a zigzag structure. Down from wave (A), wave A ended at $77.78, followed by wave B at $86.87. The final leg, wave C, terminated at $74.21, thereby completing wave (B) in higher degree.
Oil has since resumed higher in wave (C). However, a decisive break above the prior wave (A) peak at $93.50 is required to eliminate the risk of a double correction. From wave (B), wave ((i)) ended at $76.70, while the pullback in wave ((ii)) concluded at $74.75. The instrument then advanced in wave ((iii)), forming another impulsive sequence of lesser degree. Within this progression, wave (i) ended at $78.77, and wave (ii) dips found support at $76.53. Wave (iii) extended higher to $84.61, followed by a corrective wave (iv) at $81.27. Near term, as long as the pivot at $74.21 remains intact, dips are expected to find support in either three or seven swings, favoring continuation to the upside. This structure underscores the bullish potential, with the market poised for further extension once key resistance levels are surpassed.