

In technical analysis and Elliott Wave Theory, simple corrections like single A-B-C zigzags are easy to spot. However, financial markets frequently spend prolonged periods consolidating sideways, grinding price action through complex double corrections—labelled as WXY structures (or Double Threes / Double Zigzags).
While a WXY pattern can look like unpredictable noise to untrained observers, it is governed by extraordinary mathematical harmony. At the centre of that harmony sits the Fibonacci Sequence and the Golden Ratio (0.618).
Understanding how Fibonacci ratios govern both the connecting waves and terminal legs in a WXY pattern allows traders to turn chaotic sideways chop into high-probability execution setups.
Anatomy of a WXY Complex Correction
Before exploring the mathematical relationships, let’s break down the structural framework of a WXY correction:
- Wave W: The initial corrective leg (typically a simple 3-wave zigzag or flat).
- Wave X: The connecting counter-trend wave that links the two corrective structures together.
- Wave Y: The final corrective leg that completes the overall consolidation before the primary trend resumes.
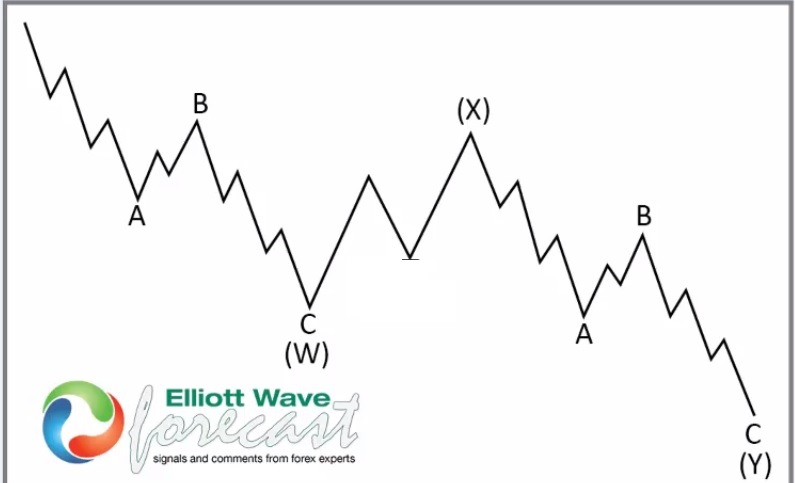
Market makers use WXY structures to digest major price moves across both time and price without prematurely pushing the market past critical higher-timeframe support or resistance levels.
Key Fibonacci Relationships in WXY Structures
Fibonacci ratios operate across two core dimensions in a WXY pattern: retracements on the connecting Wave X and extensions on the primary Wave Y.
- Wave X: The Golden Retracement (0.618)
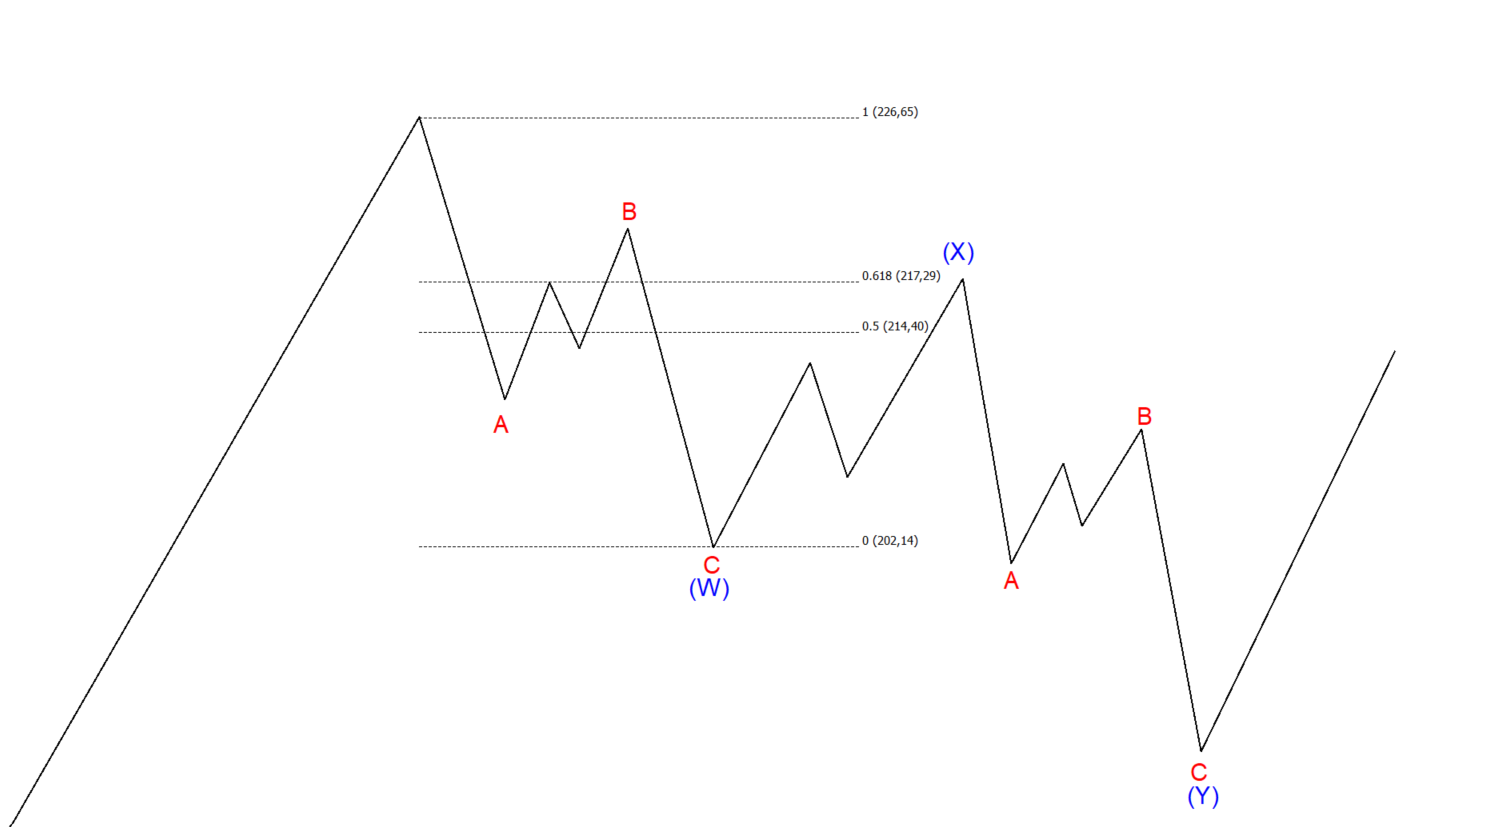
Wave X serves as a “trap” wave designed to lure market participants into believing the primary trend has resumed early.
- Standard Retracements: Wave X typically retraces 50%, 8% (0.618), or 78.6% of Wave W.
- The 0.618 Rejection Threshold: The 8% Fibonacci retracement is the most common rejection level for Wave X. When a counter-bounce stalls precisely near the 61.8% level of Wave W, it provides early structural confirmation that Wave X is completing, and Wave Y is about to unfold.
2. Wave Y: Proportional Geometry Relative to Wave W
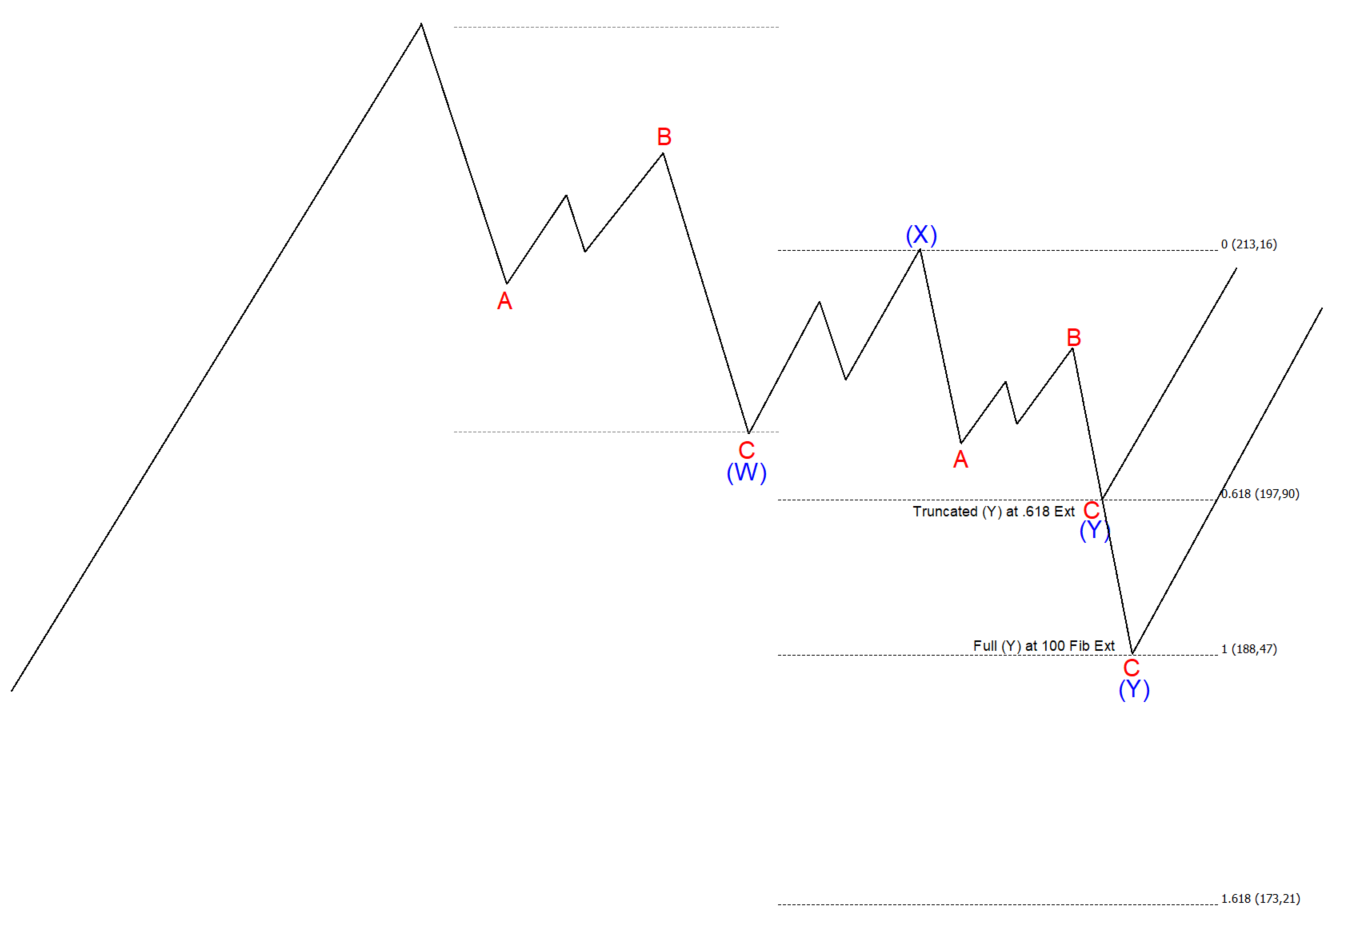
Wave Y completes the overall pattern and exhibits specific Fibonacci expansion/compression relationships when measured relative to Wave W:
- Equality (1.000): In standard Double Threes, Wave Y frequently equals Wave W (100% extension) which we normally call our Blue box area.
- The 0.618 Compression: In shallower or truncated corrections, Wave Y often equals 8% of Wave W which will catch most traders off-guard.
- The 1.618 Expansion: In aggressive, deep double zigzags, Wave Y extends to 8% (1.618) of Wave W.
The Power of Internal Sub-Wave Projections (.618 fib Extension)
To achieve maximum timing precision, professional traders zoom into lower timeframes to analyse the internal sub-waves (a-b-c or w-x-y) inside Wave Y.
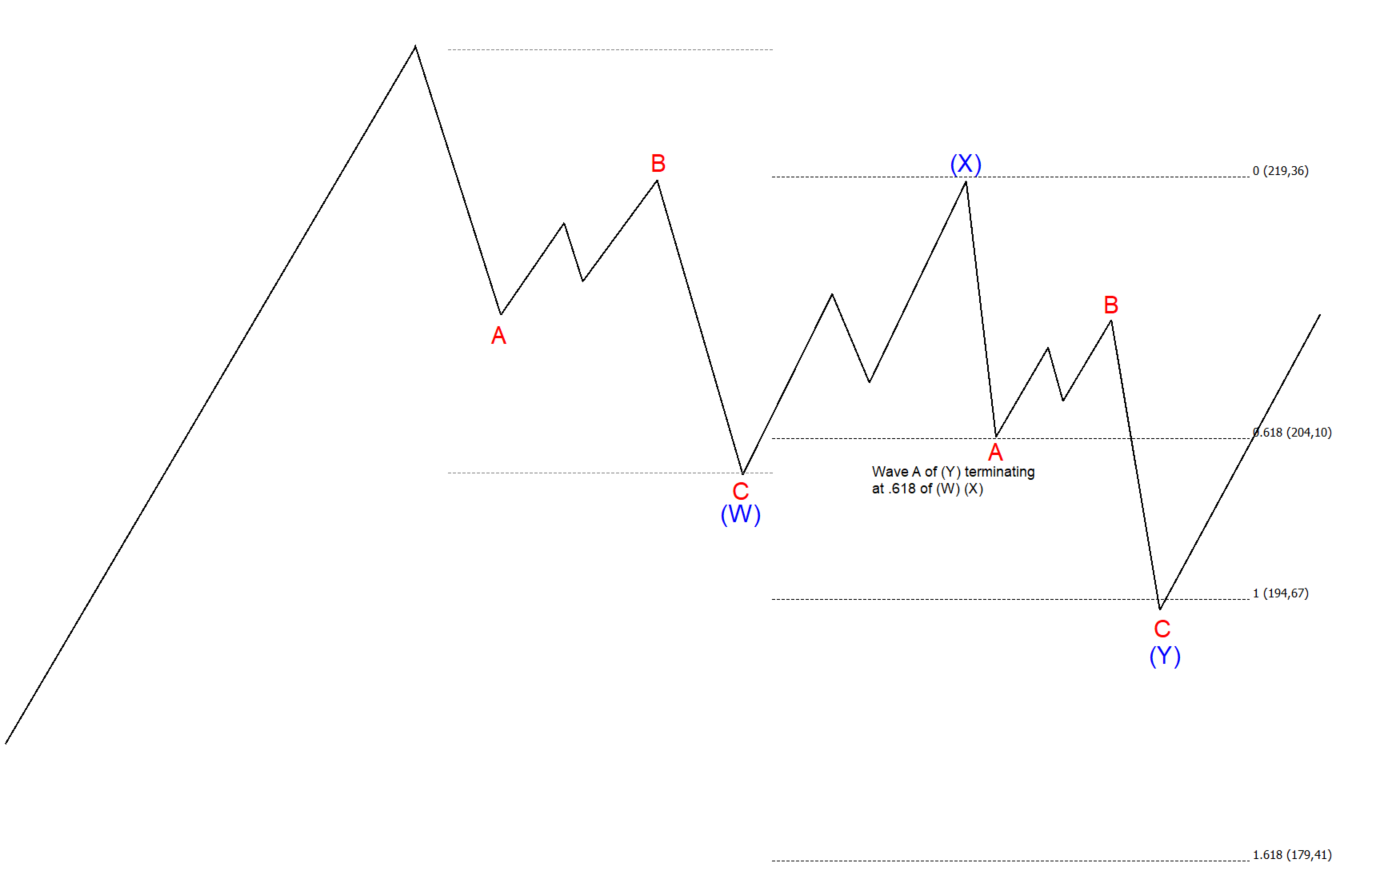
When you apply the Fibonacci extension from the start of the larger wave W to its end and back to X, the internal structure of wave Y—whether unfolding as a‑b‑c or w‑x‑y—often aligns with the .618 extension of the broader W‑X pull. If the sub‑wave a or w of Y terminates precisely at that .618 level, it provides strong indication that price will advance toward the Blue Box area or reach the full 100% extension of the larger WXY sequence, typically following a minor correction within the a or x internals of Y.
Because complex corrections exhaust market momentum over time, the internal sub-waves of Wave Y often show internal exhaustion:
- Internal b-wave: Frequently retraces 61.8% of internal sub-wave a.
- Internal c-wave: Often completes at a 618 – 100 Fibonacci extension of internal sub-wave a (measured from the end of internal sub-wave b).
Fibonacci Measurement Blueprint for WXY Setups
To accurately project the termination of a WXY structure, layer these specific measurements across your charts:
| Measurement Layer | Fibonacci Tool | Anchor Points | Primary Target Ratios |
| Connecting Wave X | Fib Retracement | Start of W to End of W | 50%, 61.8%, 78.6% |
| Macro Wave Y Target | Trend-Based Fib Extension | Start of W to End of W to End of X | 61.8%, 100%, 161.8% |
| Micro Sub-Wave Y Target | Trend-Based Fib Extension | Start of Sub-wave a to End of a to End of b | 61.8%, 100% |
The Ultimate Edge: Dual Fibonacci Confluence
The highest-probability trades occur when higher-timeframe macro projections overlap directly with lower-timeframe internal projections.
The Golden Confluence Zone:
A high-conviction entry zone occurs when a Macro Wave W-X 100% extension target aligns within a tight price band alongside a Micro internal sub-wave 100 – 1.618 extension area inside Wave Y.
When two independent Fibonacci measurements converge on the exact same price handle, it signals that both macro-timeframe market structure and micro-timeframe momentum exhaustion have reached a critical inflection point simultaneously.
Key Takeaways
- WXY structures are double corrective patterns that connect two standard corrections via a link wave (X).
- Wave X frequently pivots at the 8% Fibonacci retracement of Wave W.
- Macro Wave Y targets primary Fibonacci extensions at 8%, 100%, or 161.8% of Wave W.
- Combining higher-timeframe W-X projections with internal 100 – 1.618 sub-wave extensions inside Wave Y provides clean, low-risk reversal zones right when the primary trend is ready to resume.
Core Trading Rules
- Avoid Trading Inside Wave X: Wave X is packed with false breakouts and choppy price action. Patience means waiting for Wave X to complete before taking a position for Wave Y or the main trend resumption.
- Treat Fibonacci Levels as Zones: Ratios represent areas of interest rather than exact tick-perfect lines. Always pair Fibonacci confluence with price action, market structure breaks, or key support/resistance levels.
- Maintain Strict Risk Controls: Place your stop-loss just beyond the confluence zone or the origin of Wave W. If price breaks forcefully beyond a 161.8% extension, the count is invalidated, and you should exit immediately.
Final Thoughts
Complex WXY corrections are designed to wear out retail traders and sweep stops. Once you learn to map the structure and apply the 0.618 ratio across Wave X, macro projections, and internal sub-waves, you can cut through the market noise and enter high-probability setups with tight, well-defined risk.
Why EWF?
At Elliottwave Forecast (EWF), we deliver consistent market updates through regular charts update. Our analysts update 1‑hour charts four times daily and 4‑hour charts once per day across all 78 instruments. In addition, we host five live sessions each day and maintain a 24‑hour chatroom, providing clients with real‑time market guidance and answers to any questions they may have.
You can start a 14‑day trial with us today here and cancel anytime by emailing support@elliottwave-forecast.com




