

GBP/CAD has spent the past few weeks tracing out a clean five-wave rally on the 1-hour chart, and now the pair looks to be working through the correction that typically follows a completed impulse. Here’s a breakdown of the structure and what it could mean for the path ahead.
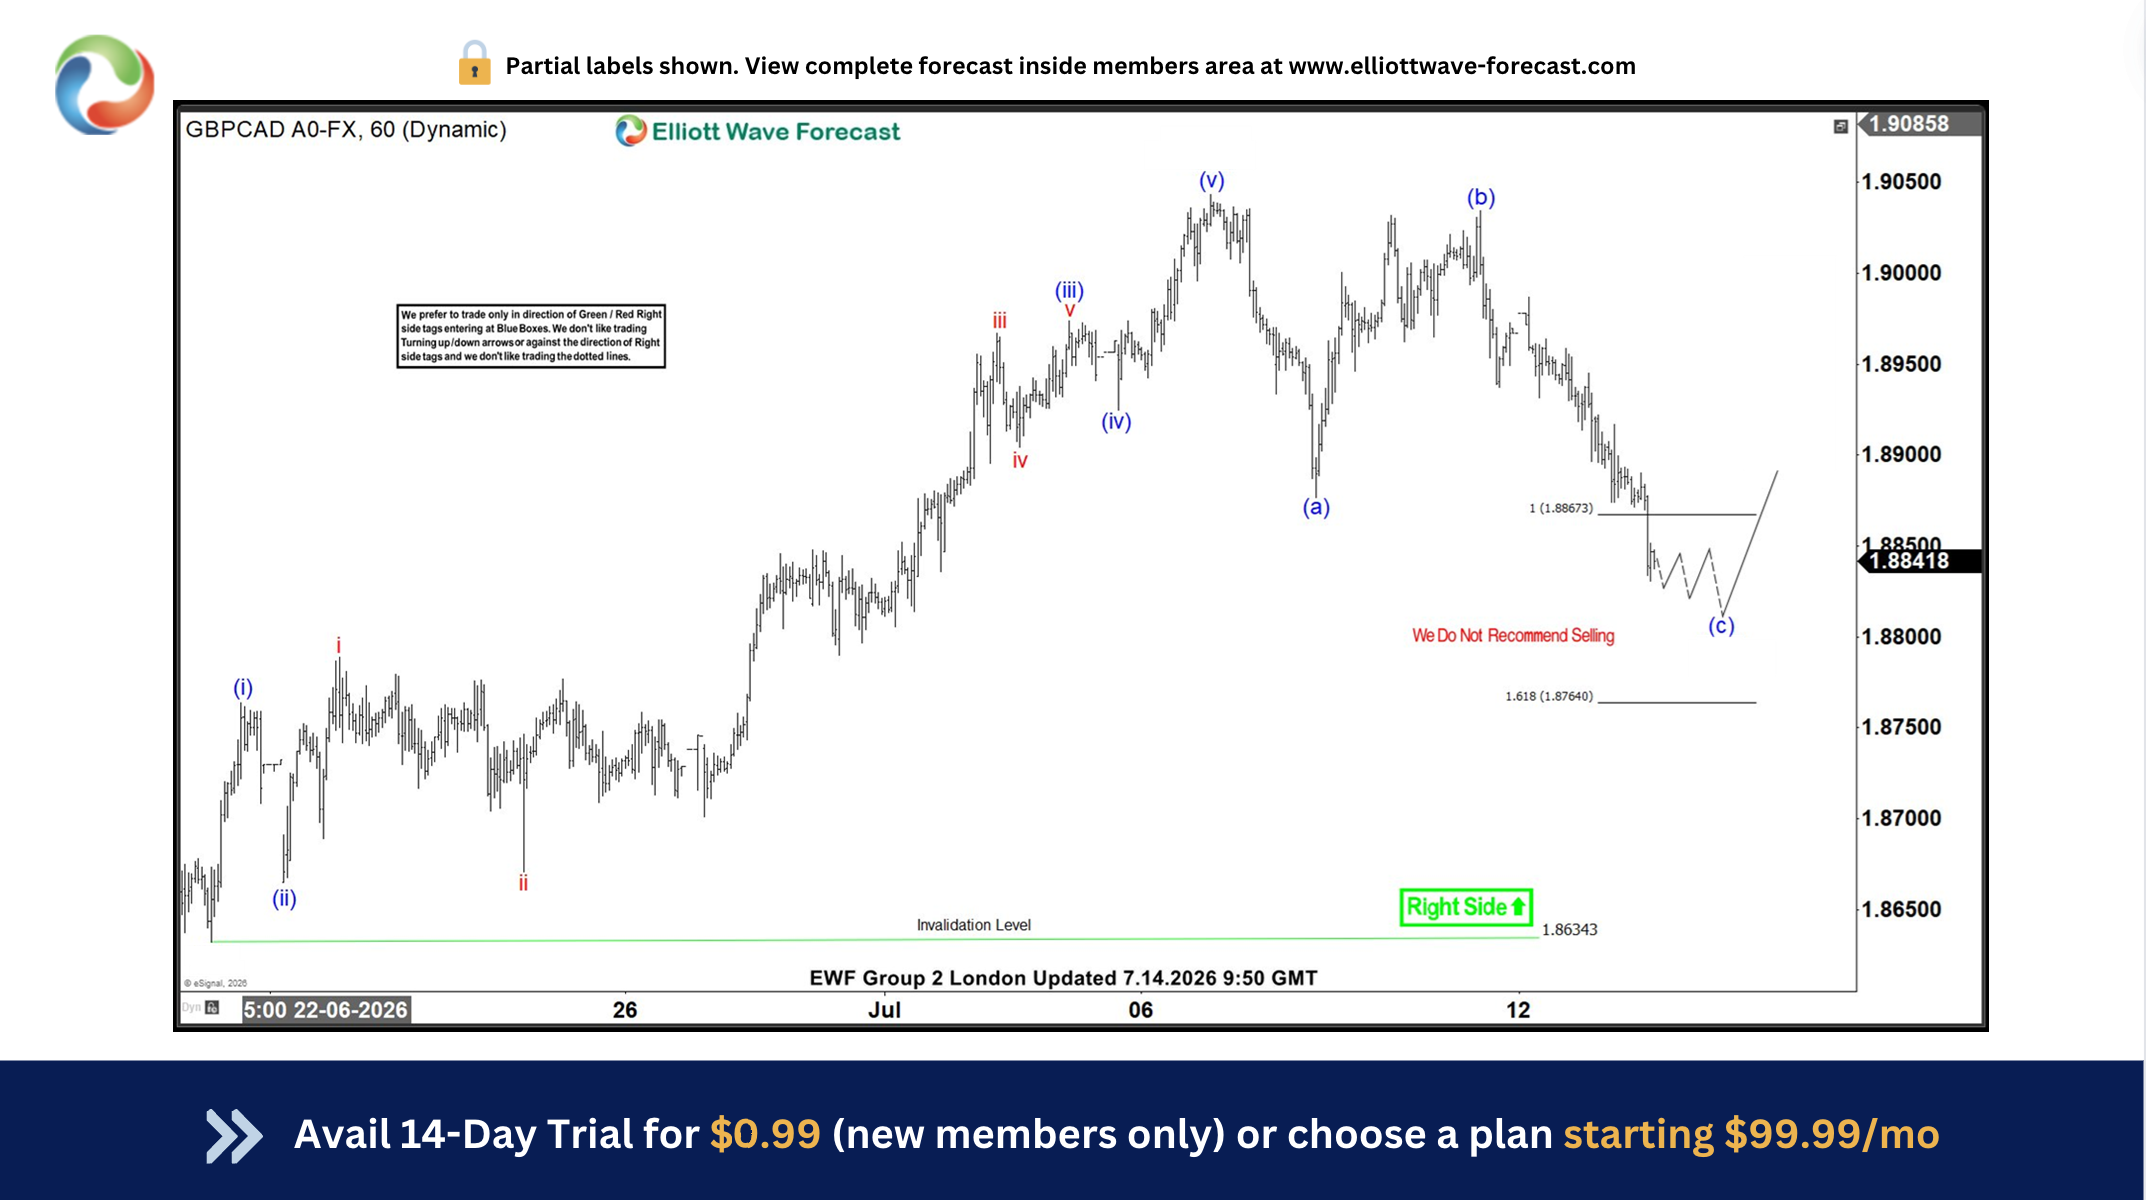
The Rally: A Textbook Five-Wave Advance
Starting from the June 22 low near 1.863, GBP/CAD pushed higher in a sequence that fits the classic five-wave impulse pattern:
- Wave (i) kicked off the advance, followed by a shallow wave (ii) pullback that held well above the starting point.
- Wave (iii) was the strongest leg of the move, itself breaking down into a smaller five waves (i–v) as the pair accelerated toward the 1.895–1.900 area.
- Wave (iv) brought a brief, contained dip before buyers stepped back in.
- Wave (v) carried price to the cycle high just above 1.905, completing the five-wave structure and marking the top of the rally.
That high represents the point where the bullish impulse likely finished, opening the door for a corrective pullback.
The Correction: An A-B-C (ZigZag) Pattern Taking Shape
What is an A-B-C (ZigZag) Pattern?
The image below illustrates an A‑B‑C Zigzag structure, similar to the one highlighted on the GBPCAD chart above.
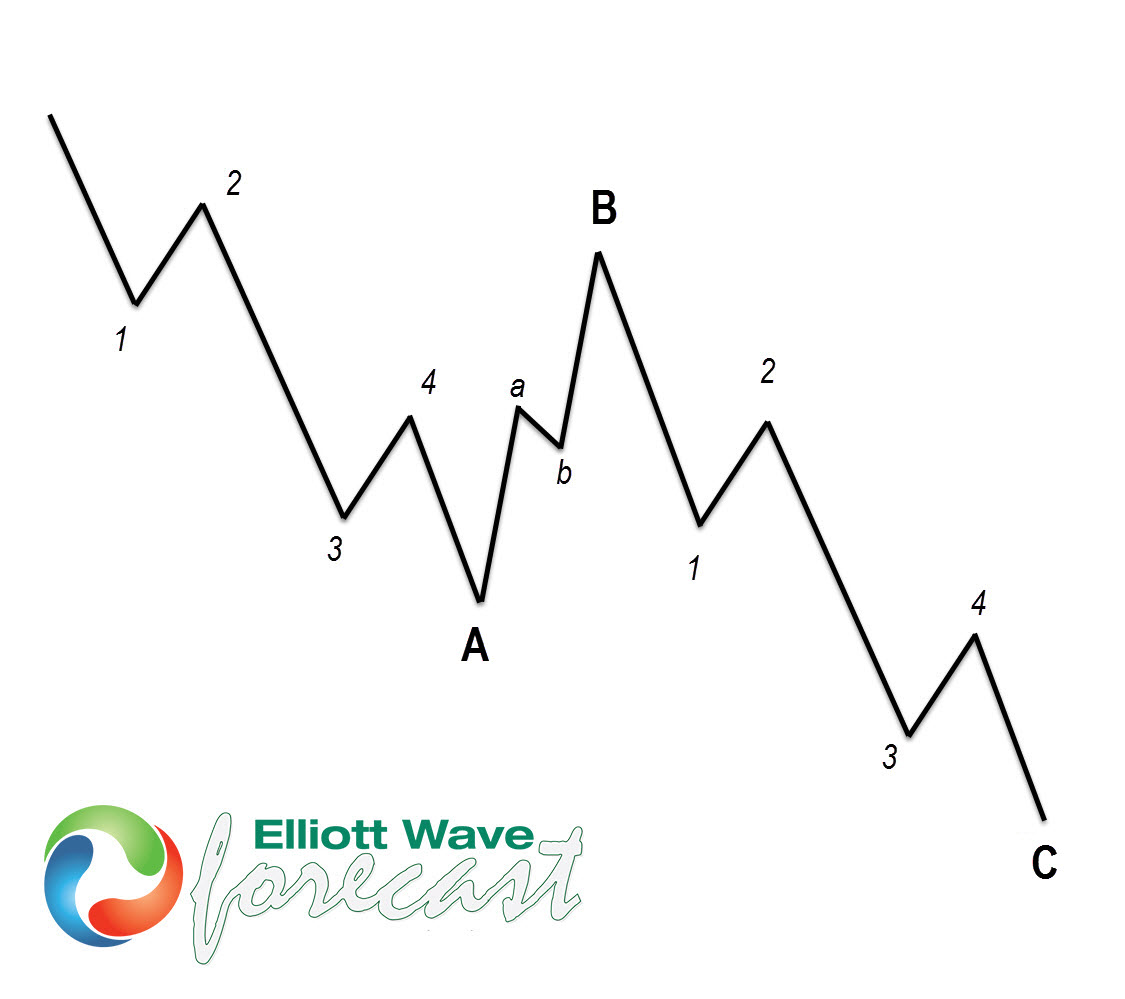
A Zigzag structure in Elliott Wave Theory is a sharp three‑wave corrective pattern labelled A‑B‑C, with a distinct 5‑3‑5 subdivision. It represents a counter‑trend move and is one of the most common corrective formations.
- Wave A → 5 sub‑waves (impulsive decline or rise depending on trend).
- Wave B → 3 sub‑waves (a smaller counter‑move).
- Wave C → 5 sub‑waves (another impulsive move, usually equal to or longer than Wave A).
Trading Insights
- Zigzags often signal continuation after correction, making them useful for identifying re‑entry points in the direction of the larger trend.
- Traders watch for Blue Box zones (high‑probability reversal areas) to align entries with the end of Wave C.
- Recognizing zigzags helps avoid mistaking them for trend reversals—they are corrective pauses, not new dominant trends.
Now that we understand what a Zigzag correction is, we can clearly connect that concept to the corrective structure shown in the GBPCAD chart above.
Since topping out, GBP/CAD has been unwinding in a standard three-wave (A-B-C) correction:
- Wave (a) dropped sharply off the highs, retracing a large chunk of the prior advance.
- Wave (b) brought a corrective bounce back up toward the 1.903 area — a classic “relief rally” that retraces part of wave (a) without exceeding the prior high.
- Wave (c) is now underway, pressing the pair back down toward the 1.884–1.876 zone, with a key Fibonacci extension level sitting around 1.876.
As of the most recent update, price is trading around 1.884, right in the area where wave (c) is expected to find support and complete the pullback.
What Comes Next
Based on this count, the correction is viewed as a buying opportunity rather than a setup to sell. The expectation is for GBP/CAD to carve out a smaller, choppy dip-and-recovery pattern near current levels before turning back higher, targeting a resumption of the broader uptrend. A key support/invalidation zone sits down near 1.863 — a break below that level would call the entire bullish wave count into question.
The Final Leg Down Completed as Expected
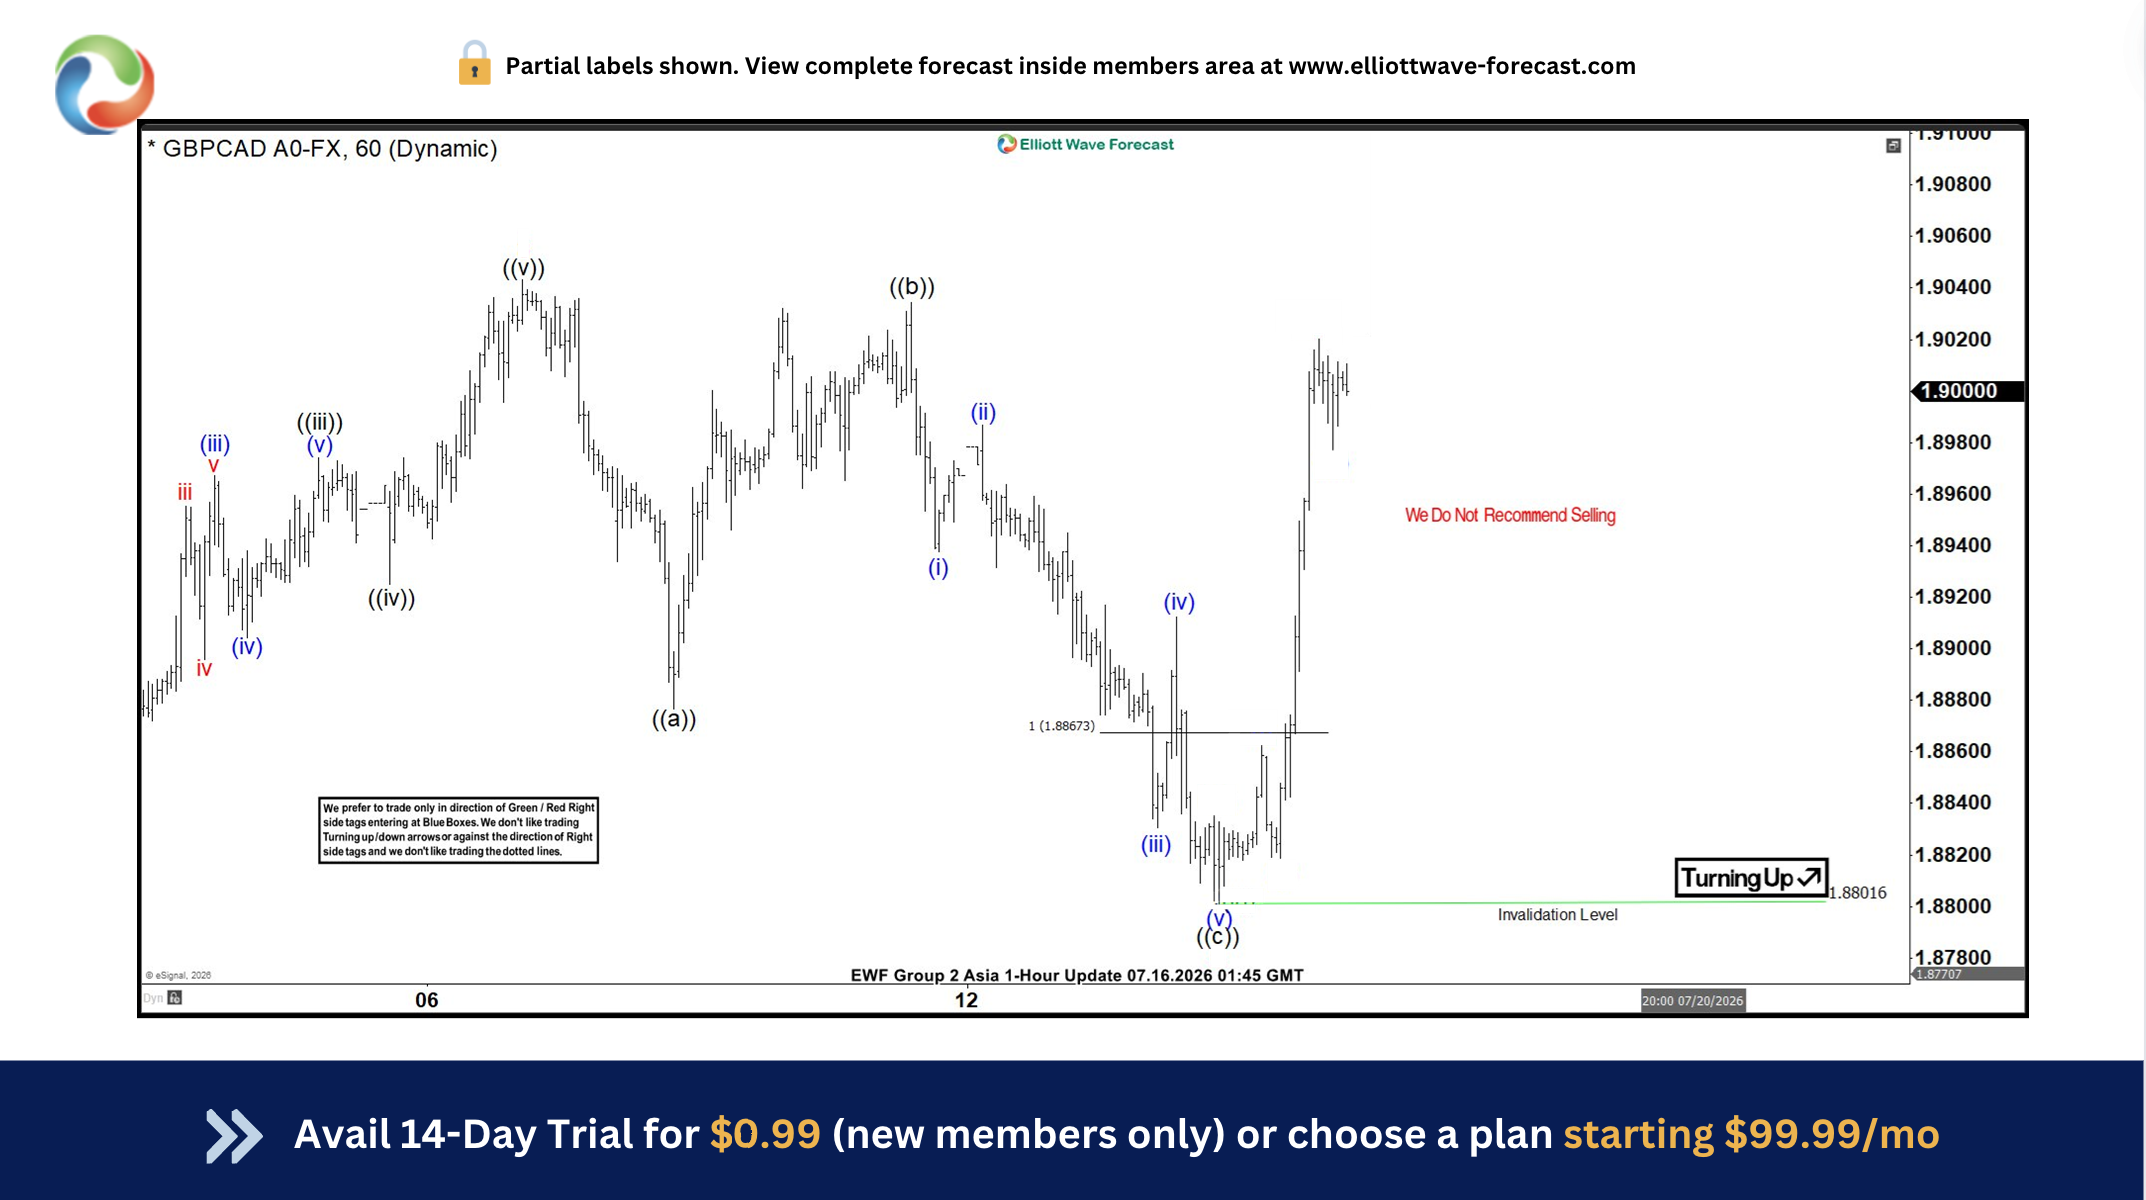
Zooming into the internal structure of wave ((c)), price carved out a clean five-wave decline (labeled (i) through (v)) that bottomed right at the extreme of the expected support zone, just above 1.880. That low landed almost exactly on the invalidation level near 1.88016, which is precisely the kind of reaction technicians look for — a move that reaches into a well-defined support area, taps it, and reverses rather than breaking cleanly through it.
That low marks the completion of the entire corrective sequence from the 1.905 high: wave ((a)) down, wave ((b)) bounce back toward 1.903, and wave ((c)) down into the 1.880 extreme.
A Sharp, Decisive Reaction
What stands out most on this update is the strength of the reaction off that low. Rather than a slow, grinding recovery, GBP/CAD snapped back aggressively, rallying from the 1.880 extreme up through 1.890 and on toward the 1.900–1.902 area in a single strong push — essentially retracing the entire wave ((c)) decline in short order. That kind of sharp, impulsive reaction off a support extreme is typically read as a sign that the corrective phase has genuinely finished and that sellers were overwhelmed at the low.
Why the Extreme Mattered
This is a good example of why the 1.876–1.884 zone was flagged as the key area to watch in the first place. It wasn’t just a round-number guess — it lined up with:
- The Fibonacci extension target near 1.876
- The internal five-wave count of wave ((c)) reaching a natural completion point
- A structural invalidation level just below 1.880 that, as long as it held, kept the broader bullish wave count intact
Price respected that confluence, printed the low, and turned — which is exactly the kind of reaction that gives a wave count credibility.
Bottom Line
GBP/CAD did exactly what the prior wave count anticipated: it pushed into the extreme of the support zone, completed a five-wave decline into that area, and reacted sharply higher — a textbook reaction at the extreme that reinforces the case for a resumption of the uptrend.
Why Choose EWF ?
At Elliottwave Forecast (EWF), we deliver consistent market updates through regular charts update. Our analysts update 1‑hour charts four times daily and 4‑hour charts once per day across all 78 instruments. In addition, we host five live sessions each day and maintain a 24‑hour chatroom, providing clients with real‑time market guidance and answers to any questions they may have.
You can start a 14‑day trial with us today here and cancel anytime by emailing




