The Tadawul All Share Index (TASI) is the benchmark of the Saudi Exchange, tracking the performance of all listed companies on its main market. Established in 1985, it reflects the overall health of Saudi Arabia’s equity market and is closely followed by regional and global investors. Calculated using free‑float market capitalization, TASI spans diverse sectors including energy, banking, petrochemicals, telecom, and real estate. Its movements are strongly influenced by oil prices and heavyweight listings such as Saudi Aramco, making it a key barometer of both local sentiment and broader economic trends.
TASI Latest Elliott Wave Monthly Chart From 6.16.2026
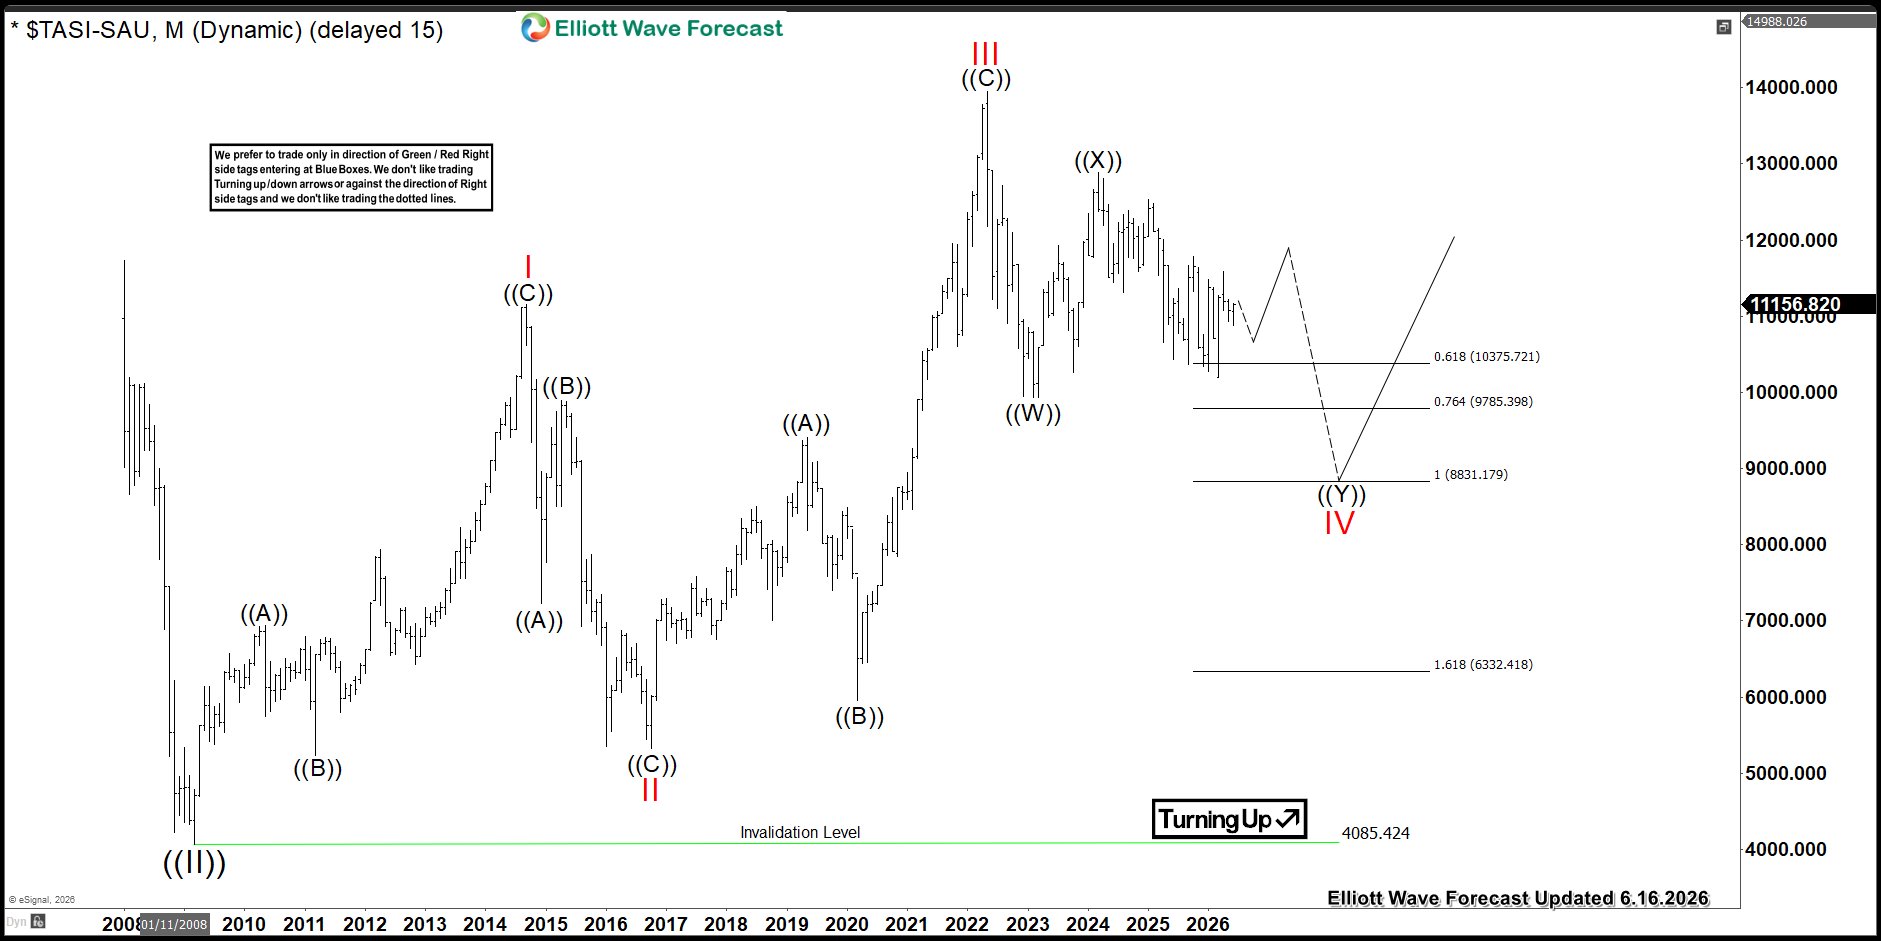
The latest chart highlights the long‑term cycle from the 2009 low, unfolding with overlapping corrective price action. This supports the idea of a leading diagonal structure:
- Wave I ended in three swings at the 11,159 level.
- Wave II retraced in another three swings to the 5,327 low.
- A rally to 13,949 marked the end of Wave III.
- Below that peak, TASI continues to consolidate within the Wave IV pullback.
Internally, the correction appears to be forming a 7‑swing structure:
- Wave ((W)) ended at 9,930.
- A bounce to 12,883 completed Wave ((X)).
- As long as price stays below 12,883, the index can extend lower in Wave ((Y)) toward the 8,831–6,332 extreme area to complete its weekly correction.
- A decisive break below 9,930 would confirm the next leg lower.
Trading Insight
Get continuous, real‑time coverage of TASI and related stocks with our on‑demand analysis — including live updates and intraday price‑action alerts. Success in trading requires disciplined risk and money management, combined with a solid grasp of Elliott Wave, cycle analysis, and intermarket correlation. Our strategy defines precise entries, stop‑losses, and profit targets to help manage risk and capture high‑probability setups. To learn the method and trade with professional‑grade rules, start a trial of our service today.


