Hello fellow traders.
In this technical article, we’re going to take a look into the Elliott Wave charts of USDJPY, exclusively presented in the members’ area of our website. As our members know USDJPY has recently made pull back that made clear 3 waves down from the April 29th peak . The pair completed correction right at the Equal Legs zone ( Blue Box Area) . In further text we’re going to explain the Elliott Wave pattern and trading setup.
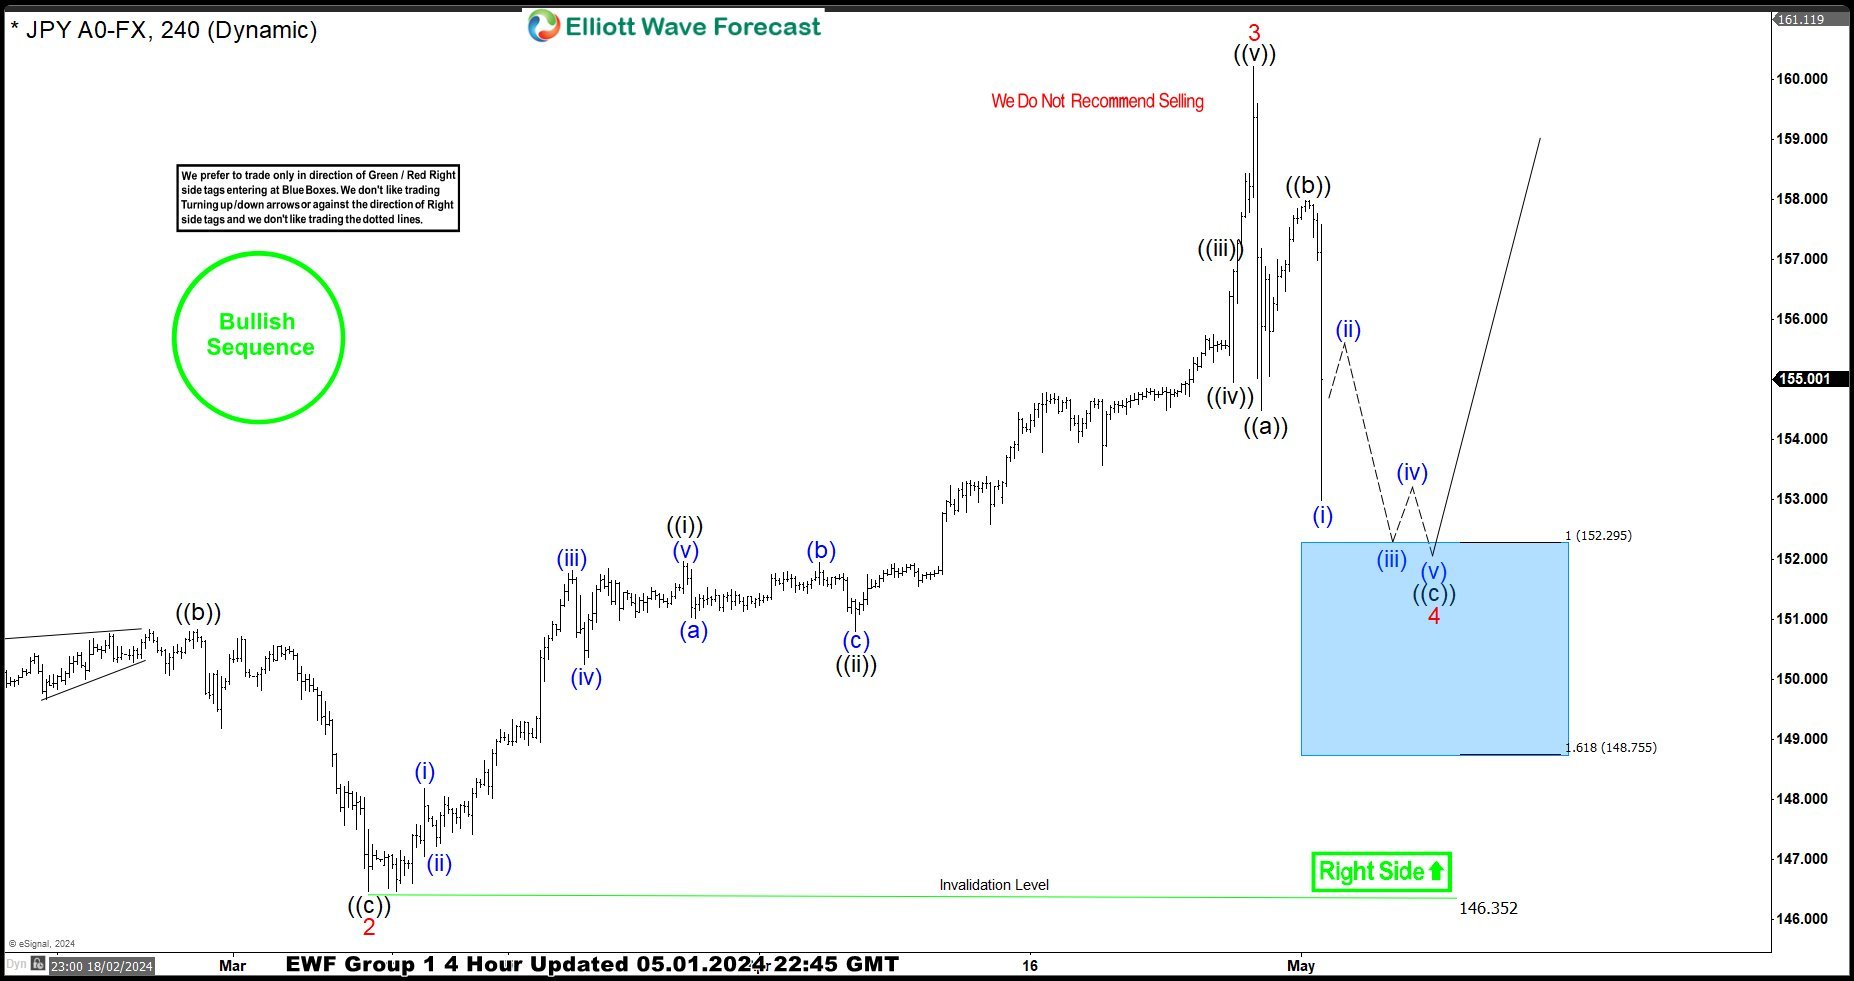
USDJPY Elliott Wave 4 Hour Chart 05.01.2024
The pair is correcting cycle from the 146.352 low. The pull back is showing lower low sequences from April 29th peak. Current view suggests that the correction is still incomplete at the moment. Our analysis forecasts further downside in USDJPY toward the 152.295-148.75 area ( blue box).
Despite the expected extension lower, we advise against selling USDJPY. Once the pair reaches this blue box area, we expect it to attract buyers. We can see either rally towards new highs or a corrective bounce in three waves at least. Once the bounce reaches the 50% Fibonacci retracement level against the connector high -((b)) black, we’ll secure our position by moving the stop-loss to breakeven. To safeguard our trade, we’ll closely monitor for any break below the marked invalidation level :148.75
A quick reminder:
Our charts are designed for simplicity and ease of trading:
- Red bearish stamp + blue box = Selling Setup
- Green bullish stamp + blue box = Buying Setup
- Charts with Black stamps are deemed non-tradable. 🚫
For those eager to deepen their understanding of Elliott Wave Patterns, we invite you to explore our Free Elliott Wave Educational Web Page.
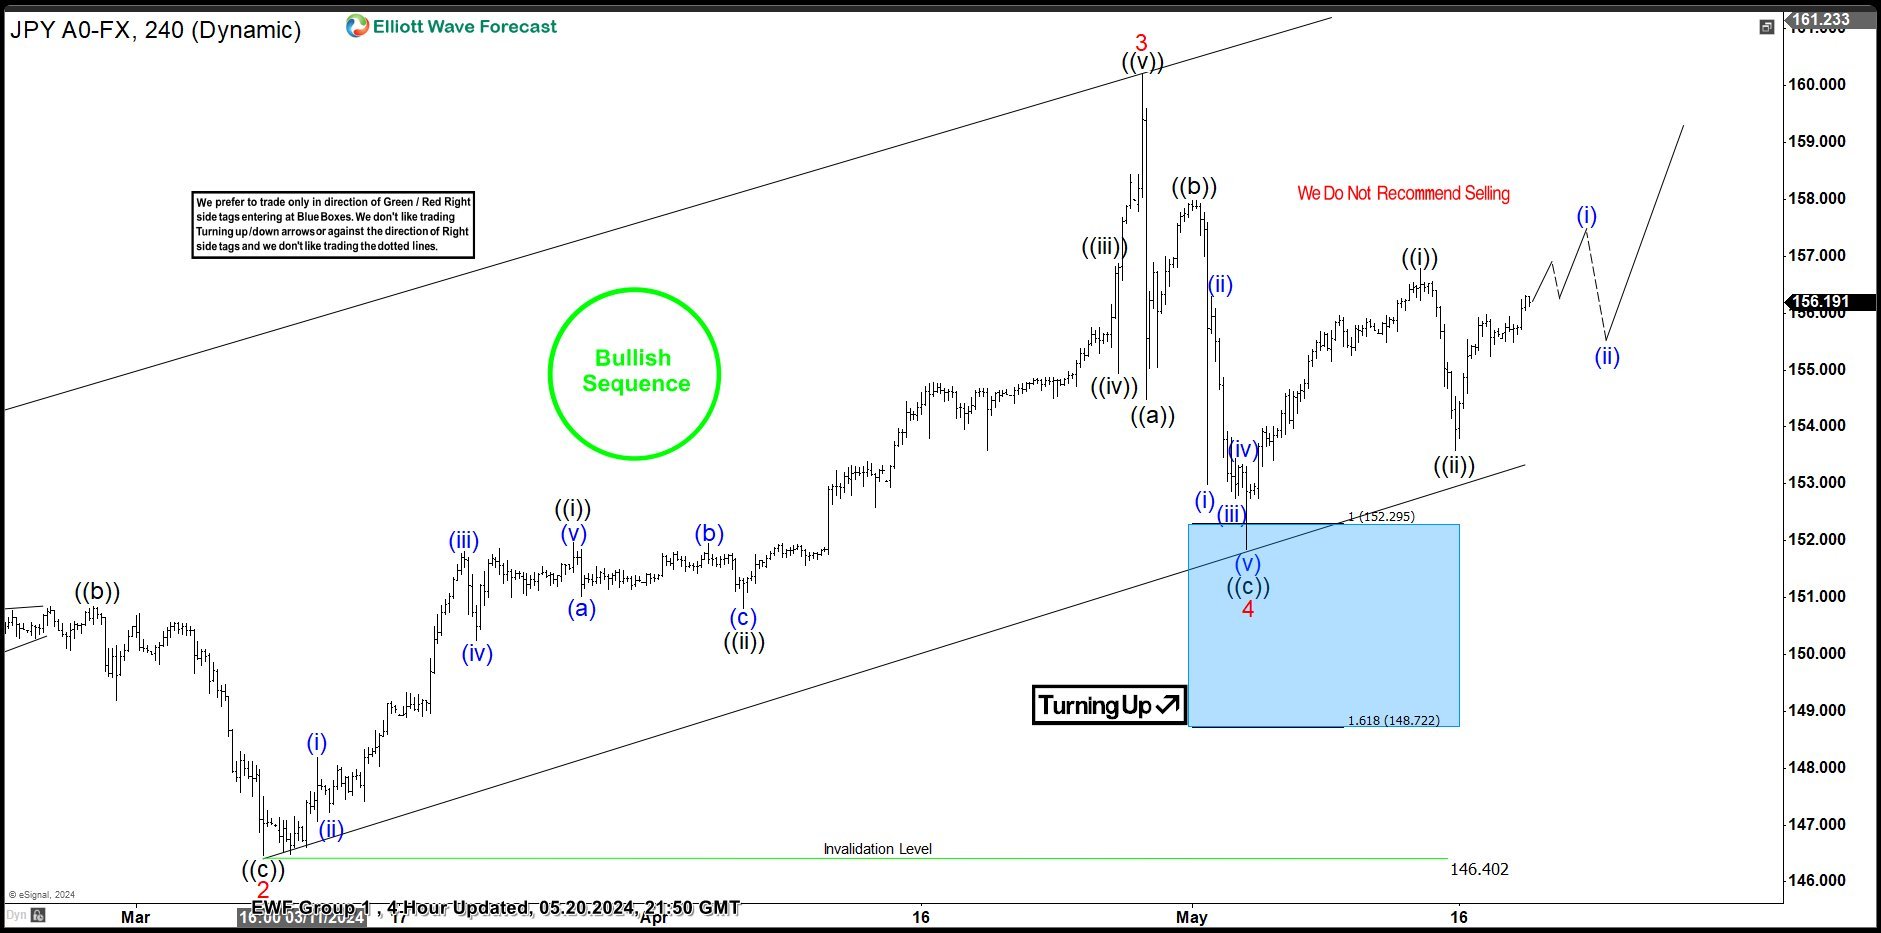
USDJPY Elliott Wave 4 Hour Chart 05.20.2024
The pair found buyers within the Blue Box area as expected. We got a nice rally from our buying zone, counting wave 4 correction completed at the 151.89 low. As a result, traders who entered long positions are now enjoying risk-free profits. The bounce has exceeded the 50% Fibonacci retracement level against the connector peak. With the price holding above the 151.89 low, we believe the next leg up can be in progress. For confirmation on the next leg up, we’re looking for a break above the 3 red peak.
Please bear in mind that the market is constantly evolving. The outlook presented here may have shifted since. For the latest updates, refer to the most recent charts available in our membership area. We focus on trading instruments with incomplete bullish or bearish swing sequences. The Live Trading Room highlights the best opportunities in real-time.