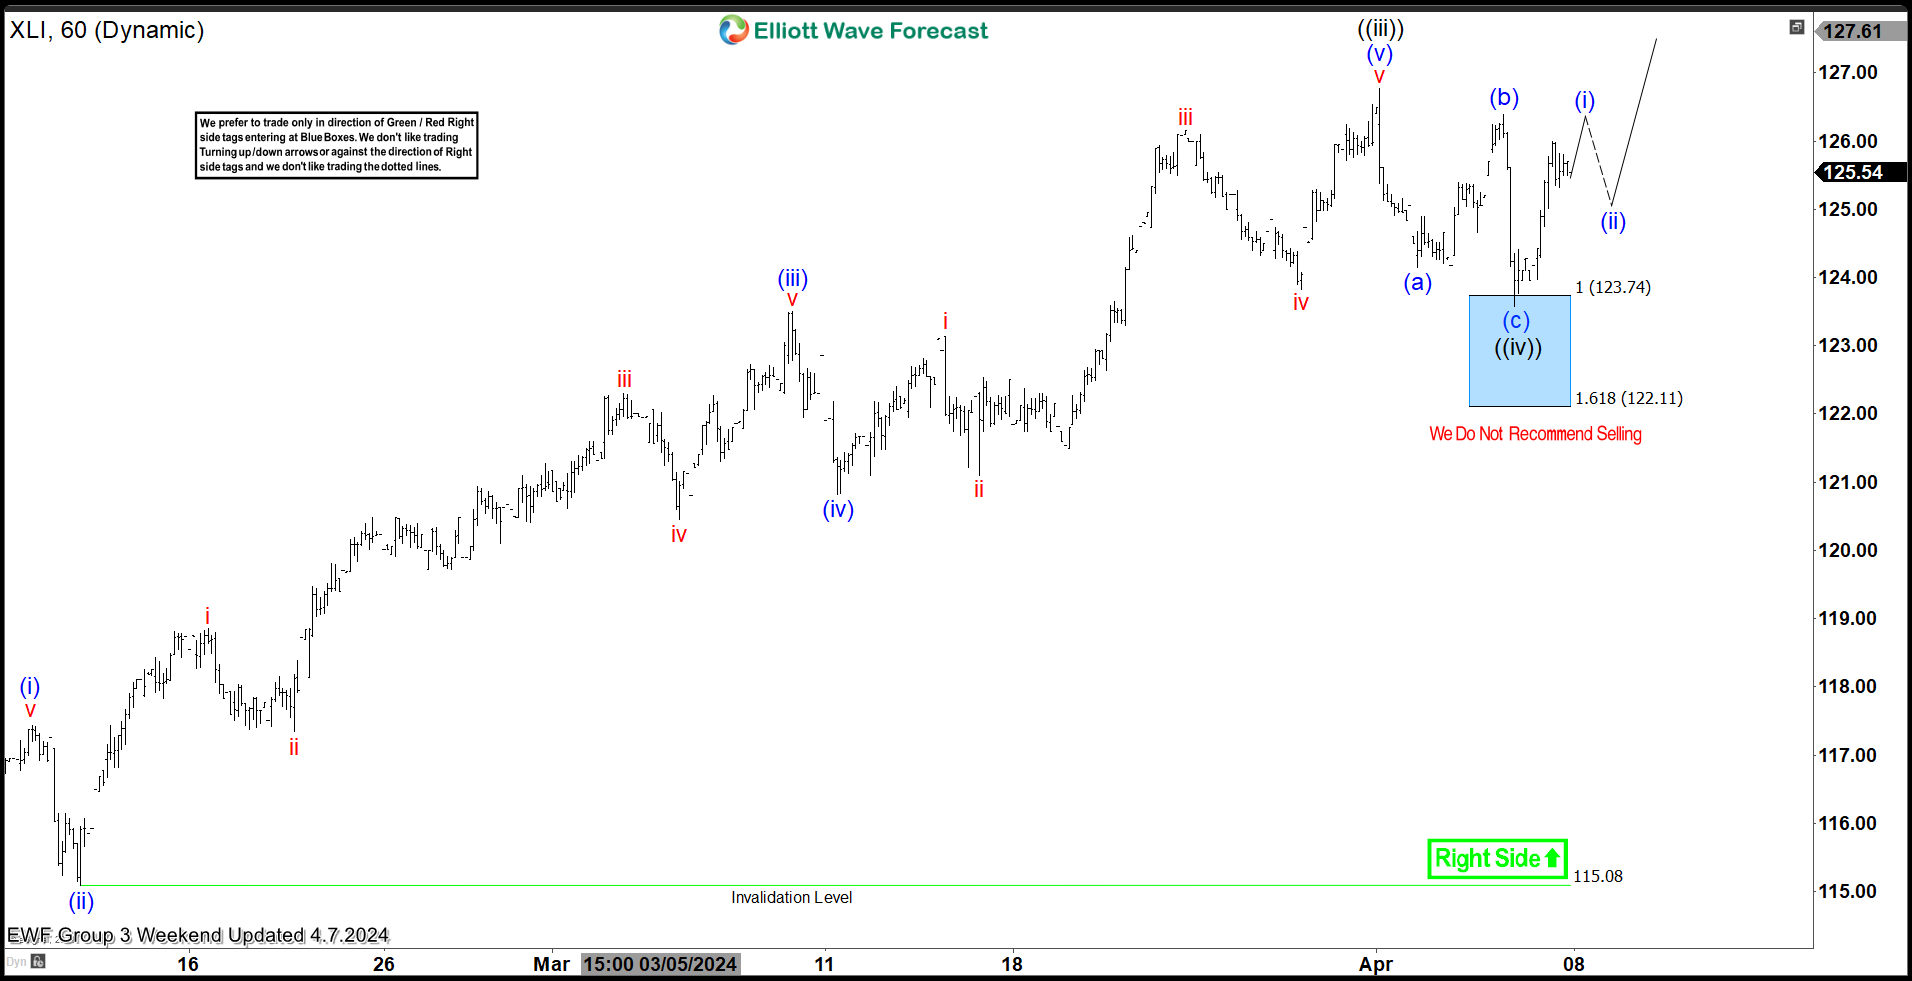
Hello fellow traders. In this technical blog we’re going to take a quick look at the Elliott Wave charts of XLI ETF, published in members area of the website. As our members know XLI is showing impulsive bullish structure in the cycle from the 109.9 and we have been favoring the long side of the ETF. Recently, we experienced a pullback consisting of three clear waves, which found buyers right at our buying zone (blue box). In the following text, we’ll delve into the Elliott Wave forecast and trading setup.
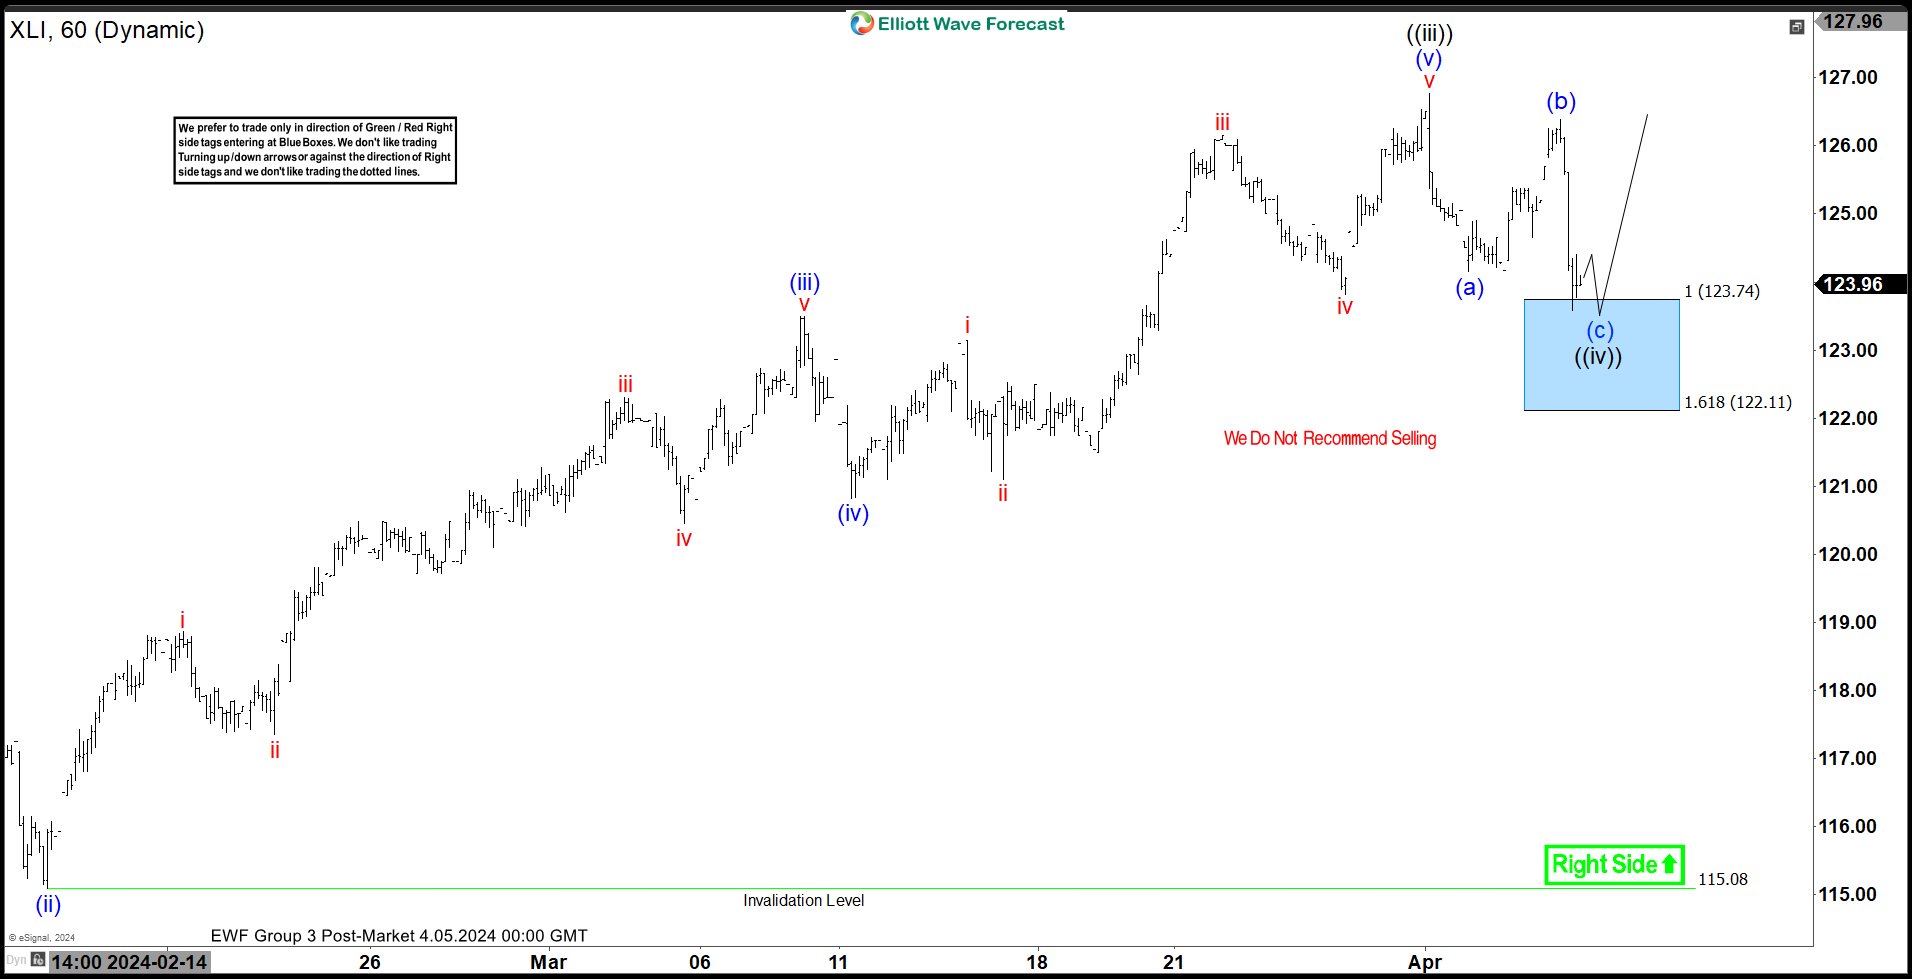
XLI H1 Post-Market Update 04.05.2024
The current view suggests that XLI is undergoing a wave ((iv)) correction. The pullback has reached an extreme zone within the 123.74-122.11 area, also known as the Blue Box. We acknowledge that the pullback could conclude at any moment. Therefore, we are initiating long positions within the Blue Box. Given the prevailing bullish trend, we anticipate at least a three-wave bounce from this area. Once the price touches the 50% Fibonacci retracement level against the (b) blue connector, we will secure positions, setting the stop loss at breakeven and booking partial profits. However, it’s important to note that breaking below the 1.618 Fibonacci extension level at 122.11 would invalidate the trade. We advise against selling the ETF and anticipate a further rally to resume from the buyer’s zone at 123.74-122.11.
Official trading strategy on How to trade 3, 7, or 11 swing and equal leg is explained in details in Educational Video, available for members viewing inside the membership area.
Quick reminder on how to trade our charts :
Red bearish stamp+ blue box = Selling Setup
Green bullish stamp+ blue box = Buying Setup
Charts with Black stamps are not tradable. 🚫
XLI H1 Weekend Update 04.07.2024
XLI has given us a nice reaction from the buying zone as expected. The bounce reached and exceeded 50% Fibonacci retracement against the (b) blue high, so we consider wave ((iv)) black completed at the 123.61 low. Consequently, long positions should now be risk-free, and partial profits should be saved. We anticipate a break of the ((iii)) black peak to confirm that the next leg up is in progress. Alternatively, if the price breaks below the 123.61 low, the ETF will open up the possibility for a 7-swing pattern. In that case, long positions will be stopped out, and we will look to buy the dips again at the next set of equal legs.
Keep in mind that market is dynamic and presented view could have changed in the mean time. You can check most recent charts with target levels in the membership area of the site. Best instruments to trade are those having incomplete bullish or bearish swings sequences. We put them in Sequence Report and best among them are shown in the Live Trading Room