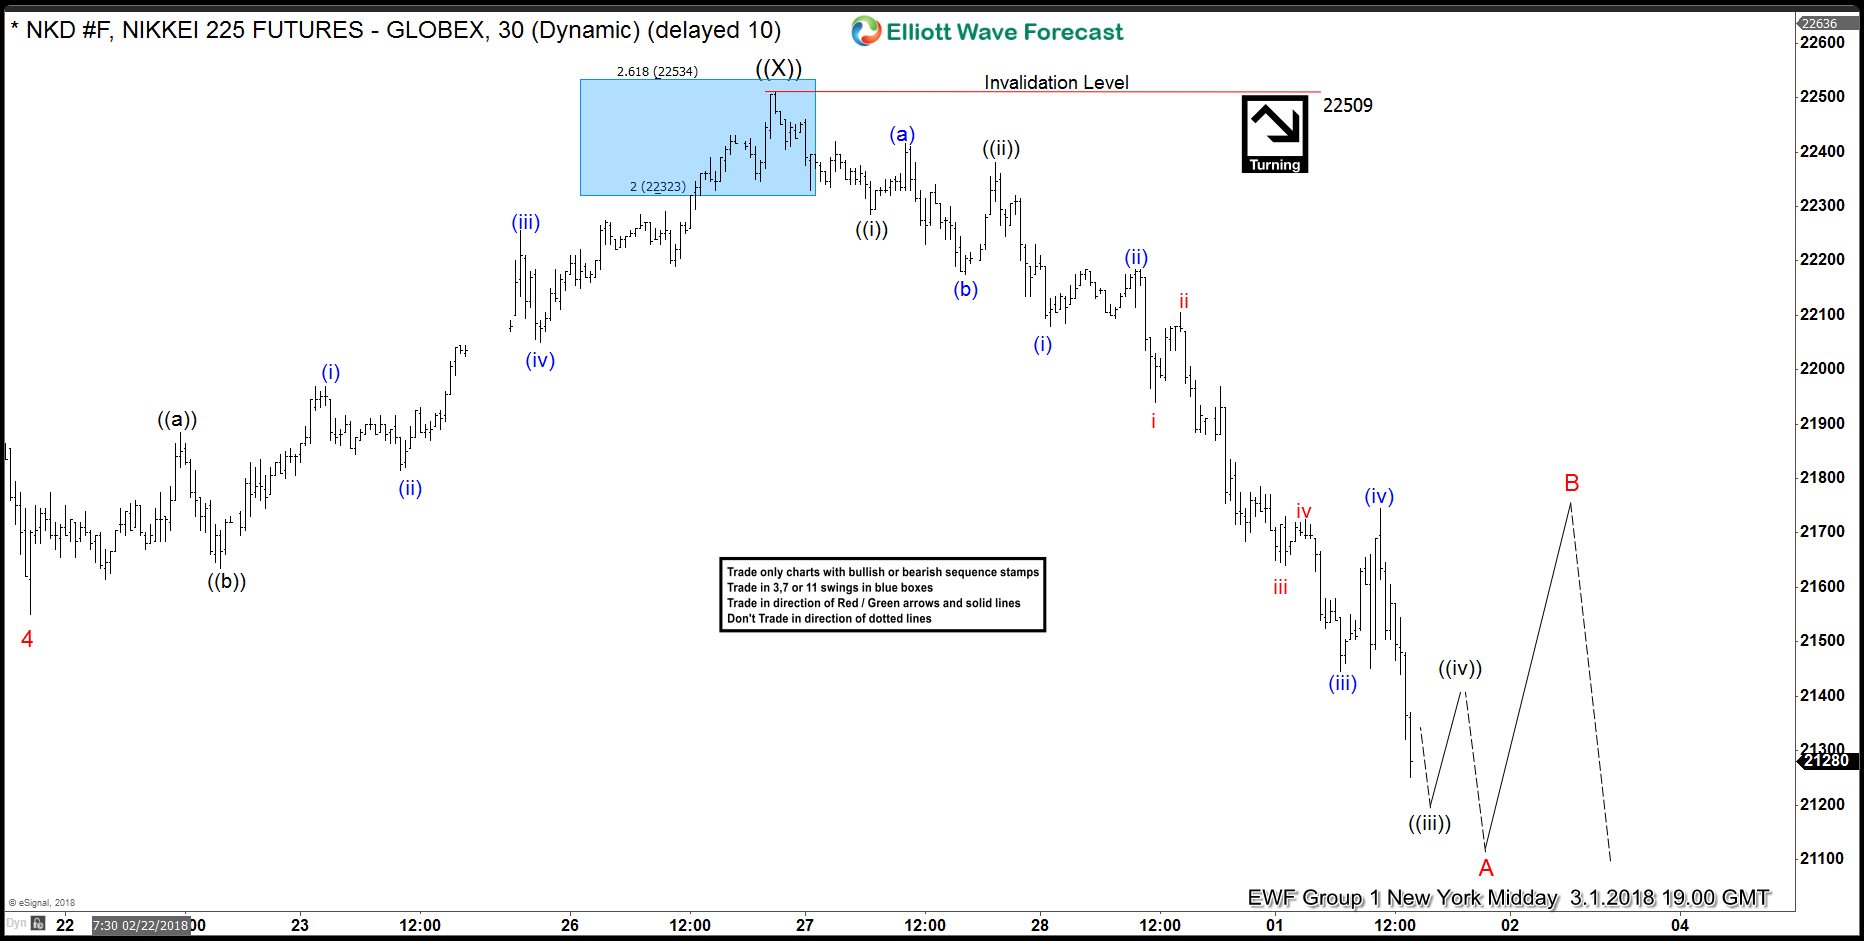
Nikkei Futures (NKD_F) has dropped nearly 1500 points this week so we decided to do a video to show structure of the decline. As the chart in the video shows, the decline is unfolding as an impulse in which we have an extended wave ((iii)) and wave (iii) is also extended which makes it look like a perfect impulse. Start from 22515 peak, wave ((i)) lower ended at 22285, wave ((ii)) ended at 22380, this was followed by wave (i) of ((iii)) lower completing at 22080, wave (ii) of ((iii)) ended at 22185, wave (iii) of ((iii)) completed at 21445, wave (iv) of ((iii)) completed at 21745 and decline to 21035 completed black wave ((iii)). We are currently in a wave ((iv)) bounce which should unfold in 3-7-11 swings and as far as the pivot at wave ((ii)) high remains intact, we should expect to see another low to complete an Elliott wave impulse structure down from 22515 peak.
According to Elliott wave theory, at the end of 5 waves, we should see a 3 waves reaction in the opposite direction which in this case should be to the upside, so once 5 waves down i.e wave A is complete, we should expect a bounce in wave B which should again unfold in a corrective manner in the sequence of 3-7-11 swings followed by C wave lower. Wave C could be an impulse or could be an Ending Diagonal. If 5 waves decline is part of a FLAT from 2/21 (22196) peak, Nikkei can rally to new highs after completing 5 waves decline but we would consider that possibility only if the pivot at 22515 high gives up during the bounce in our distribution system, until then we would favor the bounce in wave B to fail in 3-7-11 swings for an extension lower in wave C.
Nikkei Elliott Wave Analysis Video
Nikkei 1 Hour Elliott Wave Analysis: 3.1.2018
Back

