The USDJPY pair has exhibited a bearish sequence since its high on July 3, 2024, signaling potential for further downside. In the near term, the cycle from the May 13, 2025, high is unfolding as a double three Elliott Wave structure, a complex corrective pattern. From the May 13, 2025, peak, the initial decline, labeled wave ((a)), concluded at 144.91. It is then followed by a corrective bounce in wave ((b)) to 146.1. The subsequent drop, wave ((c)), completed at 142.10, finalizing the larger wave W, as illustrated on the 1-hour chart below.
Following this, the pair entered a corrective phase, wave X, structured as a zigzag. From the wave W low, wave ((a)) advanced to 144.46 and wave ((b)) pulled back to 143.84. Wave ((c)) rallied to 146.28, completing wave X in the higher degree. This zigzag correction temporarily halted the bearish momentum. The pair has now turned lower, initiating wave Y, which is also unfolding as a zigzag structure with sub-waves ((a))-((b))-((c)).
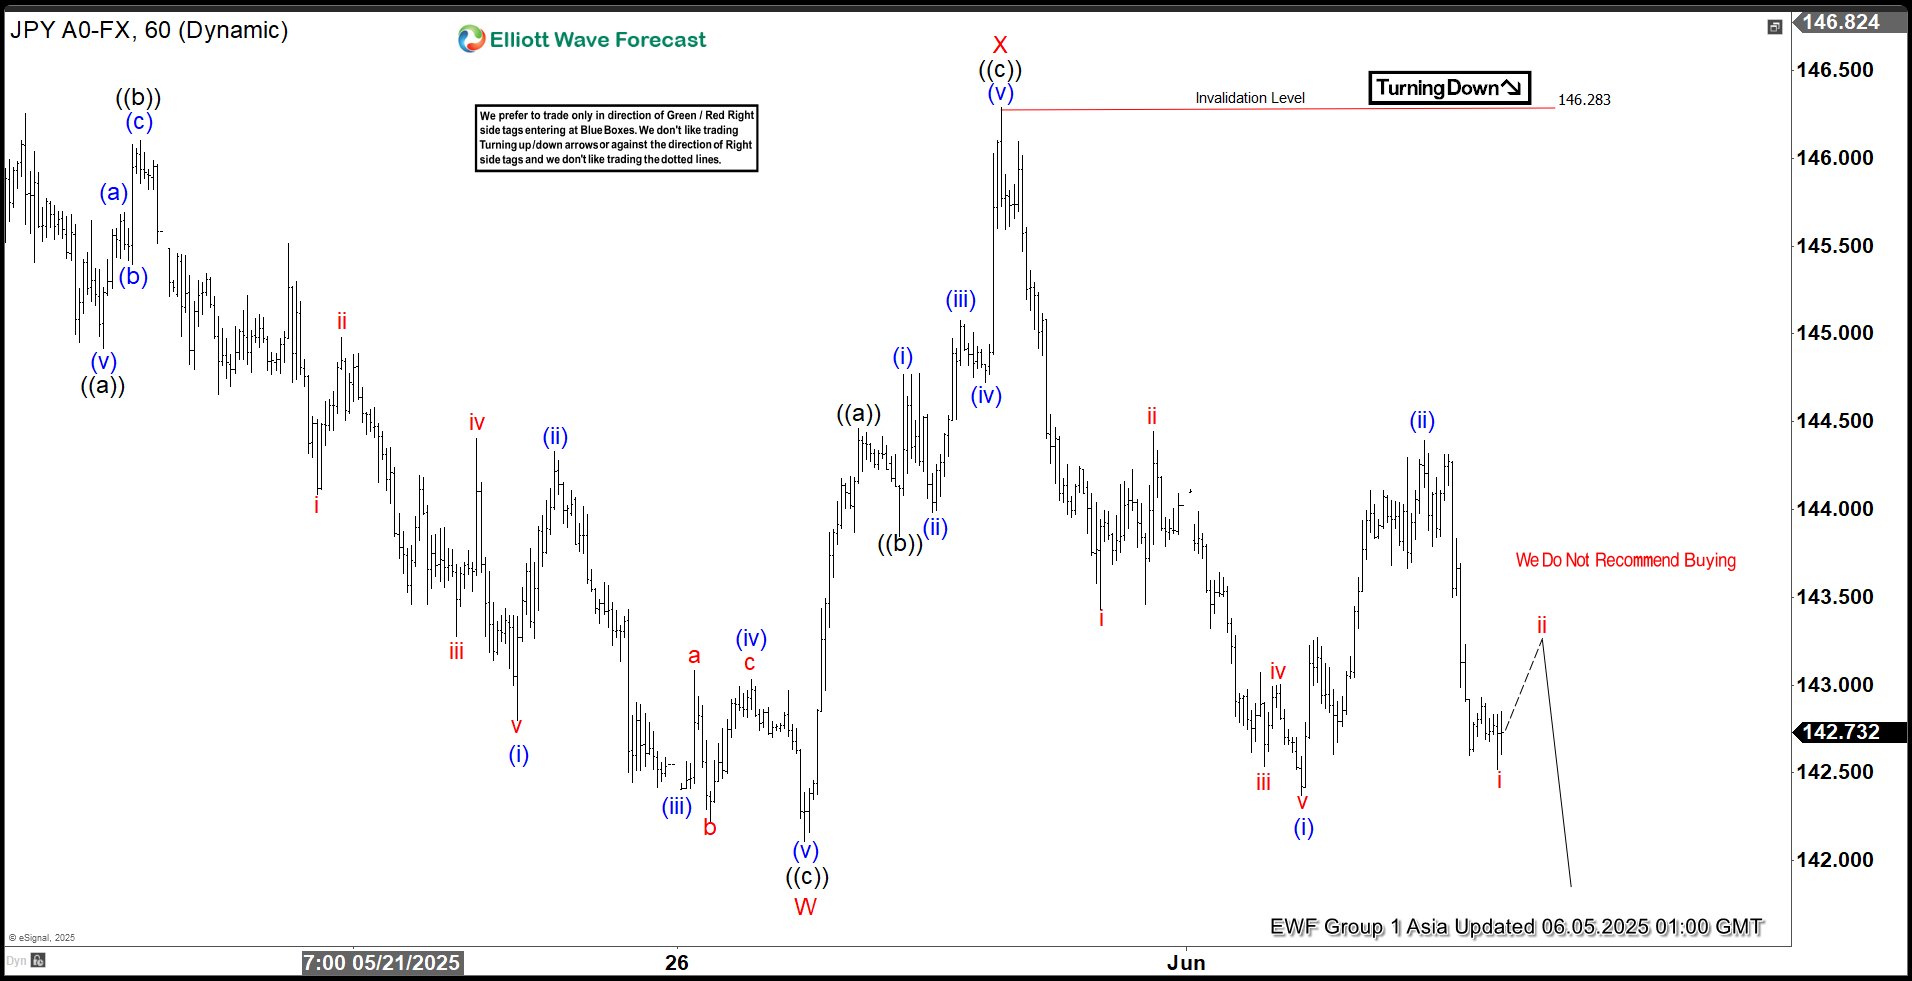
From the wave X high, wave (i) of ((a)) declined to 142.37, and the corrective wave (ii) of ((b)) reached 144.39. The pair is expected to continue lower in wave (iii) of ((a)). As long as the pivot high at 146.28 remains intact, any rally is likely to fail in a 3, 7, or 11 swing pattern, setting the stage for further declines. A break below the wave (i) low at 142.37 and the wave W low at 142.10 would reinforce the bearish sequence from the May 29 and May 13 peaks, respectively. Such a move would further confirm and validate the bearish outlook, strengthening the case for continued downside in the USDJPY pair.
USDJPY 60-Minute Elliott Wave Technical Chart