
Hello fellow traders,

As our members know we have had many profitable trading setups in Indies recently.   In this technical article, we are going to present another Elliott Wave trading setup we got in SPX E-Mini (ES_F) . The futures has extended pull back, giving us another buying opportunity., ES_F completed this correction precisely at the Equal Legs zone, referred to as the Blue Box Area. In the following sections, we will delve into the specifics of the Elliott Wave pattern observed and discuss the corresponding trading setup in detail.

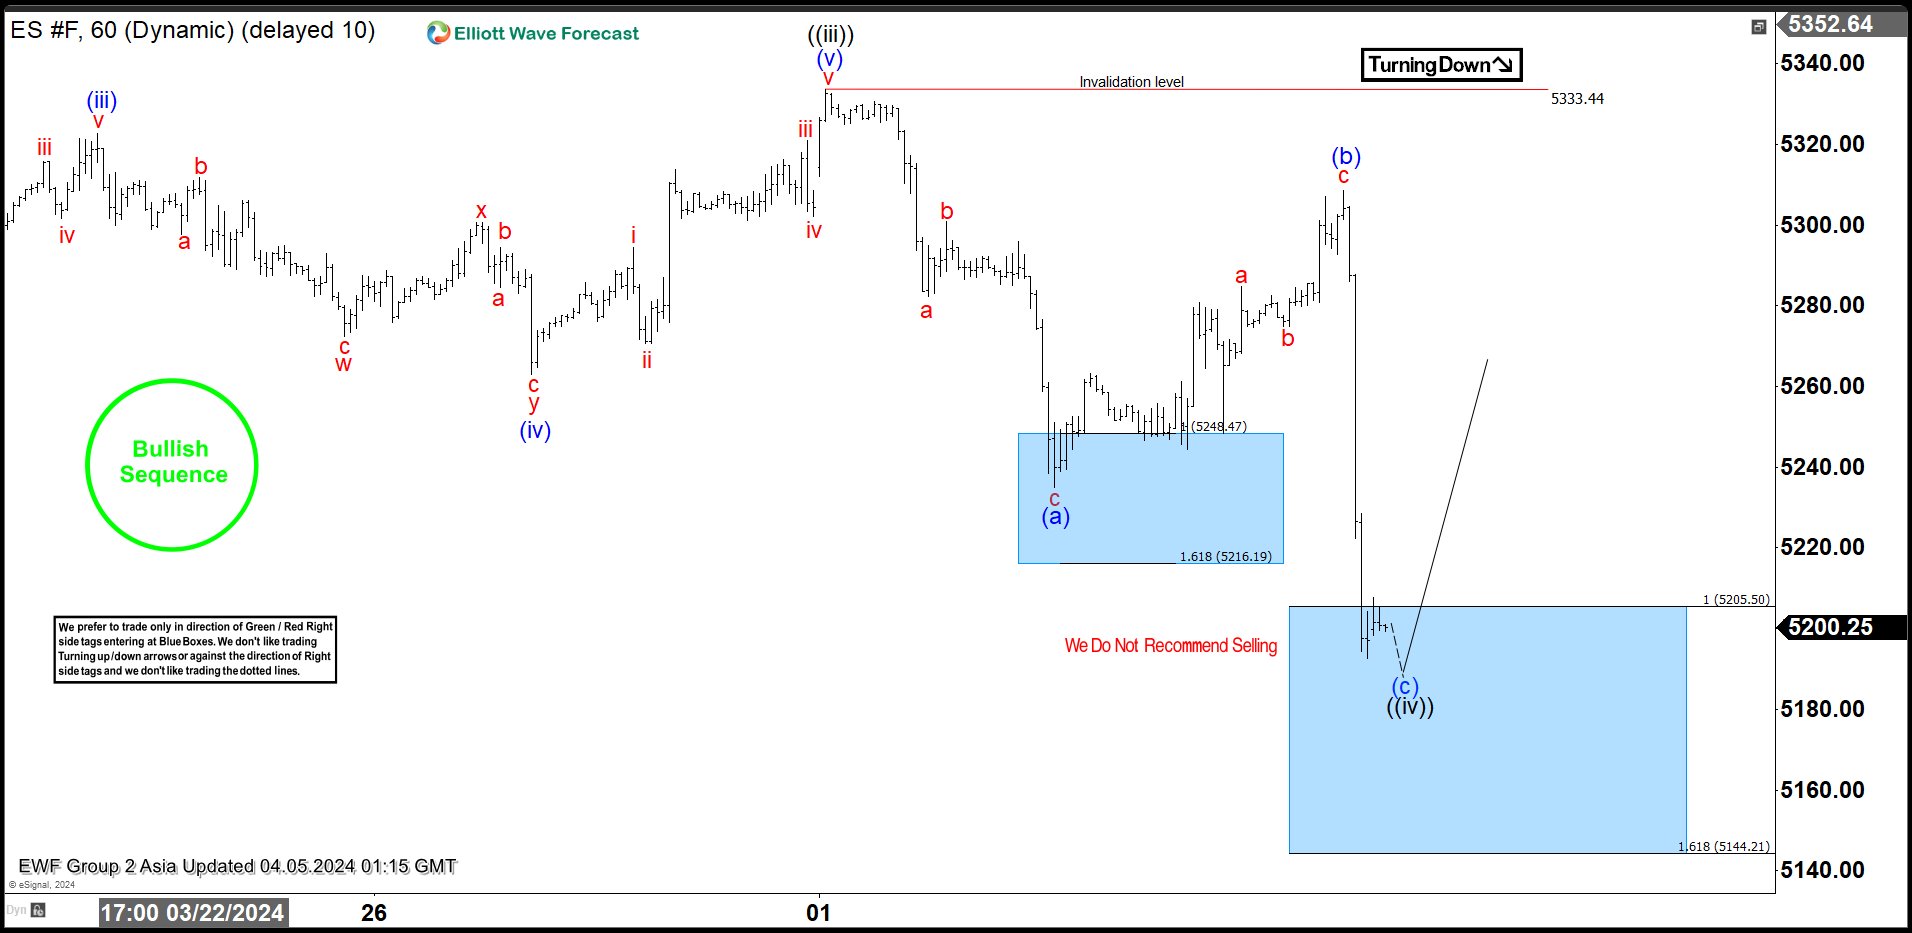
ES_F Elliott Wave 1  Hour  Asia Chart 04.05.2024

Current view suggests ES_F are undergoing ((iv)) black correction. The price has reached a new extreme zone at 5205.5-5144.21, where we would like to be buyers again.

We’re entering long positions within the Blue Box. As the main trend remains bullish, we anticipate at least a 3-wave bounce from this area. Once the price touches the 50 fibs against the (b) blue connector, we’ll make positions risk-free and set the stop loss at breakeven and book partial profits. Breaking below the 1.618 Fibonacci extension level at 5144.21 would invalidate the trade.

Official trading strategy on How to trade 3, 7, or 11 swing and equal leg is explained in details in Educational Video, available for members viewing inside the membership area.

Quick reminder on how to trade our charts :

Red bearish stamp+ blue box = Selling Setup
Green bullish stamp+ blue box = Buying Setup
Charts with Black stamps are not tradable. 🚫
ES_F

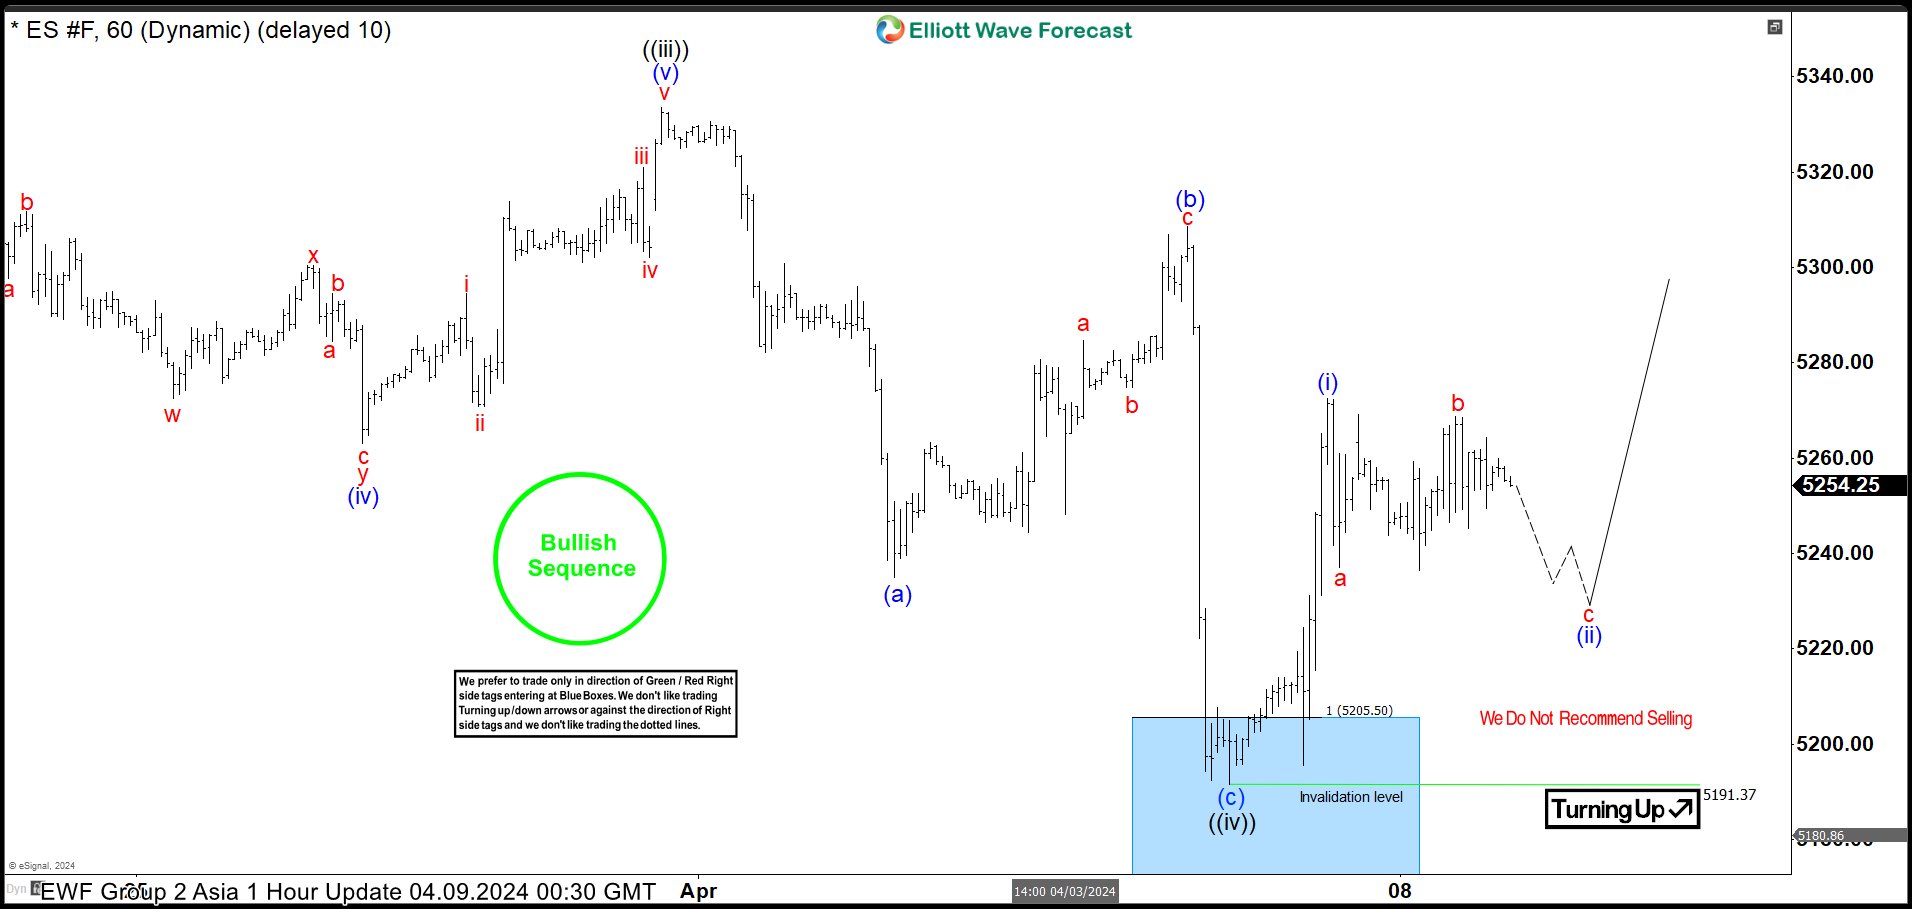
ES_F Elliott Wave 1  Hour  Asia Chart 04.09.2024

The future has found buyers as expected and is showing a decent bounce from the Buying Zone. We count the pullback ((iv)) black as completed at the 5191.37 low. Consequently, long positions should now be risk-free. We’ve set our stop loss at breakeven and have already secured partial profits. Now, we would like to see a break of the ((iii)) black peak to confirm that the next leg up is in progress. Alternatively, if the price breaks below 5191.37 low, the futures will open up the possibility for a deeper pullback. In that case, long positions will be stopped out, and we will look to buy the dips again at the next set of equal legs.

Keep in mind that market is dynamic and presented view could have changed in the mean time.  You can check most recent charts with target levels in the membership area of the site. Best instruments to trade are those having incomplete bullish or bearish swings sequences. We put them in Sequence Report and best among them are shown in the Live Trading Room

 

ES_F

You can learn more about Elliott Wave Patterns at our Free Elliott Wave Educational Web Page

Over the years, we’ve developed a proven trading strategy that combines this approach. It helps to define precise Entry, Stop Loss, and Take Profit levels, allowing you to enter trades with confidence. Even better, this strategy helps make your positions risk-free shortly after entering, providing added protection for your trading account.

Elliott Wave Forecast Membership

Trade with a clear plan — not guesswork.

At Elliott Wave Forecast, our team of professional analysts monitors 78 instruments across global markets every day, helping members identify high-probability opportunities and manage risk through a structured, rules-based trading process.

Inside your membership, you’ll receive:

Real-Time Trading Recommendations — with clearly defined Entry, Stop Loss, and Take Profit levels for each setup.
Live Trading Room Access — follow professional trade setups as they develop in real time.
24-Hour Chat Room Support — ask unlimited questions and receive guidance from experienced analysts throughout the trading week.
Expert Multi-Market Analysis — covering Forex, Stocks, Indices, ETFs, Commodities, and Cryptocurrencies.
Exclusive Educational Videos — included at no additional cost, with practical lessons on Elliott Wave theory, trading strategies, risk management, and trade execution.
Learn the Process Behind Every Setup — understand how experienced analysts identify opportunities, define risk, and manage trades as market conditions evolve.

Ready to see how the process works in real market conditions?

Regular 14-Day Trial: $9.99
Limited-Time Price: Only $0.99

👉 Start Your 14-Day Trial for Only $0.99
