IBEX 35 is the benchmark Stock Market Index of the Bolsa de Madrid, Spain’s principal stock exchange. Initiated in 1992, the index is administered and calculated by Sociedad de Bolsas, a subsidiary of Bolsas y Mercado Espanoles (BME). BME is the company which runs Spain’s securities markets (including the Bolsa de Madrid). It is a market […]
IBEX-35 from Spain Showing Incomplete Bearish Sequence
Spain is one of the hardest hit European countries by Covid-19 pandemic. Unsurprisingly, Spain main index IBEX-35 plunged just like the rest of the world’s indices. The biggest impact happened during the first few days of March. As of April 29, 2020, Madrid is the most affected city by Covid-19 with 60,000 people infected. Impact […]
IBEX Elliott Wave: Right Side Favored More Downside
In this blog, we take a look at the past performance of 1 hour Elliott Wave charts of IBEX In which our members took advantage of the blue box areas.
Elliott Wave View: IBEX Ended Impulsive Rally
Short term Elliott Wave view on IBEX calls the rally from August 15, 2019 low (8405.39) as a 5 waves impulse Elliott Wave structure. Up from 8405.3, wave ((i)) ended at 8806.4 and wave ((ii)) pullback ended at 8592.70. Index then resumed higher in wave ((iii)) towards 9123.9, wave ((iv)) pullback ended at 8964, and […]
Elliott Wave View: IBEX Shows Bullish Structure
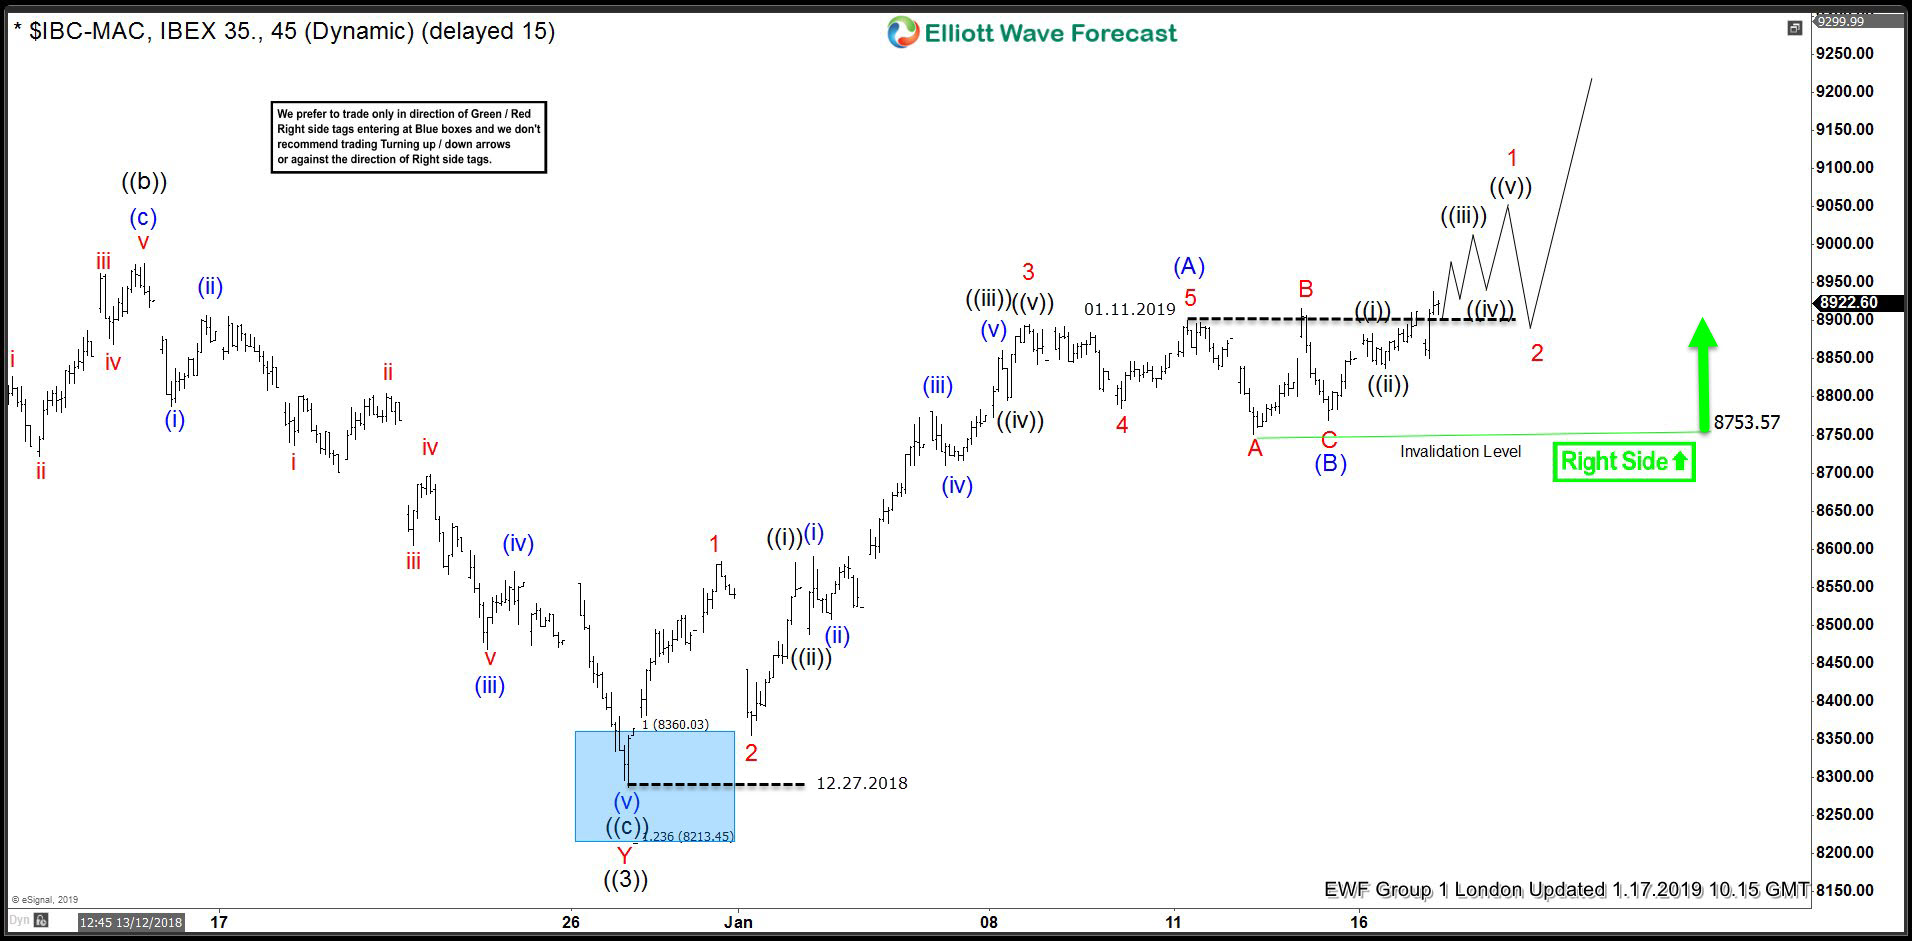
IBEX shows a bullish structure from 12.28.2018 low favoring more upside. This article & video describes the short term Elliott Wave path for the Index.
$IBEX Short Term Bullish Sequence Calling The Rally
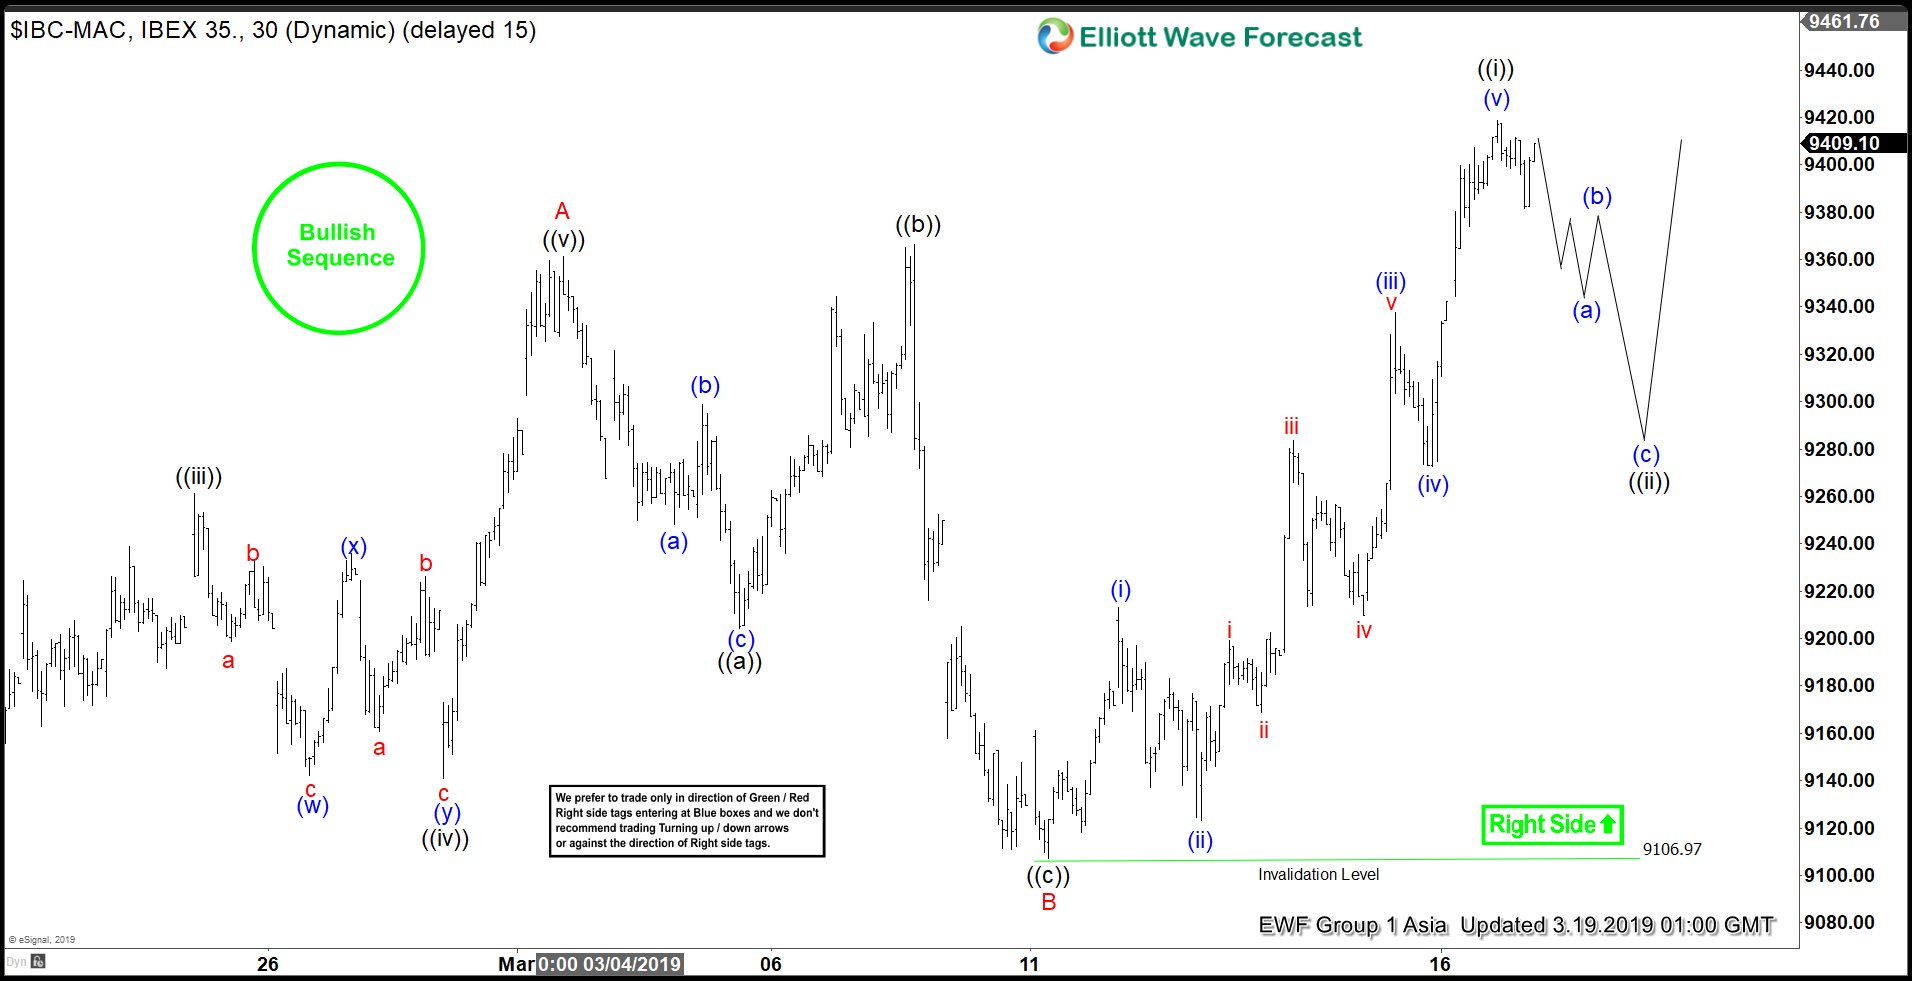
Hello fellow traders. In this technical blog we’re going to take a quick look at the Elliott Wave charts of IBEX, published in members area of the website. As our members know, IBEX has made recently incomplete bullish sequence in the cycle from the December 27th 2018 low. The Elliott wave structure had been calling […]

