Many traders and Presidents believe that the Market is a reaction of the agendas and even their own trades. The Reality is that the Market follows cycles, sequences and trades within extensions in both Time and Price. Therefore, we will have a look at the SPX500 monthly chart and some other relevant world indices.
We believe there are Traders and Market makers which most of the time hide the market moves behind the news event. We have seen for years that news events with the same outcome creating two different reactions in the Market. Which makes the case for the theory that the outcome of the event does not matter for the Market. But it is been used by the Market Makers. In 2020, the US will have a General Election and having a look at the Weekly cycles in many World Indices, we can be seeing that an event like the general election can be used by the Market Makers to create the biggest Pullback since 2009.
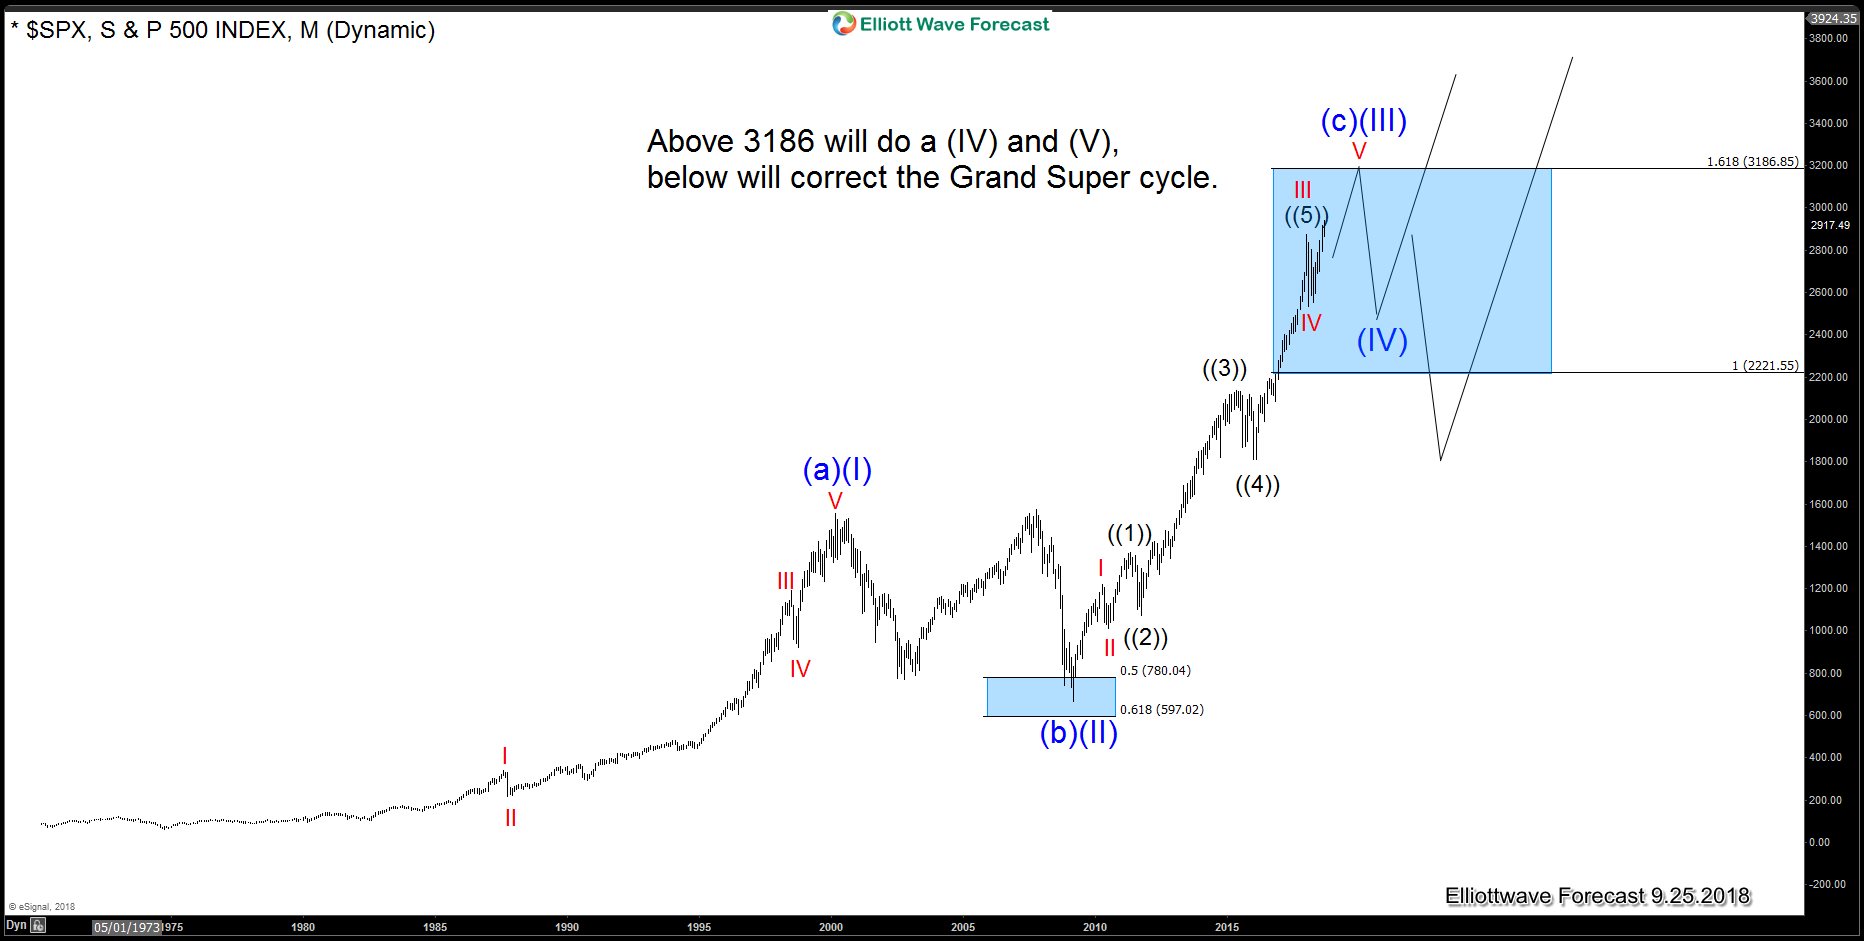
The SPX500 is trading close to the 1.618 extensions which its own Grand Supercycle comes at 3196. This level is key for the outcome of the next 10 years of trading. Because above the Grand Supercycle, it will extend and the magnitude of the coming correction will be as big as the one that took placed between 2000 and 2009. Either way. The Current Political situation in the US makes the Election a magnet for hidden the real intention and we do understand that the Market Makers can be waiting until those days to drop the Market hard. Please have a look at the SPX500 monthly chart below.
SPX500 09.25.2018 Monthly Chart Elliott Wave Analysis
It shows the $SPX 500 Index monthly chart in which we show the 2 possible paths and how the correction to the election can be in both cases. The principal path is the one showing that the Index passing the 3196 area by 2020. Consequently, the pullback will be relative big in time, but shallow in price. And therefore only will correct the 2009 cycle which is a Supercycle degree correction. The second path is the Index staying below the 3196 level, which can create a correction bigger than the one from 2000-2009. Which will correct the whole Grand Supercycle. We covered many World Indices in www.Elliottwave-forecast.com and we see how the time and price will be creating an alignment around 2020. Due to that fact that we believe in the One market the only concept. The FTSE-100 Index from Great-Britain can give us the clue.
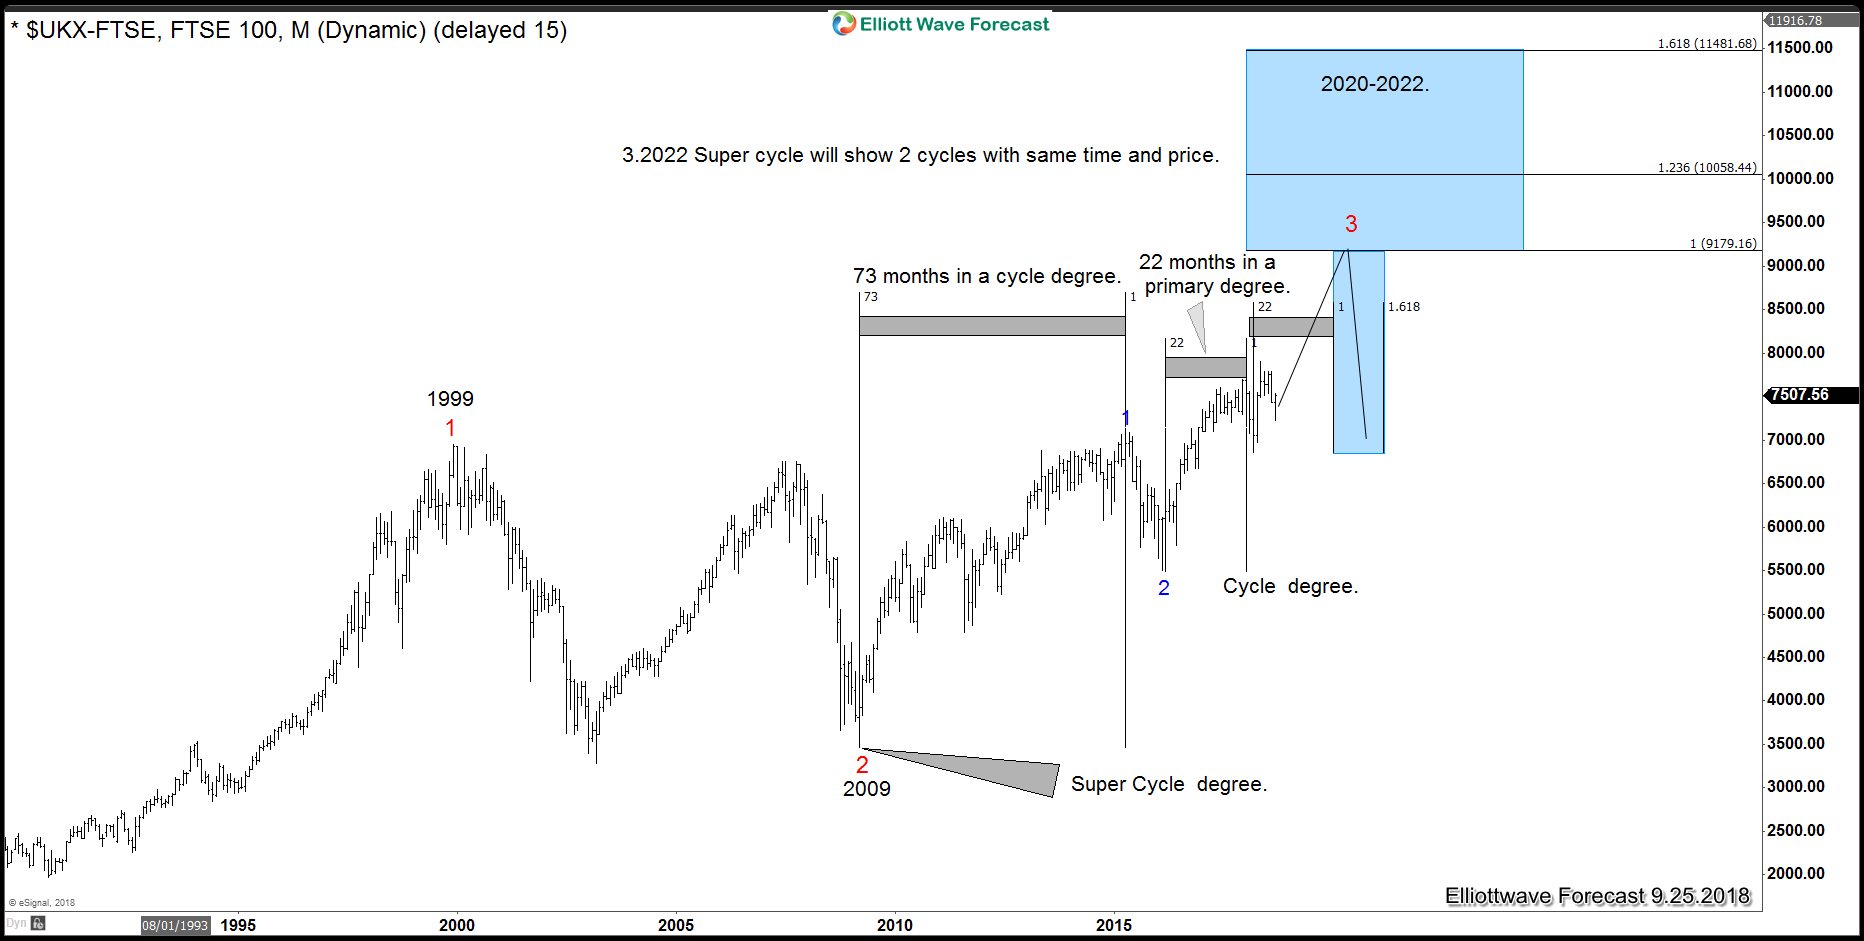
FTSE-100 09.25.2018 Monthly Chart Swing Sequences
The $UKX-FTSE is indicating the target of around 9179 within the Grand Supercycle. As shown in the chart, the red numbers are the Supercycle degrees. And red 3 should reach the Blue Box. The blue 1 is the first leg within the Supercycle degree and it took around 73 months to develop. Adding 73 months to the low in Blue 2. We will get the time by around 2022. The lesser degree which is Primary, started in Blue 2 and took 22 months and adding that to the low to this year. Will place the 100% extension in time by 2020, which will be a perfect match in time and price around 2020. Have a look at the Nikkei monthly chart below.
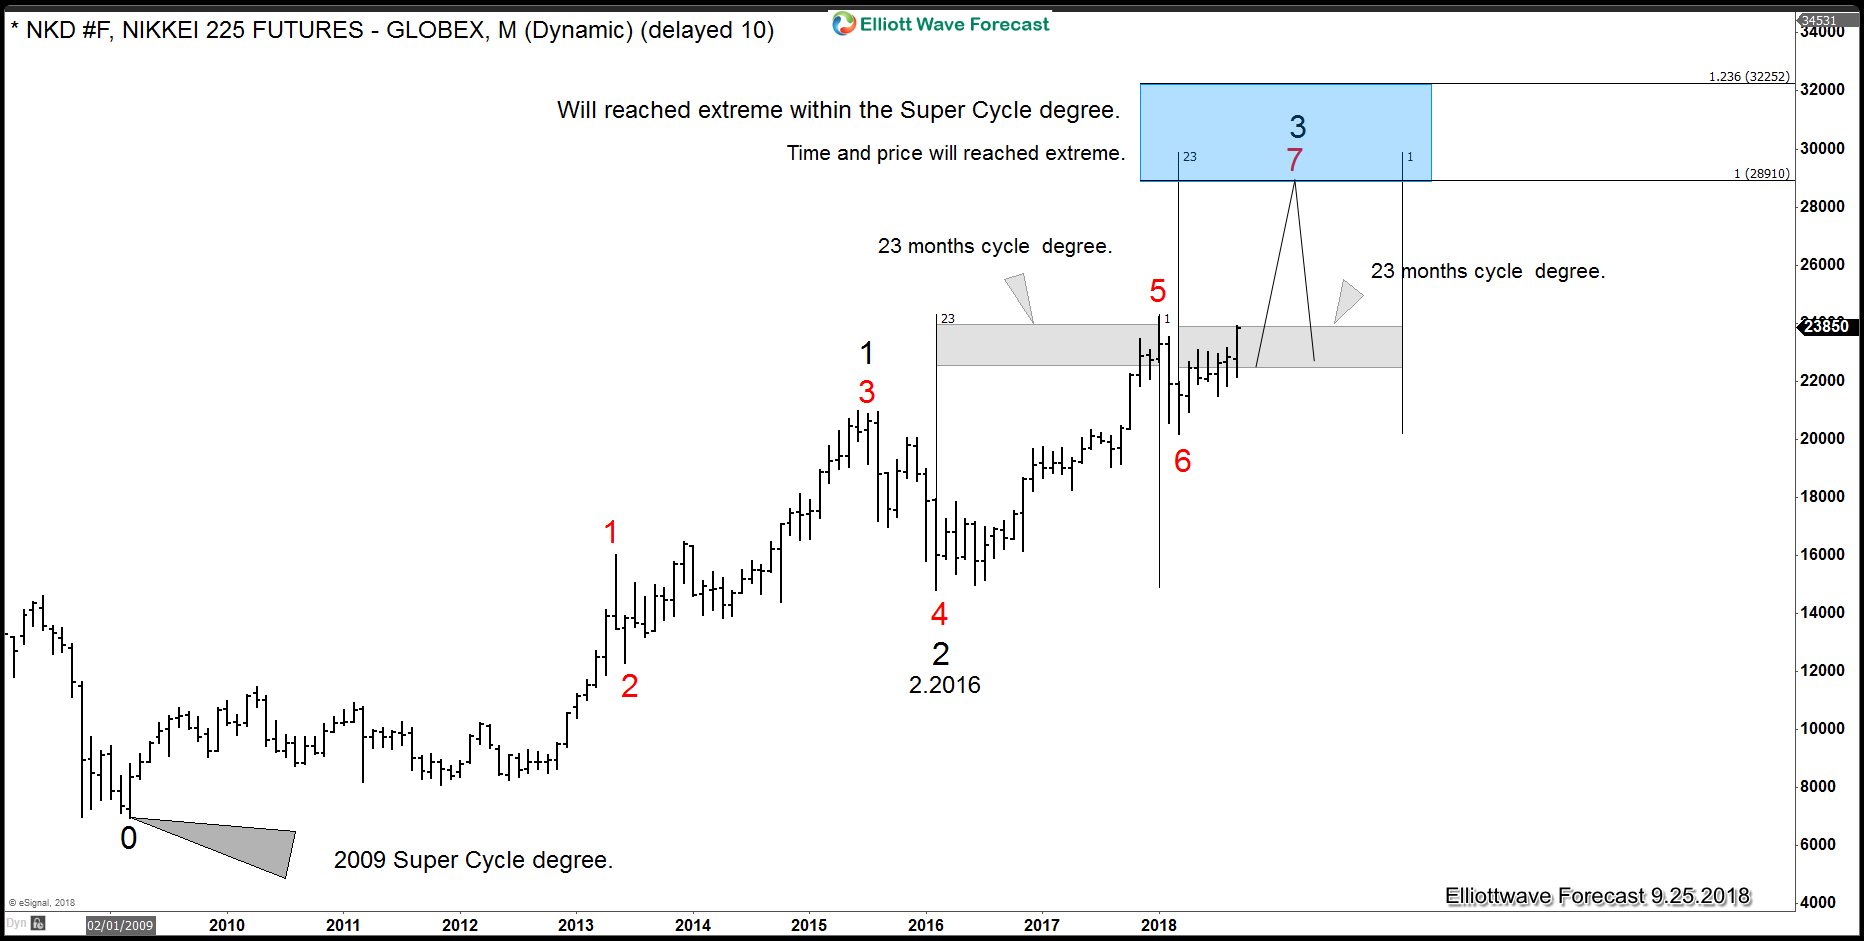
Nikkei 09.25.2018 Monthly Chart Swing Sequences
The Nikkei 225 is showing the same cycles and structures as $UKX-FTSE, consequently, both are showing the same ideas. The Nikkei is showing a Supercycle extreme at 28910-32252 which should be reached also by around 2020-2022. If we look at the chart, the swing 5 took 23 months and adding those 23 months to the beginning of swing 7. It will place the 100% extension at around 2020 which will represent an extreme in time and price. It can be seen, that the Market makers are having a close eye towards the US Election in the near future. To justify the upcoming correction. It doesn’t matter if President Trump remains for another 4 years or a new president will be elected. The Market will correct and the degree will be determined by the SPX500 and others instruments like $XJO-ASX.
XJO-ASX 09.25.2018 Weekly Chart Swing Sequences
With the break above the 2007 peak. $XJO-ASX will support the idea that only a Super-cycle degree correction will happen instead of a Grand Supercycle degree. As shown the in the chart above. At this moment only the time will tell us what will happen. But anyhow, the correction will happen no matter which President is elected and the Market Makers knows about it.
Back


