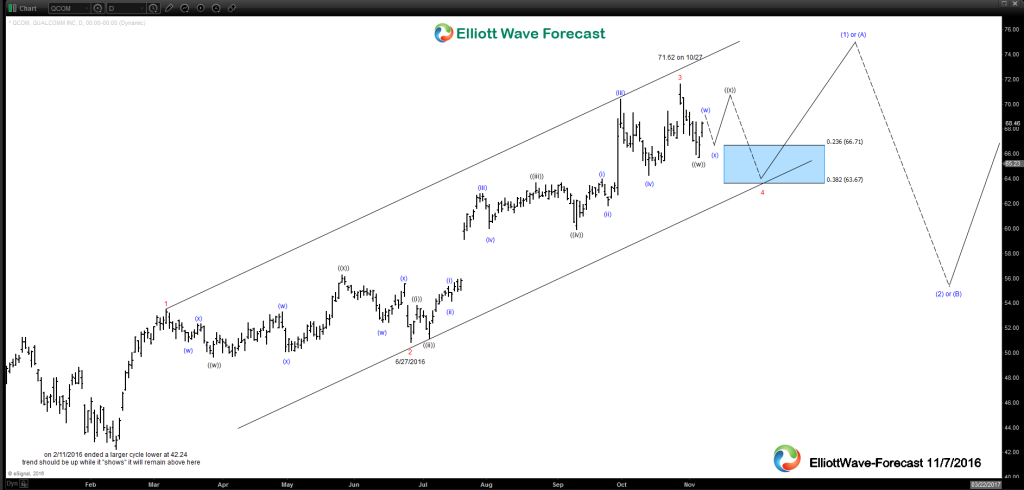
Here is a daily Elliott wave analysis of Qualcomm Incorporated based in California, USA. This Nasdaq stock is well below it all time peak back in the year 2000 and did suffer a quite a pullback lower with the rest of the market into 2002 then has traded sideways to higher from there. Most recent larger degree dip appears to have ended a corrective cycle lower back on 2/12/2016 at the 42.24 lows . The uptrend from there thus far appears to be impulsive and I think it should likely do a bit of sideways trading in a wave 4 before another swing higher in the 5th wave toward $75 before it ends this cycle up from the 2/11 lows. As for the wave 4 itself, you can almost expect to see anything or a combination corrective wave however it should ideally end in that .236 to .382 Fibonacci retracement area of the wave 3. This article “What to look for in an Elliott Wave four” may be of help. Once the wave 4 is favored to have a low in place this article “How to get an Elliott Wave fifth wave target” can be of help determining the upper target area more precisely. Afterward of seeing that 75 or so area I would expect it corrects the cycle up from the 2/11 lows before much more progression higher.
Thanks for looking and coming to the website and if you like take a trial subscription of our service and see if we can be of help in your trading. Kind regards & good luck trading. Lewis Jones of the elliottwave-forecast.com Team
