

The Power of 3-7-11 and the Grand Super Cycle: How We Saw the Bullish Turn in April 2025 Back on April 9, 2025, while World Indices were dropping sharply and global sentiment had turned overwhelmingly bearish, we published an article that challenged the fear-driven narrative. We explained why selling was not the right approach and […]
-
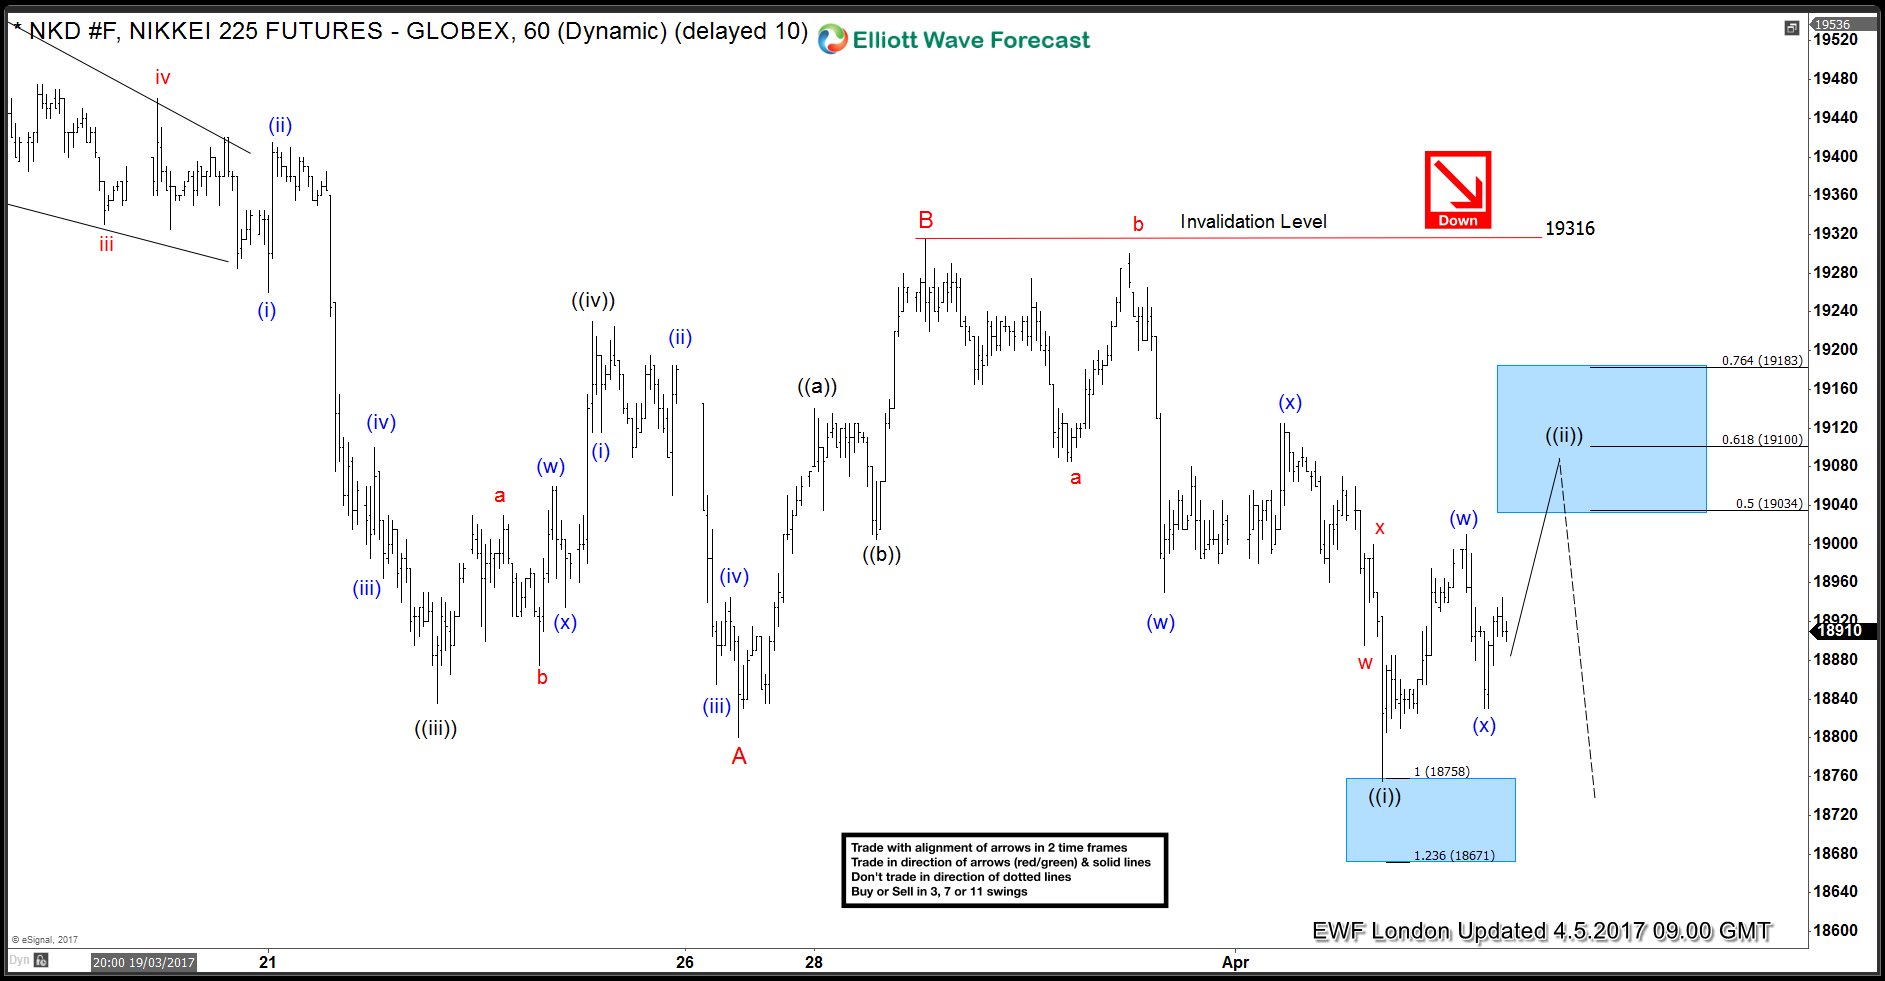
Nikkei Elliott Wave structure calling the decline
Read MoreHello fellow traders. In this technical blog we’re going to take a quick look at the past Elliott Wave charts of Nikkei published in members area of www.elliottwave-forecast.com. We’re going to explain the structure and see how we forecasted the path. Let’s start by taking a look at Nikkei 4 hour chart from 04.05.217. As we […]
-
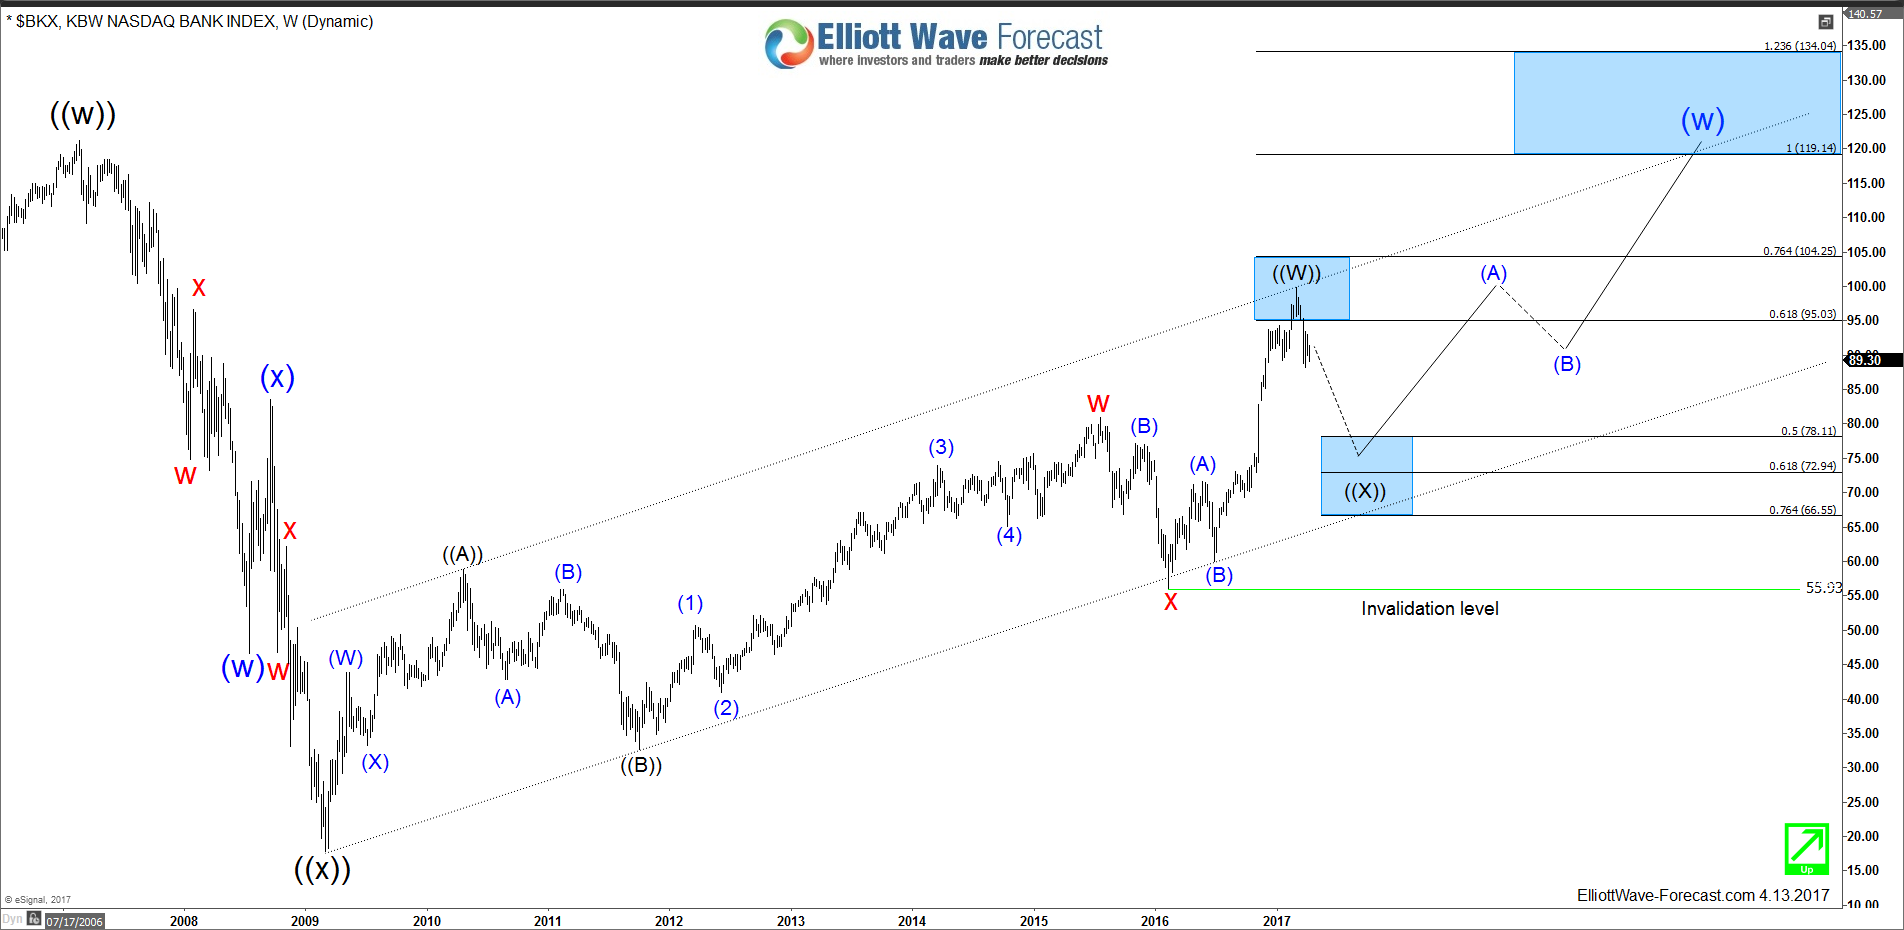
KBW Bank Index Extended Correction
Read MoreKBW Bank Index is an economic index consisting of the stocks of 24 banking companies delivering a direct exposure to the banking sector and offering a targeted view to a unique corner of the U.S. financials sector. The top holdings Banks of the index are among the biggest financial institutes in the world and most of […]
-
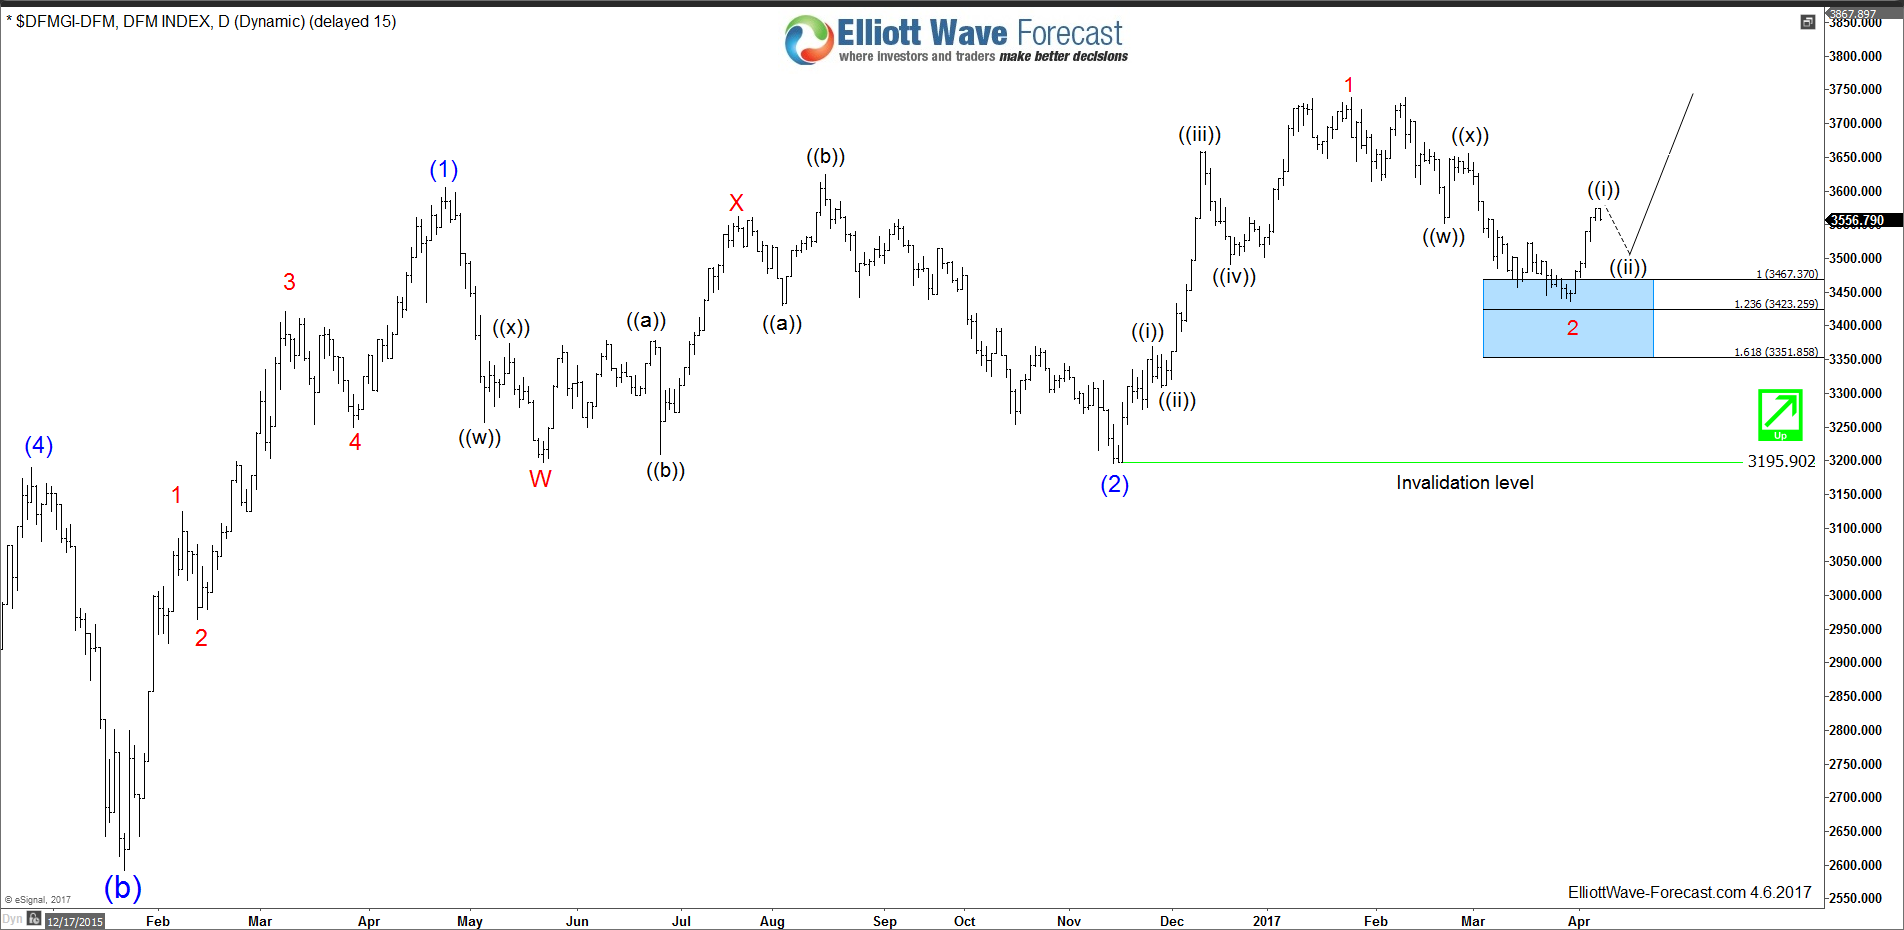
Dubai Index ( DFMGI ) Elliott Wave View
Read MoreDFMGI tracks Dubai Financial Market which is the largest financial trading exchange in the United Arab Emirates. Dubai has emerged as a global city and business hub of the Middle East , it’s contently growing bigger and becoming one of most expensive city in the world. The Dubai Financial Market (DFM) was founded on 2000, looking at […]
-
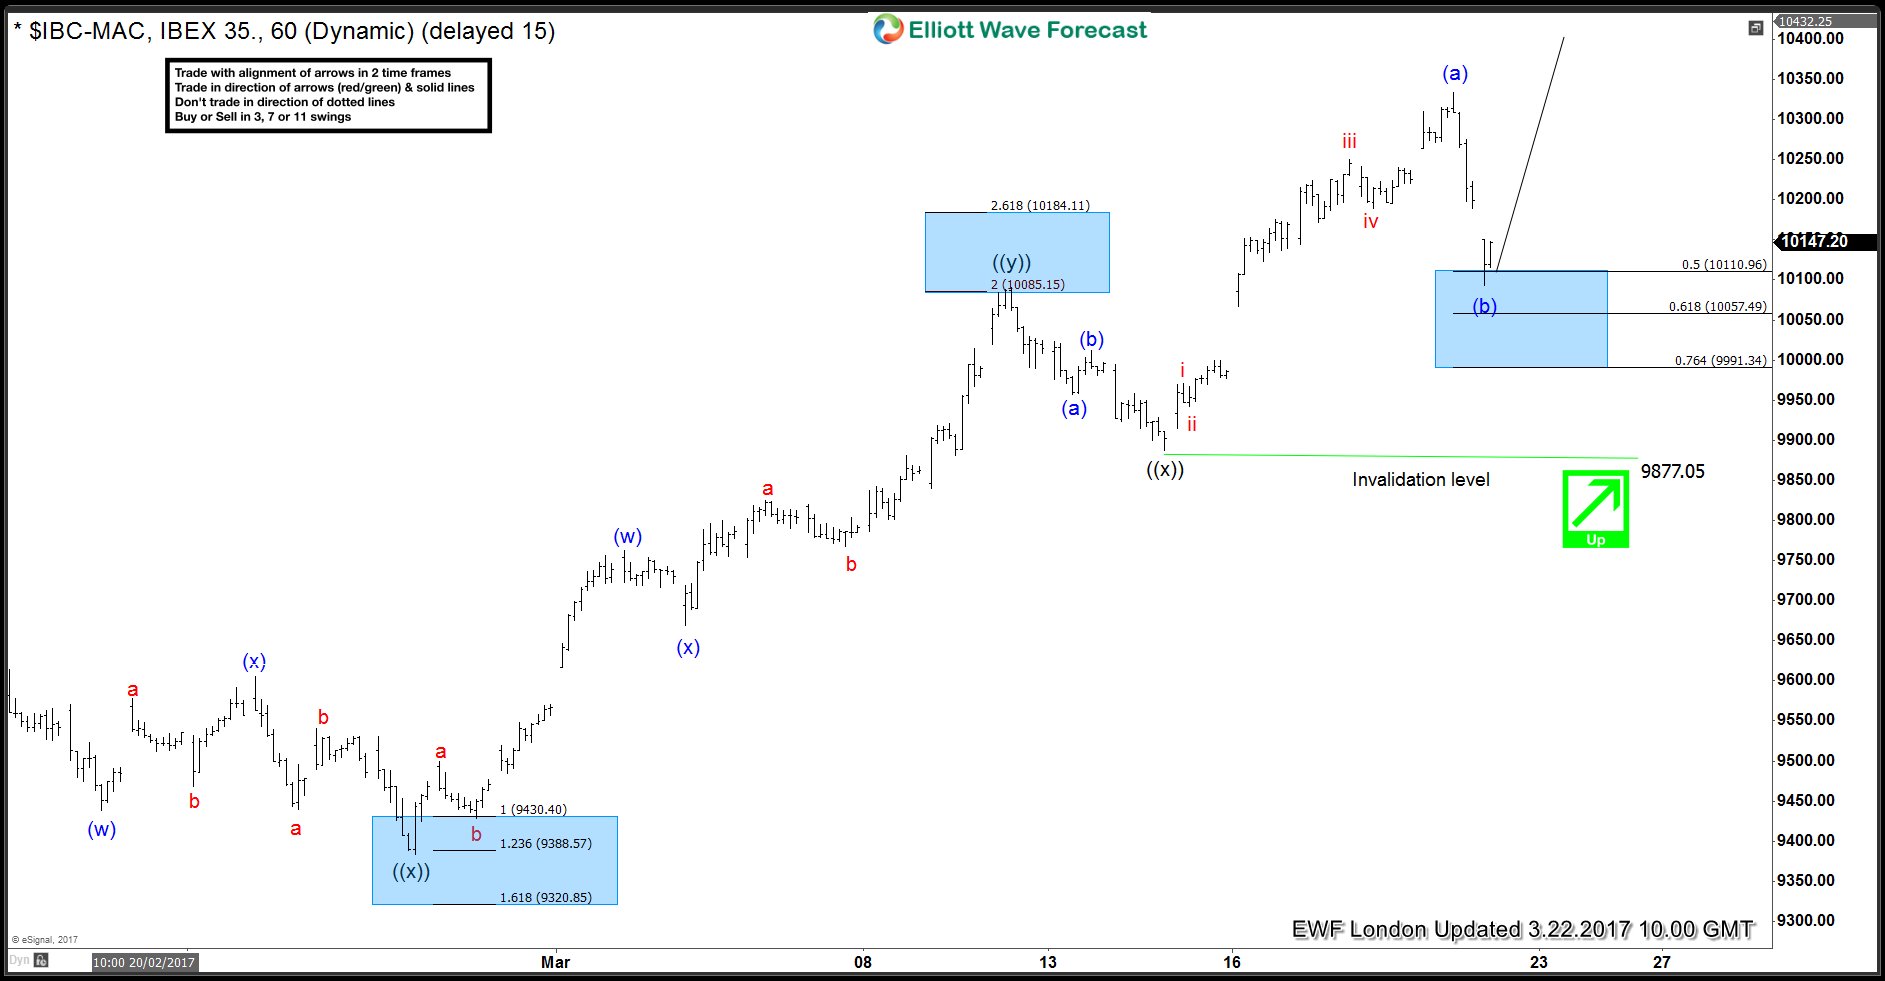
IBEX: Triple Three Elliott Wave Structure
Read MoreIn this Technical blog we’re going to take a quick look at the past Elliott Wave chart of IBEX chart from March 22,2017, which were presented to the clients at elliottwave-forecast.com. We are going to explain the structure & see how the index continued the rally afterwards. IBEX 1 Hour March 22 London Updated Chart Above […]
-
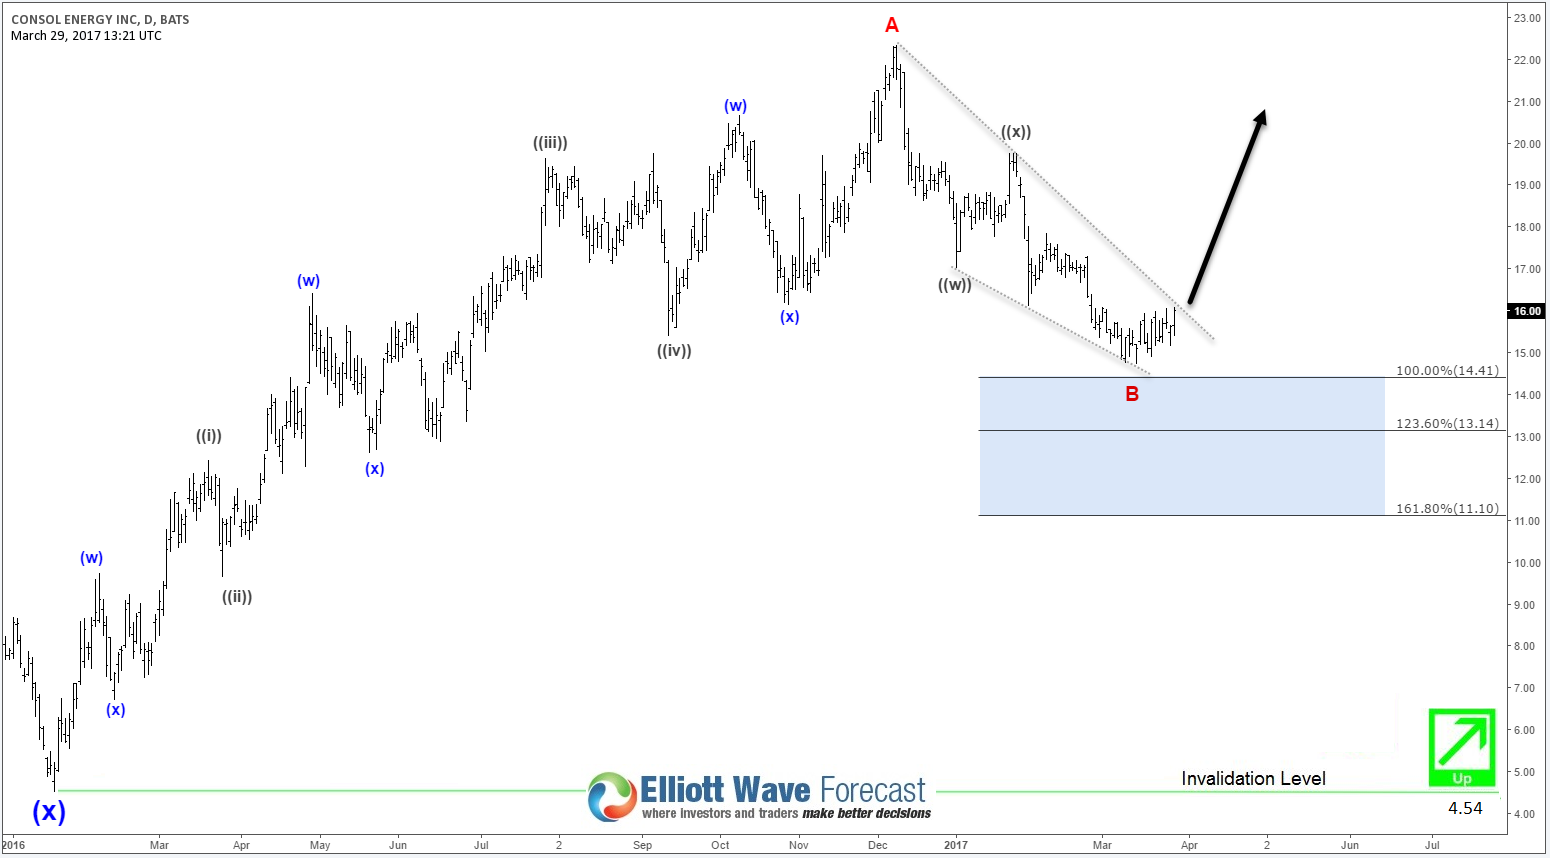
Consol Energy Resuming the Rally
Read MoreConsol Energy (NYSE:CNX) is the largest producer of bituminous coal in the United States and the largest exporter of U.S. coal, It managed to survive through the major disruption in the financial markets because of its diversification strategy around natural gas and other services. Despite being one of the oldest company in the industry, originally created in 1860 […]
-
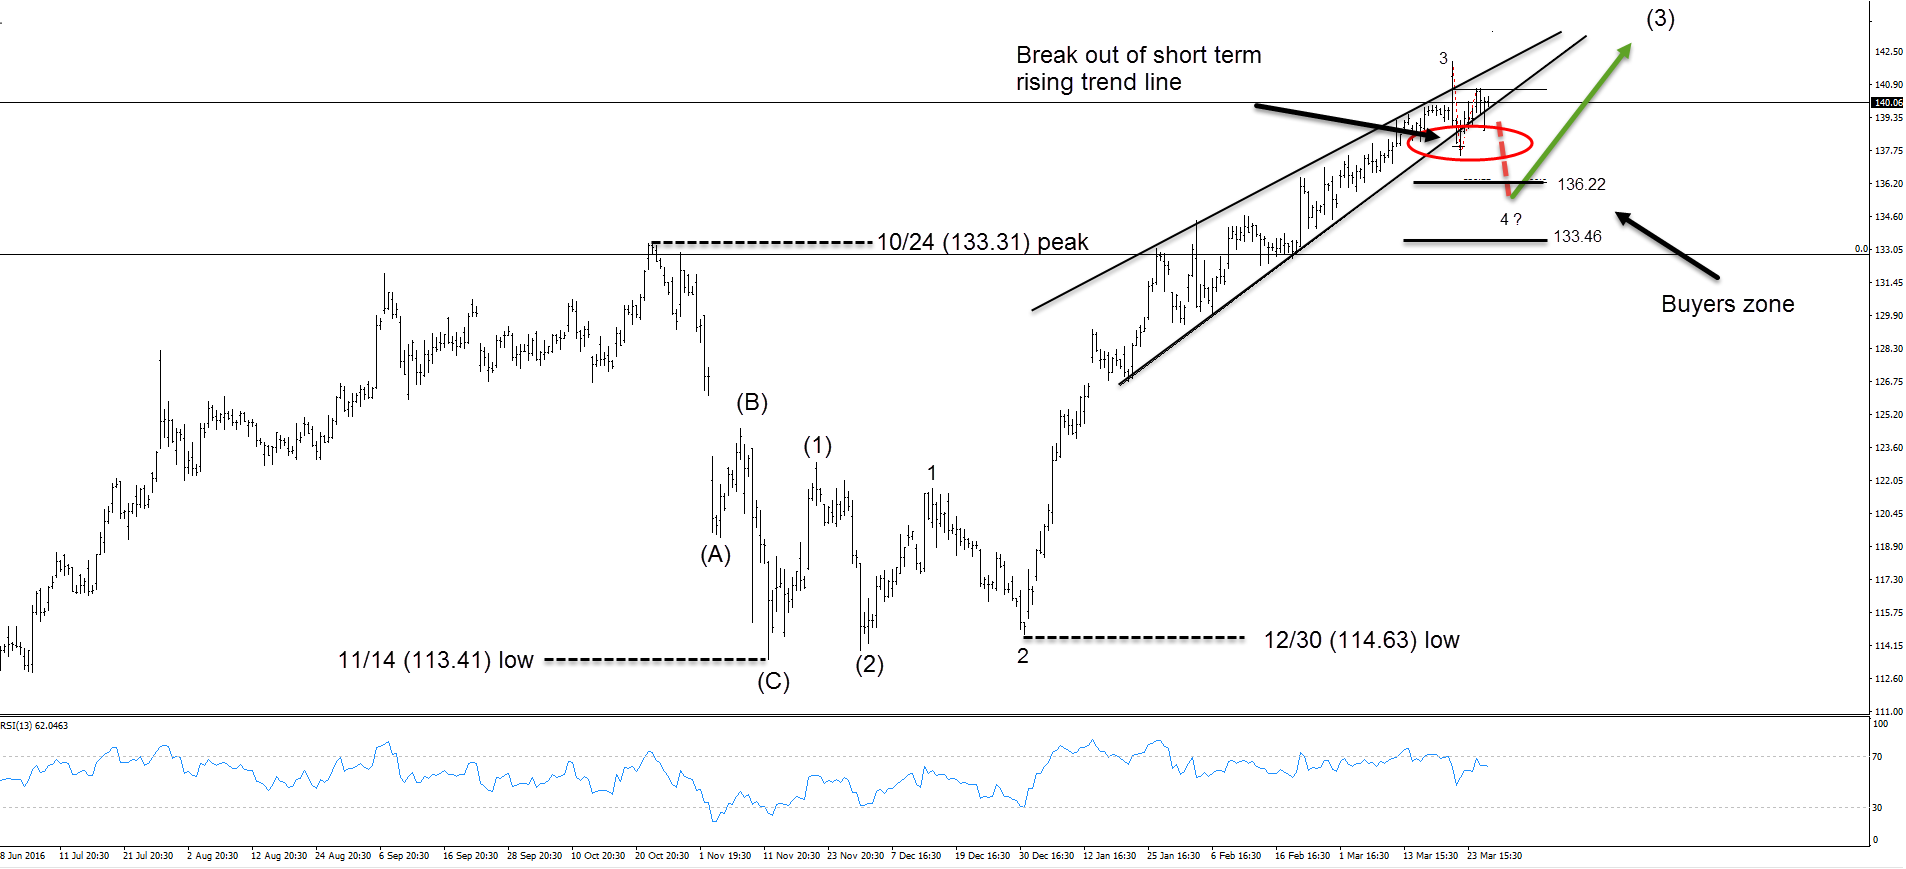
Facebook broke the short term trend line
Read MoreIn our last technical blog about Facebook, we explained that the stock is in a 3-year-old bullish trend, forecasted further rally and break above 10/24 (133.31) peak. As we can see now from the chart below, the price ended pull back at 113.41 low on November 14th as a truncation. After that, it traded sideways […]