

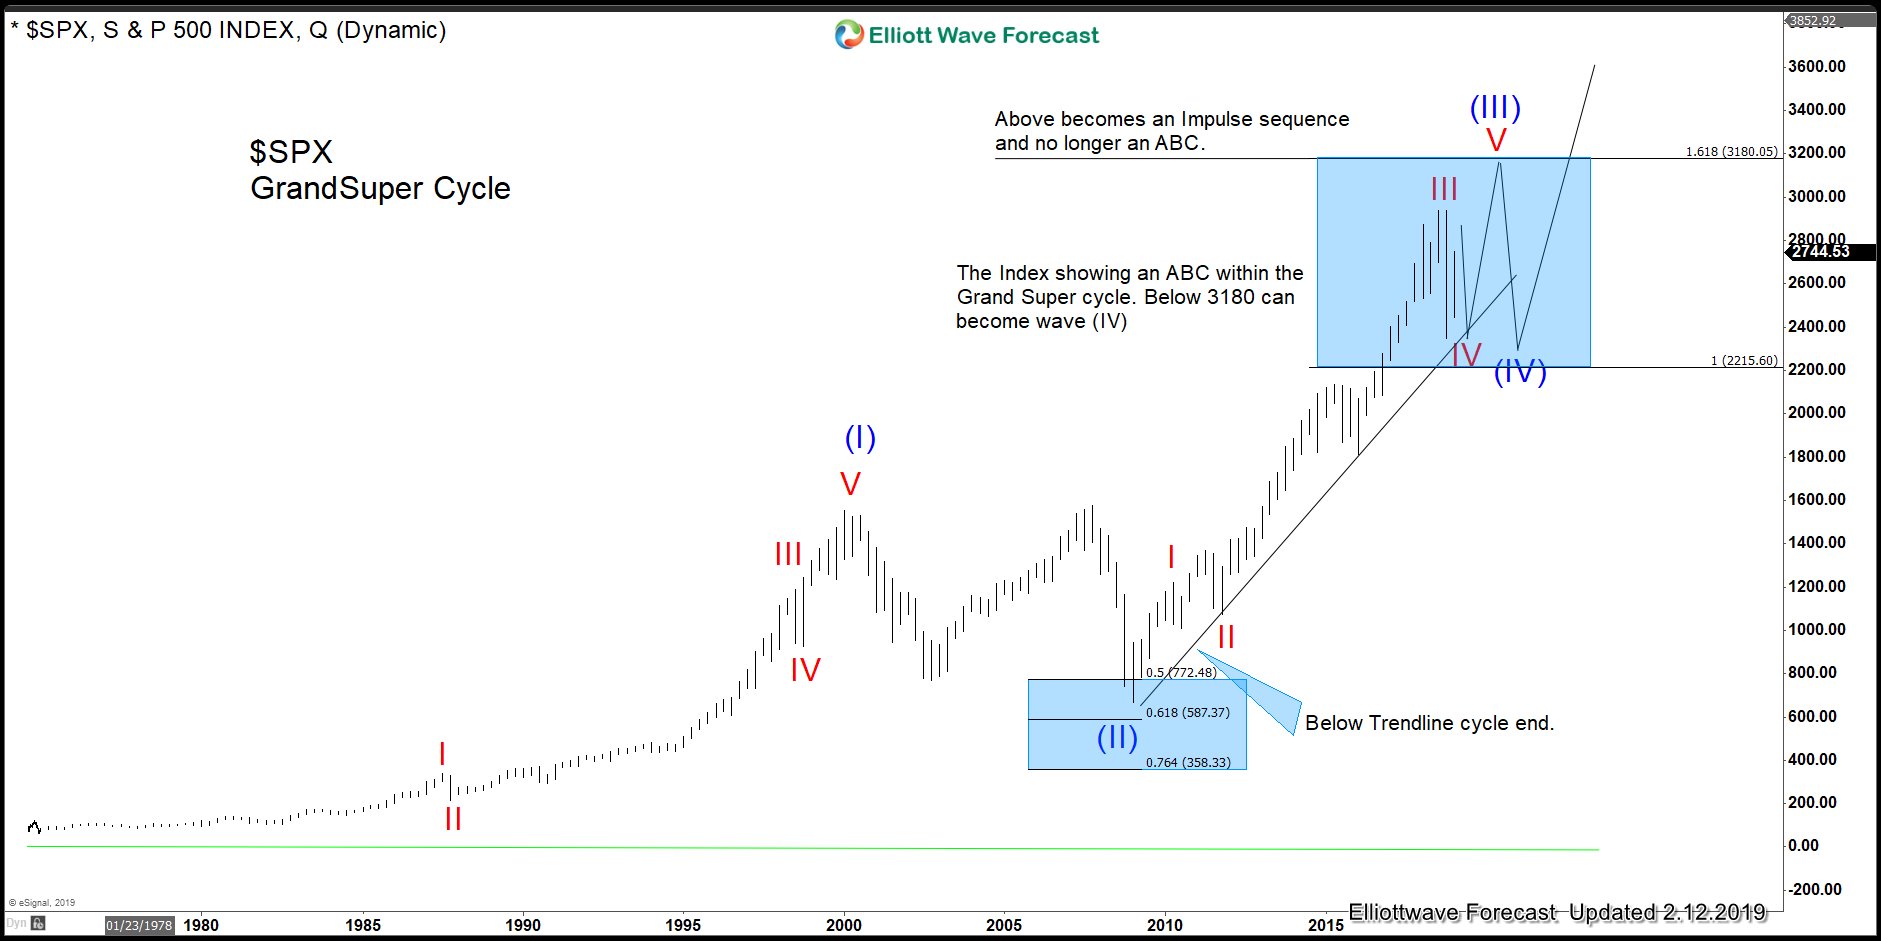
The Power of 3-7-11 and the Grand Super Cycle: How We Saw the Bullish Turn in April 2025 Back on April 9, 2025, while World Indices were dropping sharply and global sentiment had turned overwhelmingly bearish, we published an article that challenged the fear-driven narrative. We explained why selling was not the right approach and […]
-
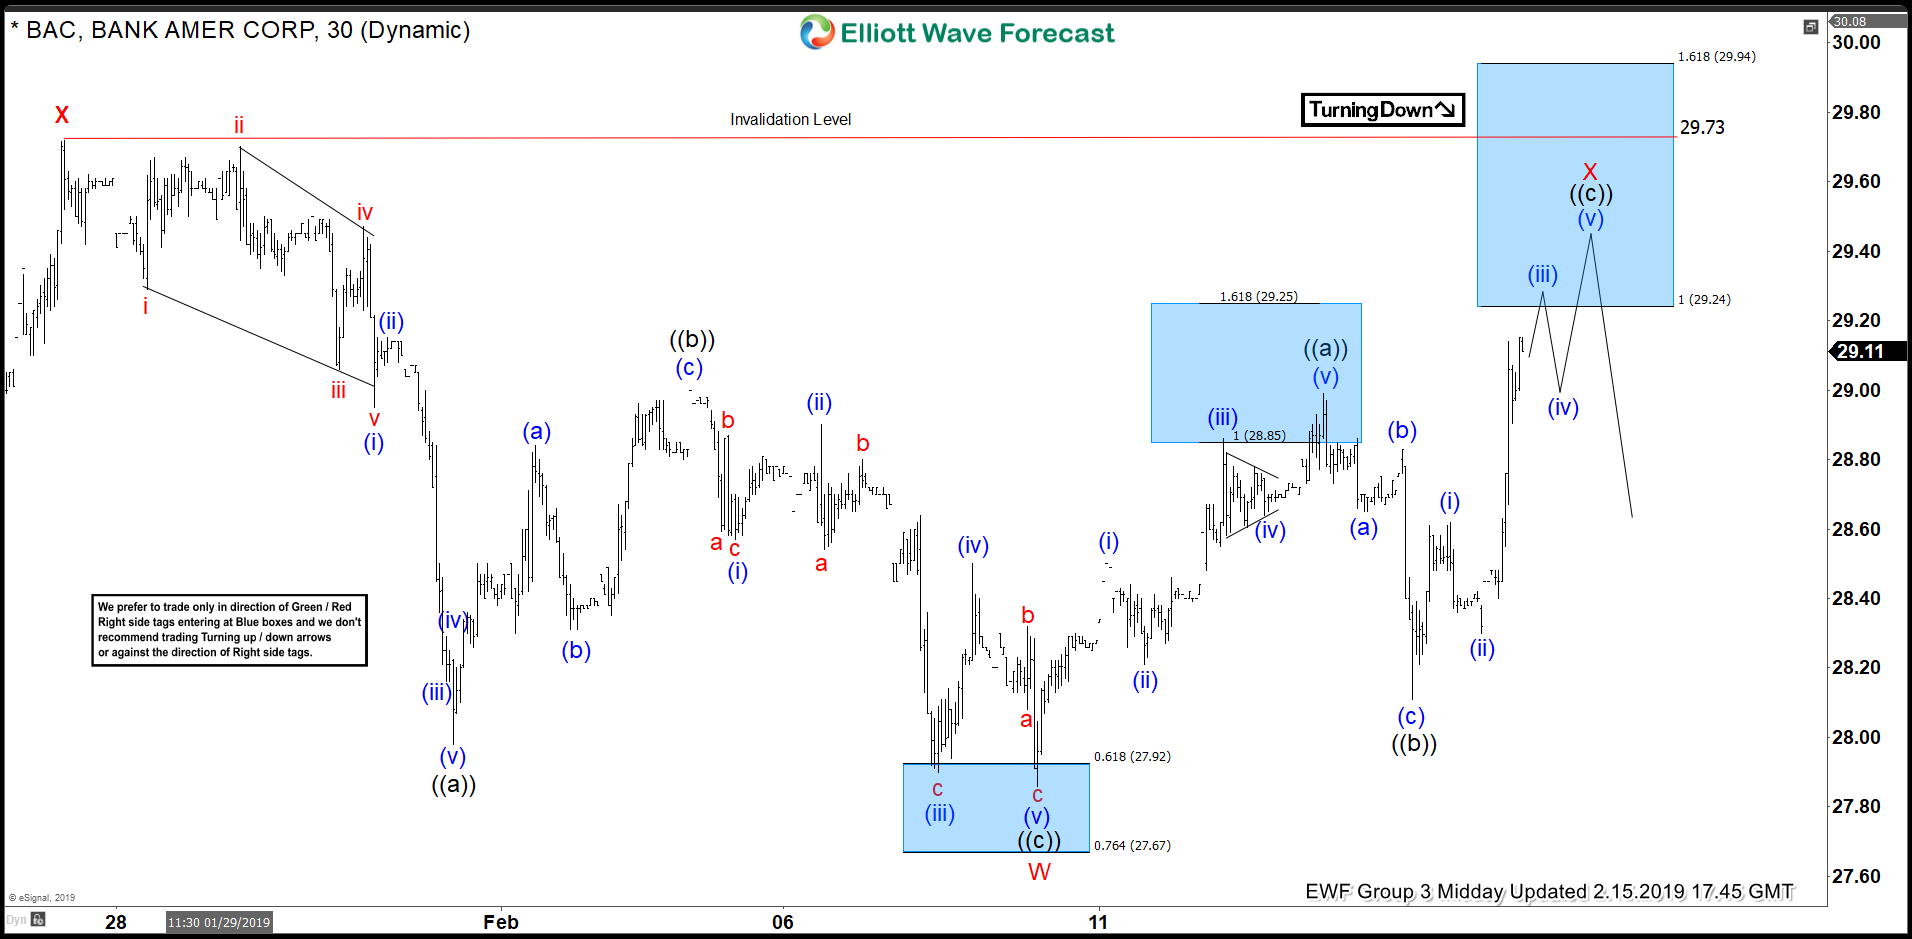
BAC Elliott Wave Analysis: Blue Boxes calling the reaction lower
Read MoreToday, I want to share with you some Elliott Wave charts of the Bank of America stock ( BAC ), which we presented to our members at Elliott Wave Forecast. You see the 1-hour updated chart presented to our clients on the 02/13/19 below. BAC ended the cycle from 01/25/19 peak at the low of 02/08/19 in red wave W. The […]
-
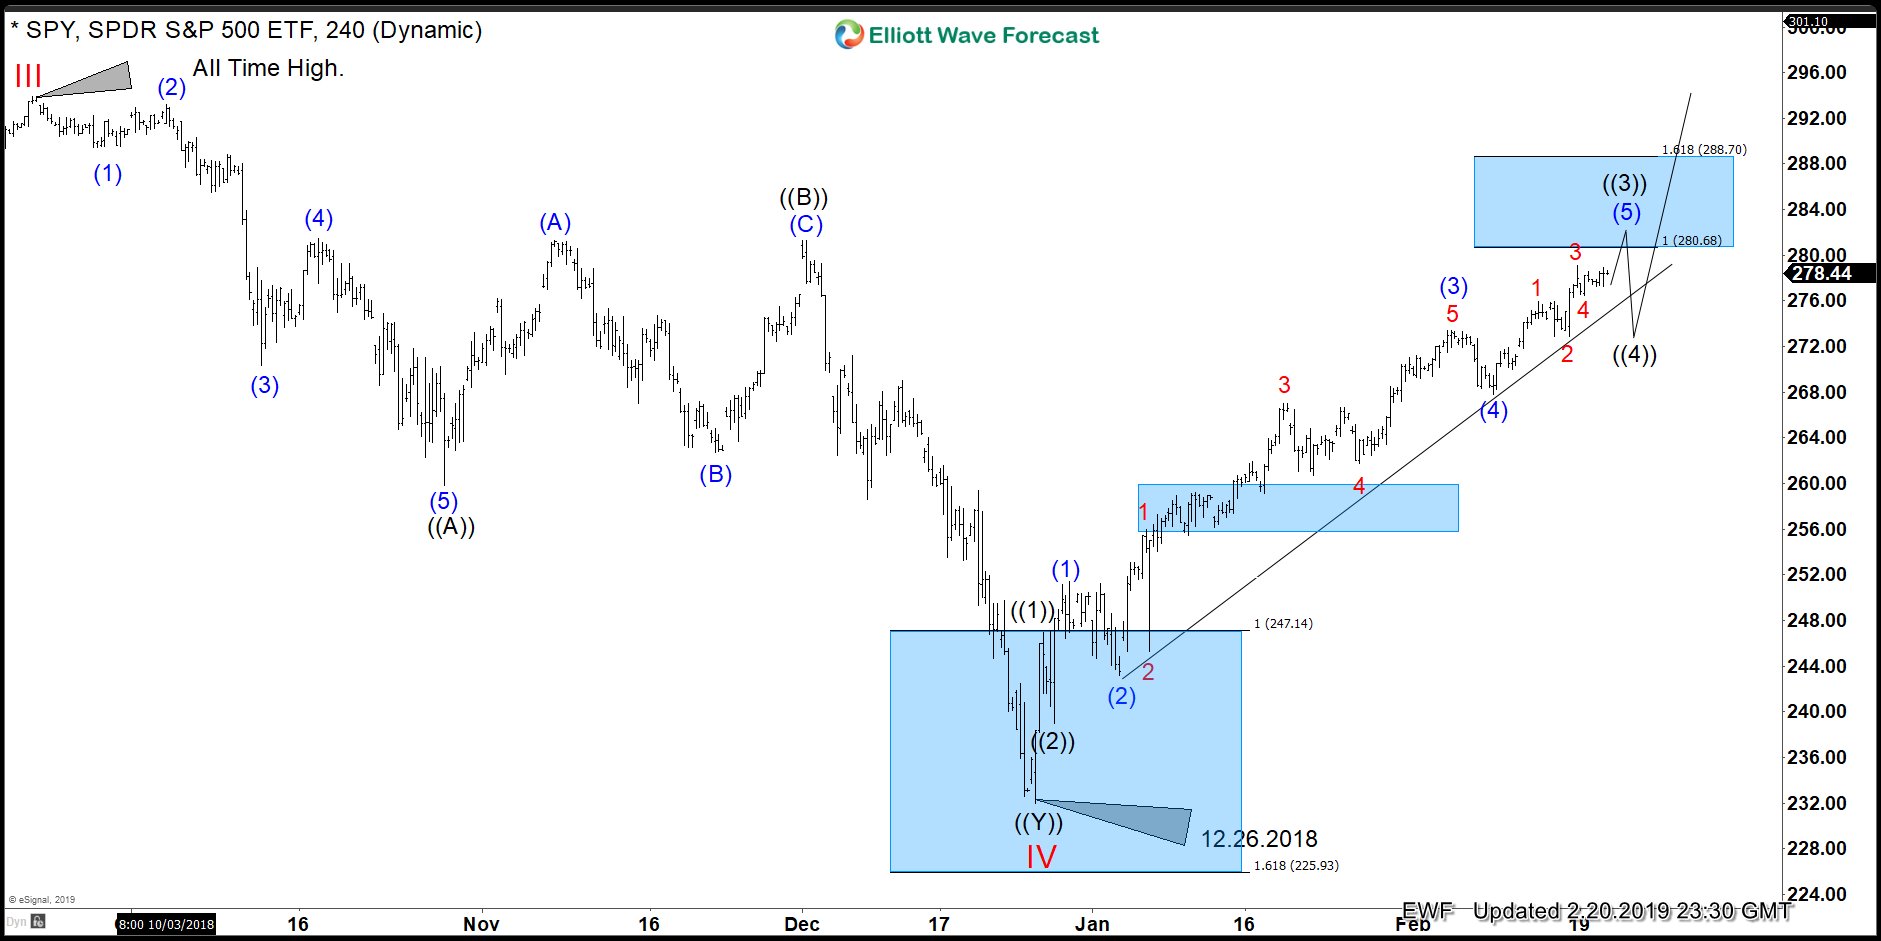
$SPY : The Index Heading for All-Time High.
Read MoreThe ETF is rallying from the blue box after forming the low on 12.26.2018, Blue box is an area where buyers and sellers agree in the next direction. We have developed a system in which we present the boxes to members on our charts and combine it with the right side to enter the market. […]
-
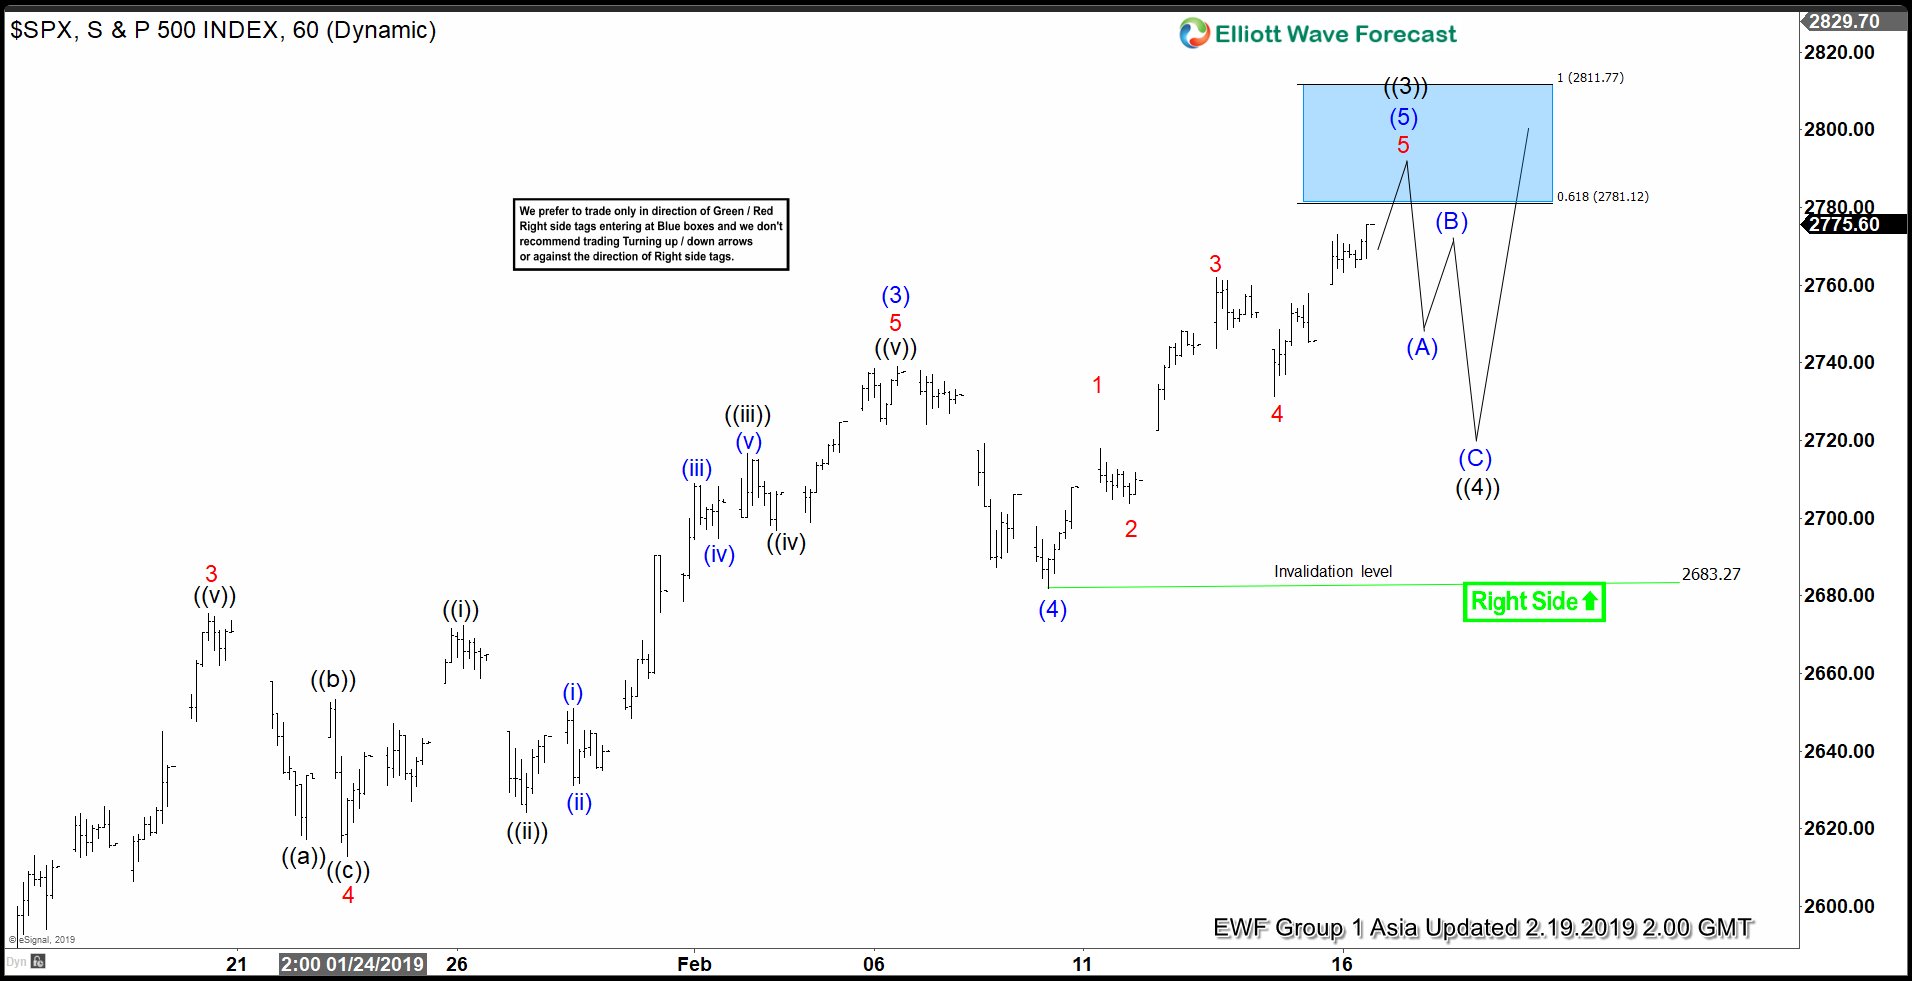
Elliott Wave View: S&P 500 (SPX) Rallies as an Impulse
Read MoreThe article and video explains the short term path of S&P 500 (SPX). The Index is rallying as an impulse from Dec 26, 2018 low & can see 1 more leg higher before ending the 5 waves and do a larger pullback.
-
$SPX: Who is Right? The Fed or President Trump
Read MoreThe S&P 500 ($SPX) had the worst December in history as the market got nervous. Many started to guess the possible reasons and came up with many different arguments. There were several reasons like the trade wars with China and the political environment in the US, among others. One particular reason about President Trump got […]
-
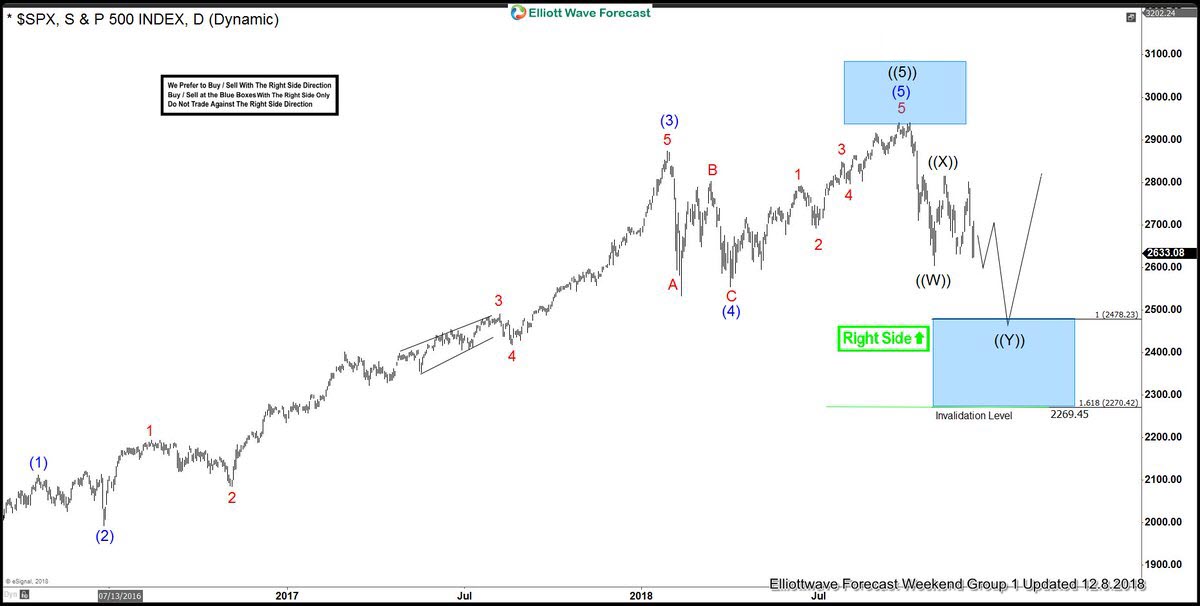
S&P 500 Forecasting The Path
Read MoreHello fellow traders. In this technical blog we’re going to take a quick look at the Elliott Wave charts of SPX, published in members area of the website. Back in December 2018 we were calling cycle from the 21st September 2018 peak still unfinshed to the downside. Our Elliott Wave analysis were calling for more […]
-
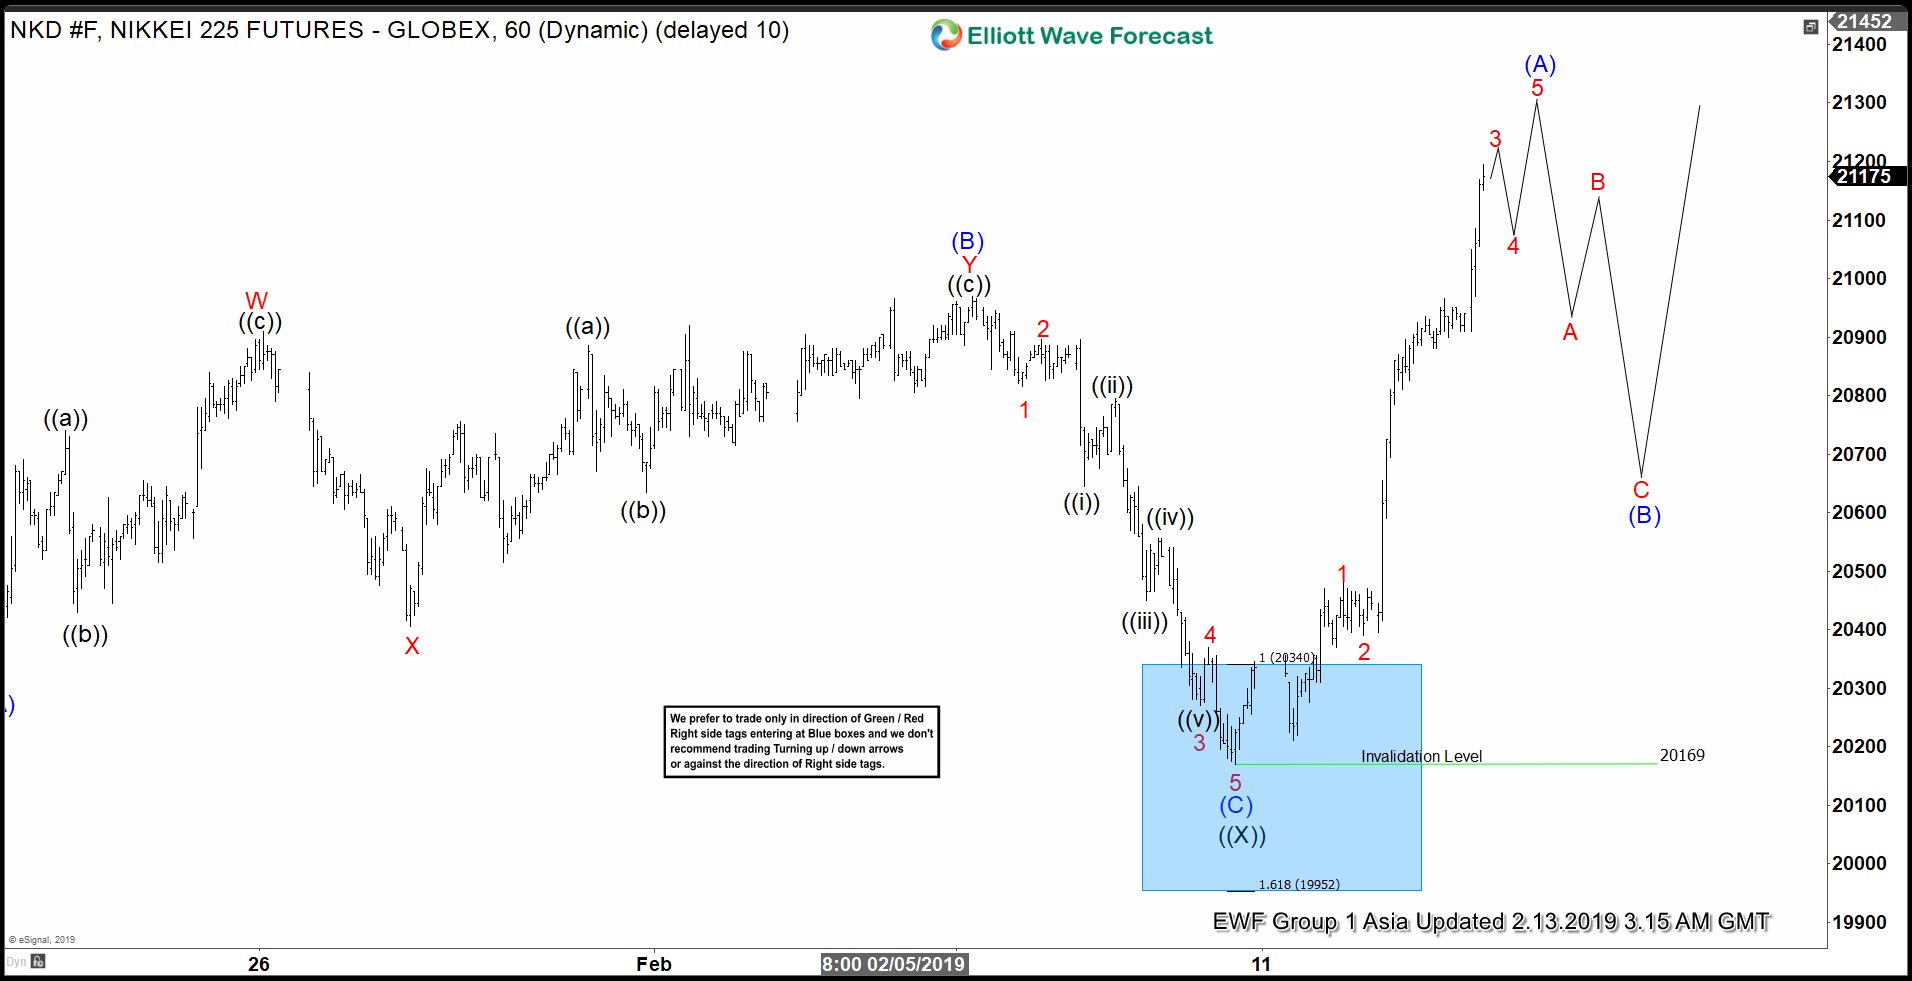
Elliott Wave View: Further Rally in Nikkei Favored
Read MoreThis article and video explain the short term path for Nikkei. The Index is showing a bullish sequence and favor further upside.