

The Power of 3-7-11 and the Grand Super Cycle: How We Saw the Bullish Turn in April 2025 Back on April 9, 2025, while World Indices were dropping sharply and global sentiment had turned overwhelmingly bearish, we published an article that challenged the fear-driven narrative. We explained why selling was not the right approach and […]
-
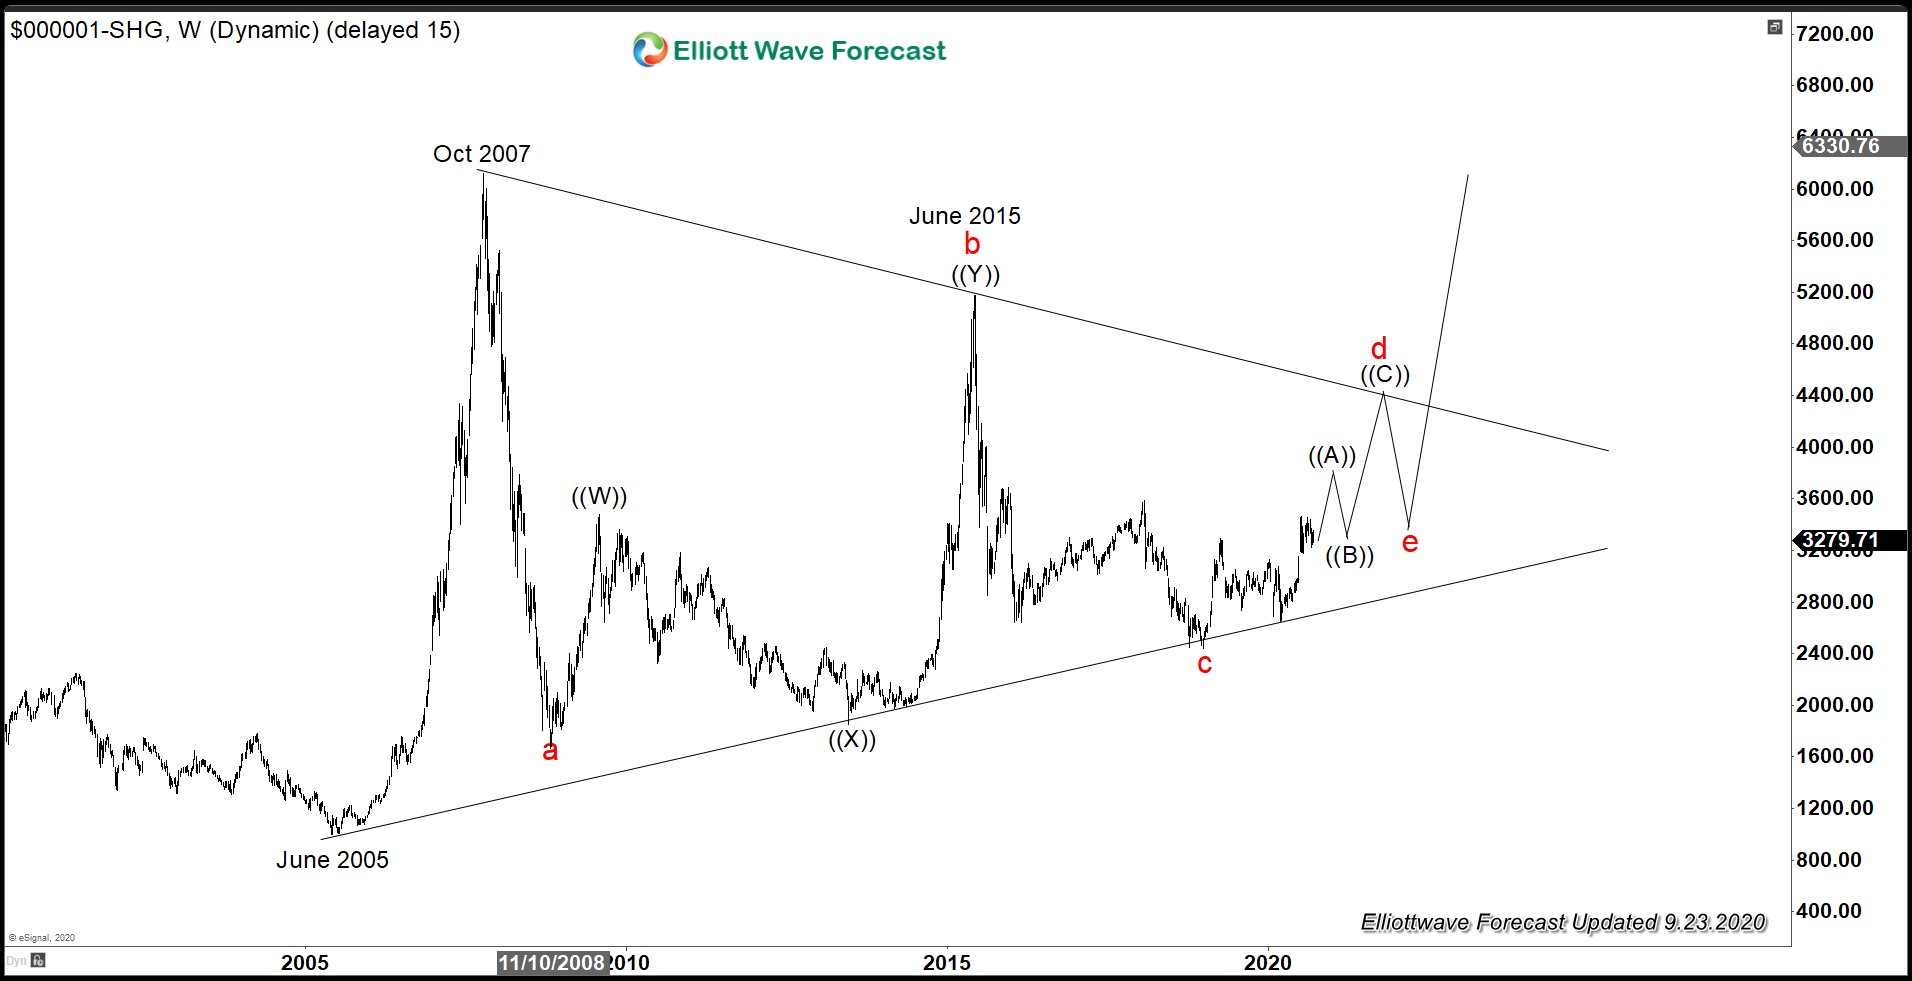
Shanghai Composite Index in Multi Year Consolidation
Read MoreAs of 22 September, Shanghai Composite Index (SSE) is up 6.9% despite the geopolitical tension with the US and coronavirus pandemic. Contrast this with S&P 500 which has YTD performance of 2.1%. Part of the reasons for the resilience is due to Chinese economy relatively speedy recovery from the pandemic. After the initial breakout in […]
-
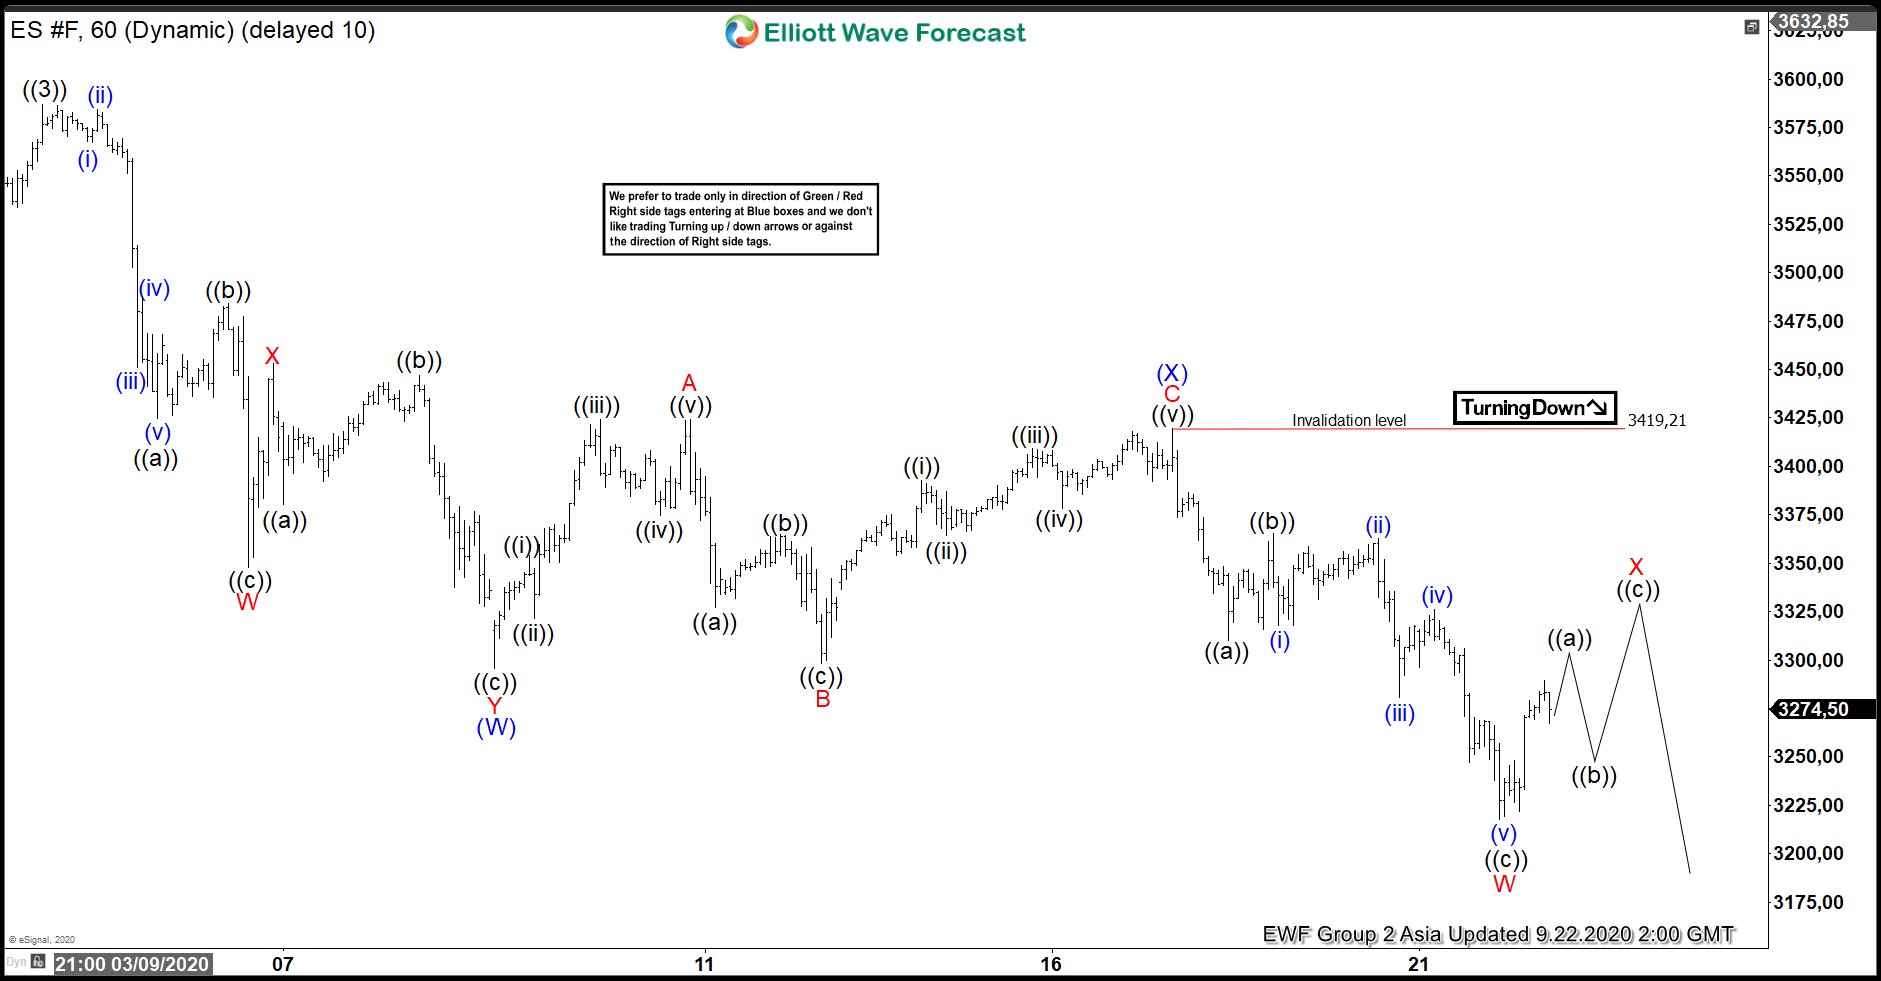
Elliott Wave View: S&P 500 E mini Futures (ES) Correction In Progress
Read MoreES_F is correcting cycle from June 15 low as double three correction. While below September 17 high, expect bounce in 3,7,11 swings to fail.
-
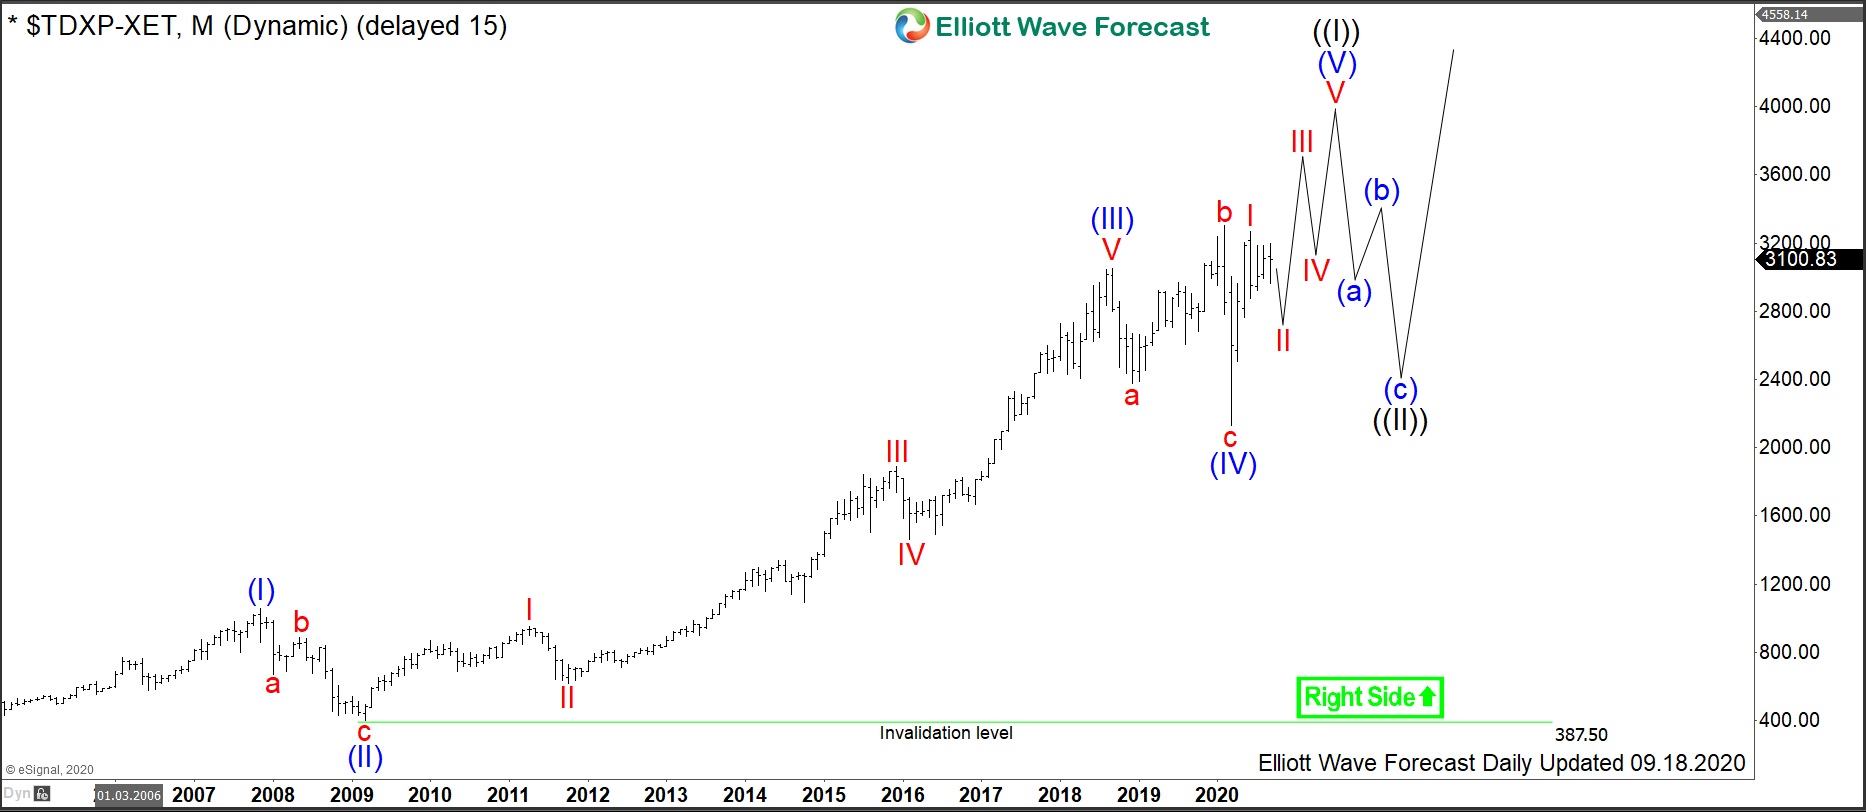
TecDAX: Buying Opportunity in German Technology
Read MoreTecDAX is a stock index which tracks the performance of 30 largest German companies from the technology sector. Even though these enterprises are of a high economic importance, their market capitalization and the book order turnover are far below of that of the DAX index. The TecDAX is related to DAX in a similar way […]
-
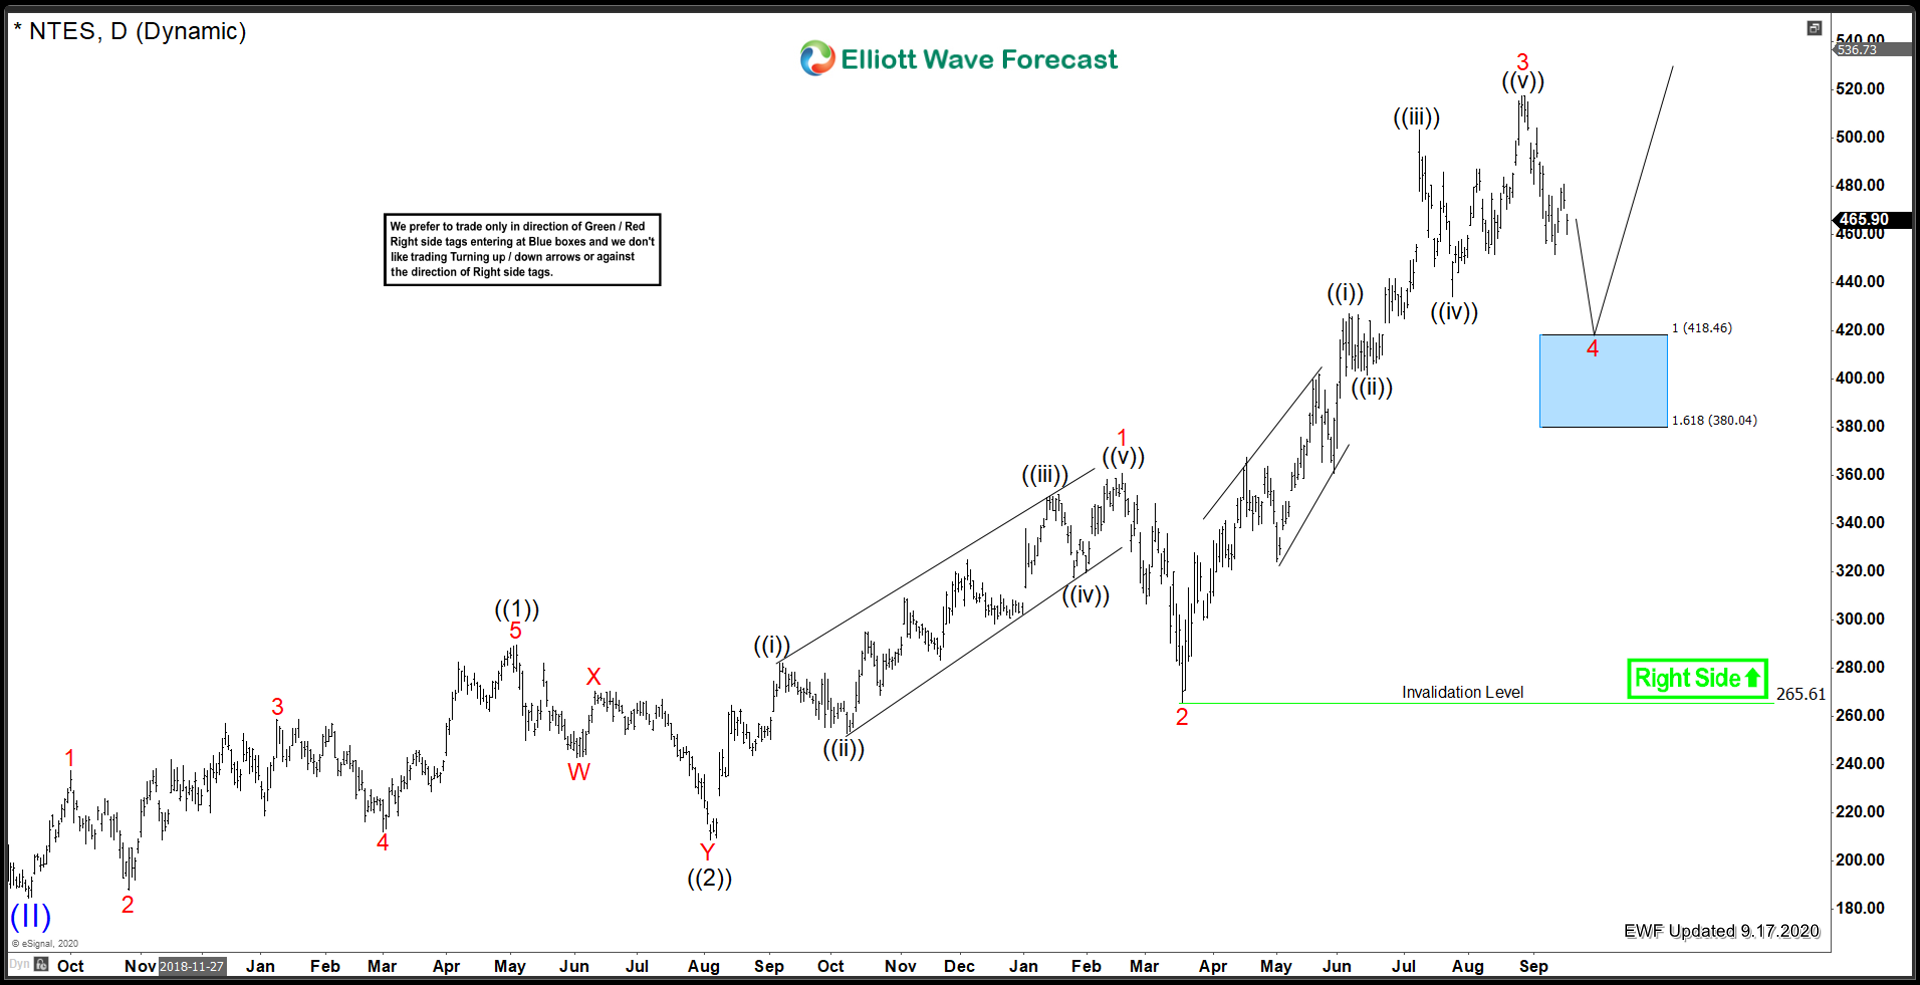
NetEase Inc. ($NTES) Strong Bullish Trend
Read MoreCloud computing is one of the sectors that have vastly outperformed the marketplace since the March 2020 low. NetEase Inc is in the cloud computing business, focused on community, communications, commerce and video games. Lets take a more detailed look at their operations: “NetEase, Inc. is a Chinese Internet technology company providing online services centered […]
-
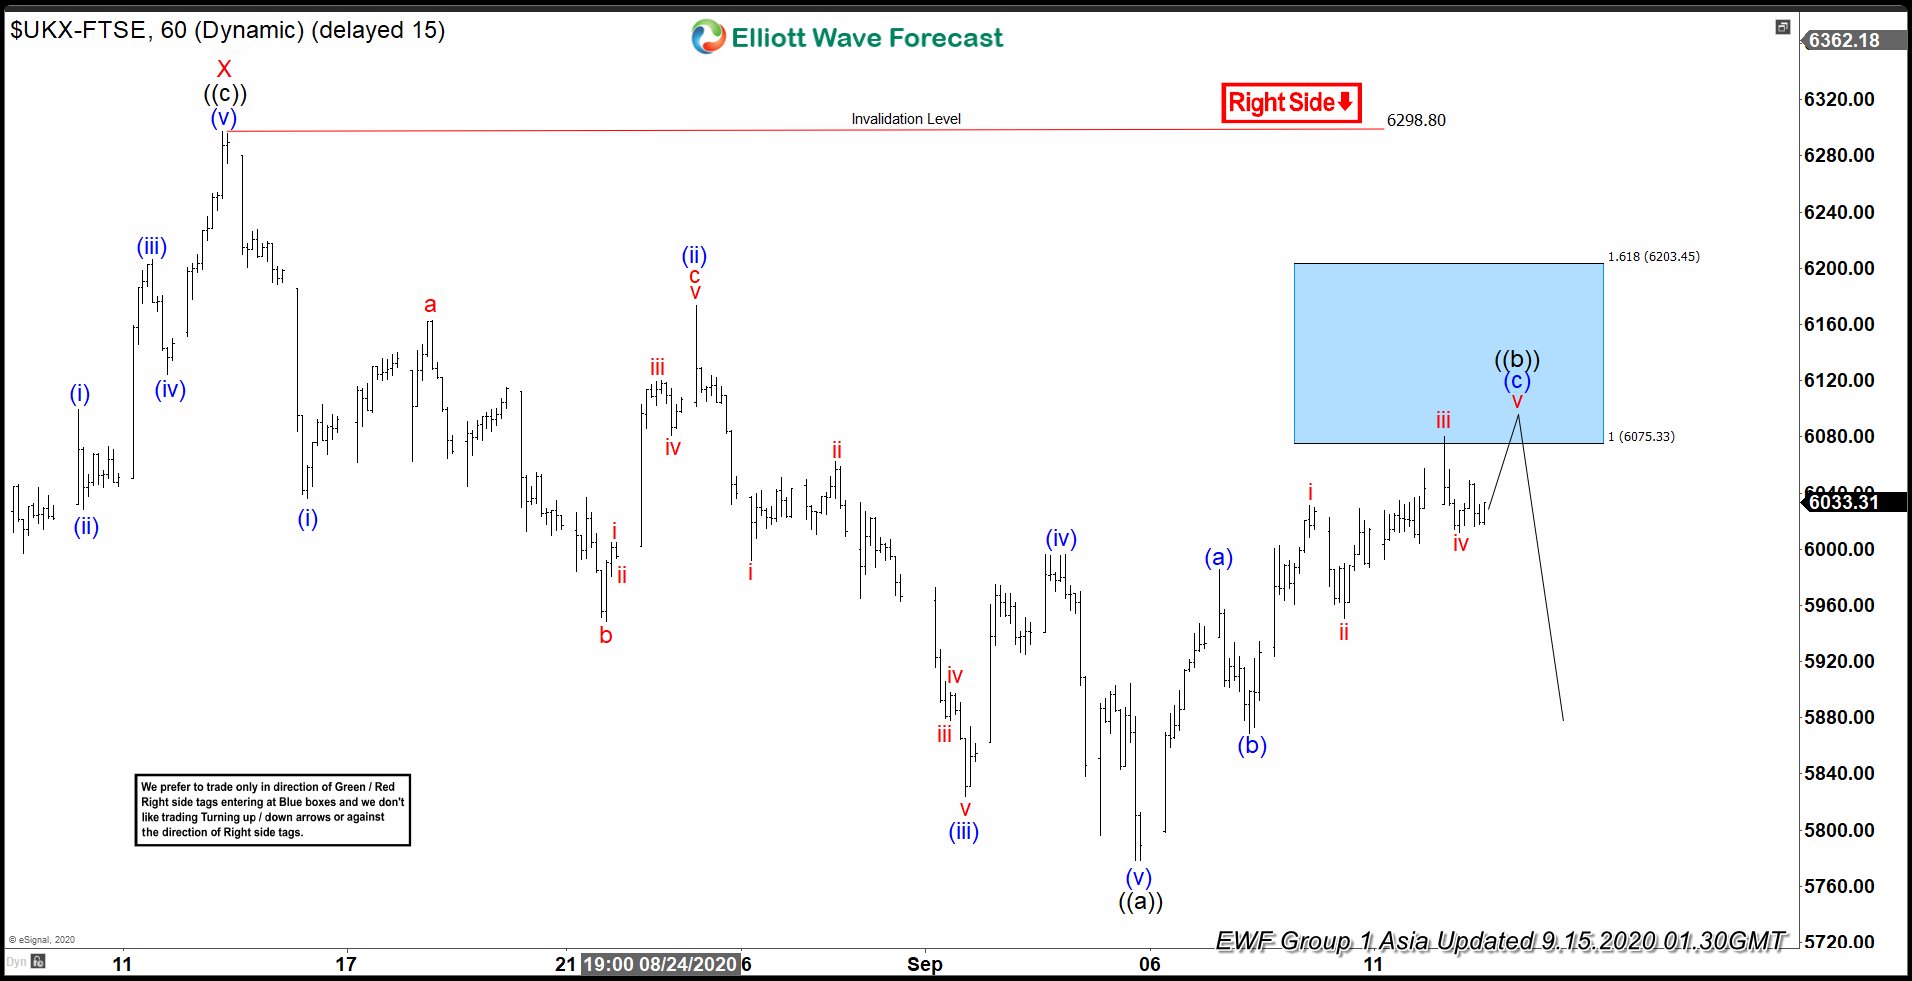
Elliott Wave View: FTSE Rally Likely to Find Sellers
Read MoreFTSE ended cycle from 8/12 high. The bounce has reached blue box area where sellers can appear for more downside or 3 waves pullback at least.
-
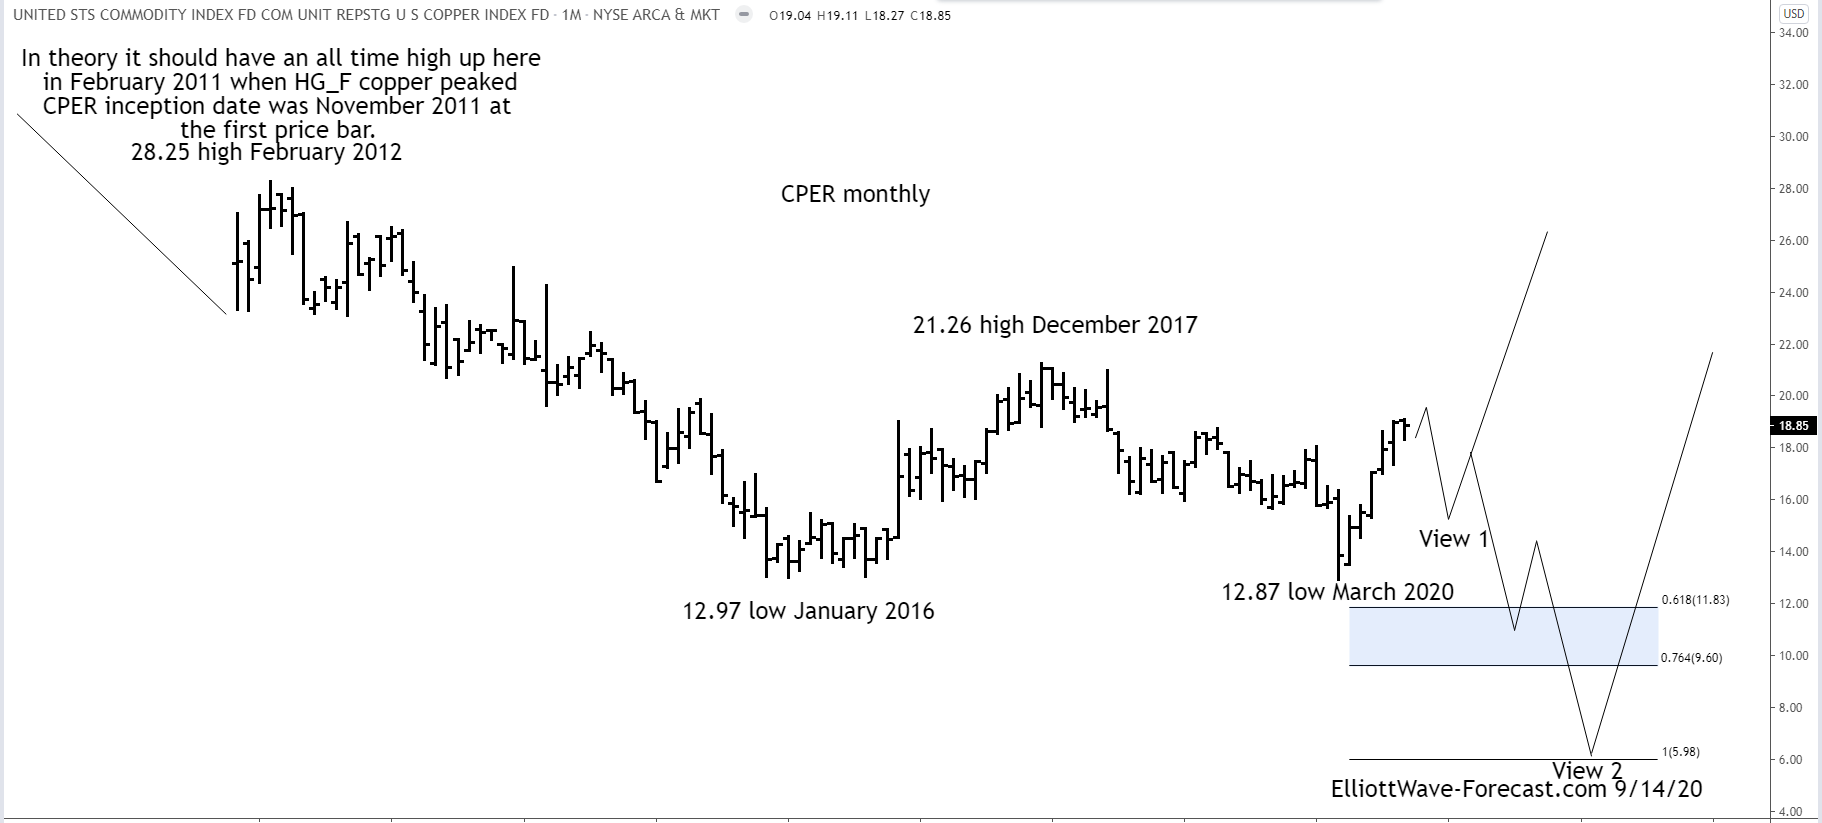
$CPER Copper Index Tracker Long Term Corrective Cycles
Read More$CPER Copper Index Tracker Long Term Corrective Cycles Firstly the CPER Copper Index Tracking instrument has an inception date of 11/15/2011. There is data in the HG_F copper futures before this going back many years. That shows copper made an all time high on February 15th, 2011 at 4.649. Translated into this instrument, it is mentioned […]