
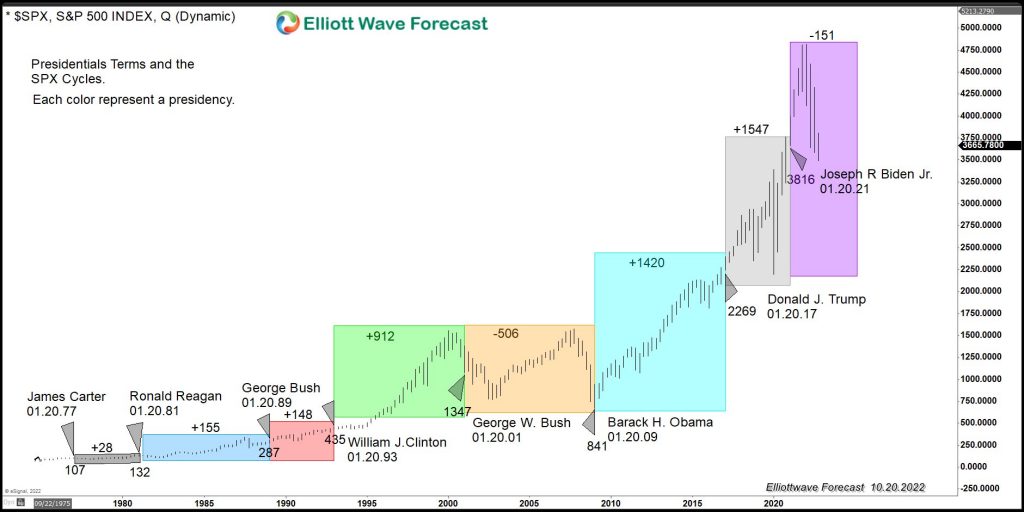
A lot has been said and written about both the Democrat and Republican economic plans for a better economy. We believe in free enterprise and limited regulation, allowing humans to create and expand at their own will for the better but there is a vast difference between the two parties regarding the economic agenda. Most […]
-
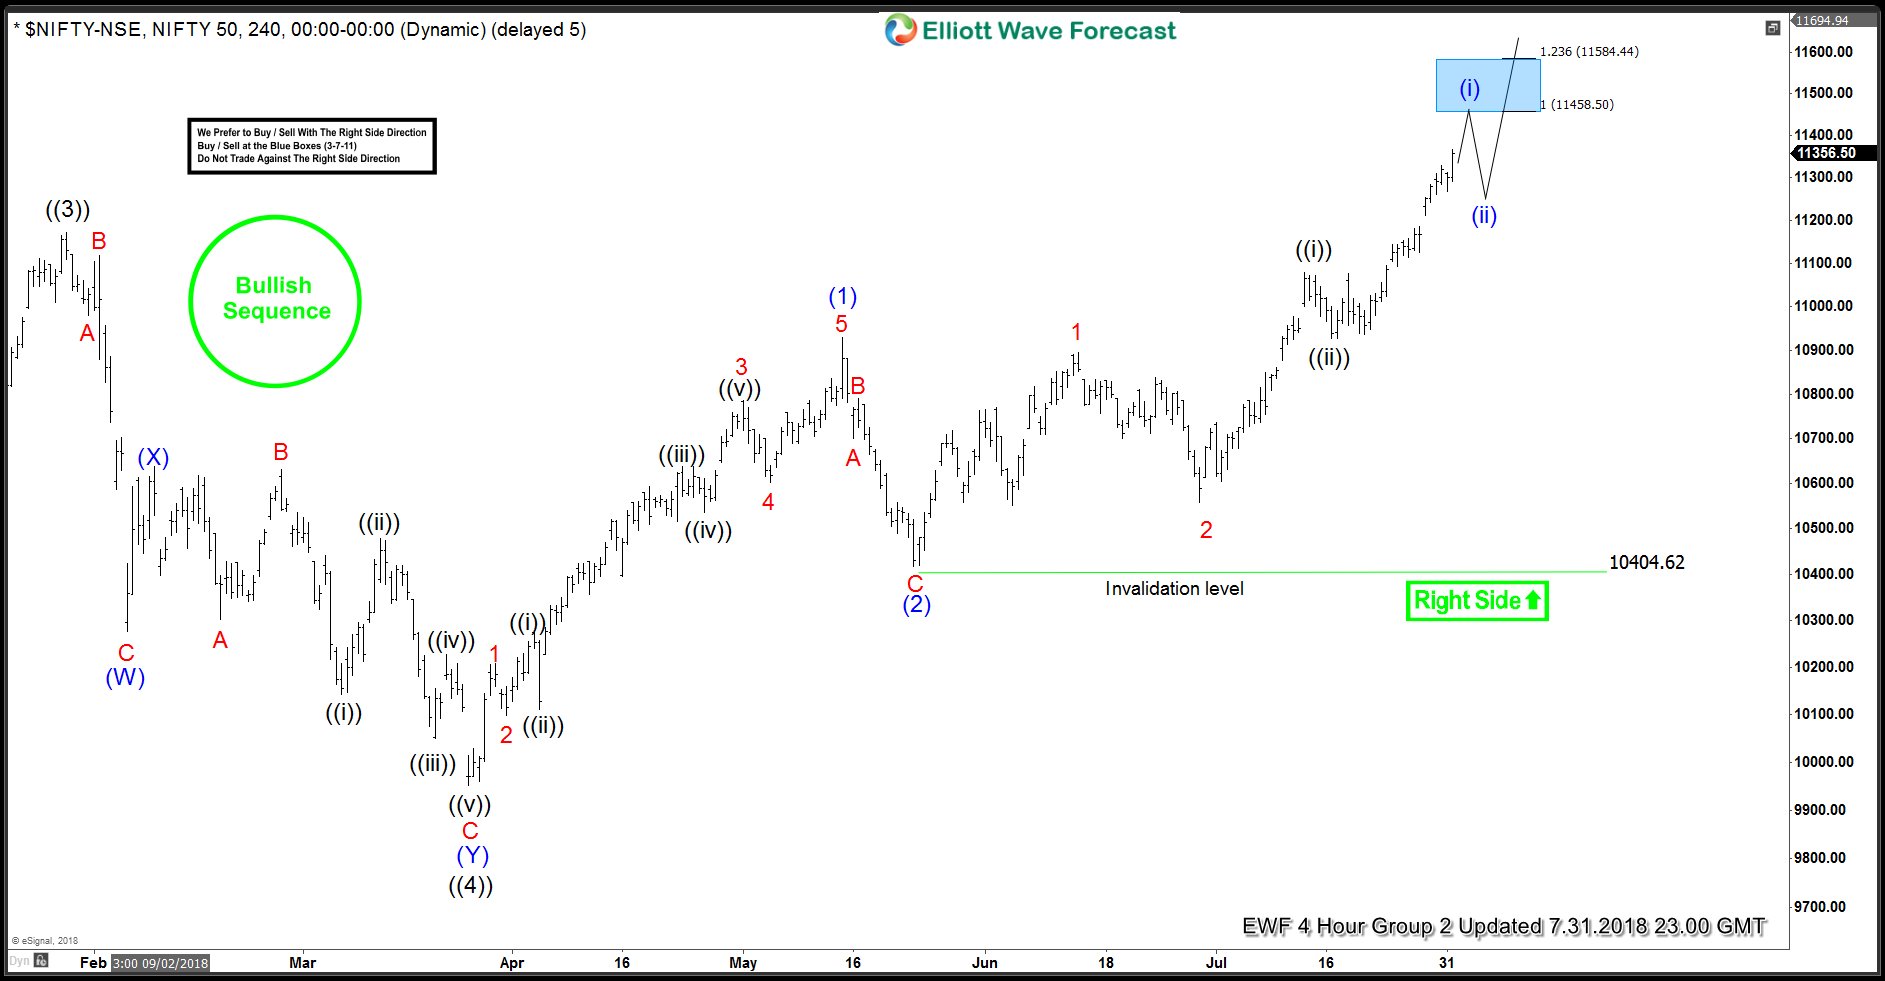

Nifty Elliott Wave Analysis: Rallying Higher as Impulse
Read MoreNifty Elliott wave analysis suggests that the rally to 11171.55 high ended primary wave ((3)). Down from there, the decline to 9951.9 low ended primary wave ((4)) pullback. The internals of that pullback unfolded as Elliott wave double three structure with sub-division of 3-3-3 corrective swings in each leg. Down from 11171.55 high, the initial decline […]
-
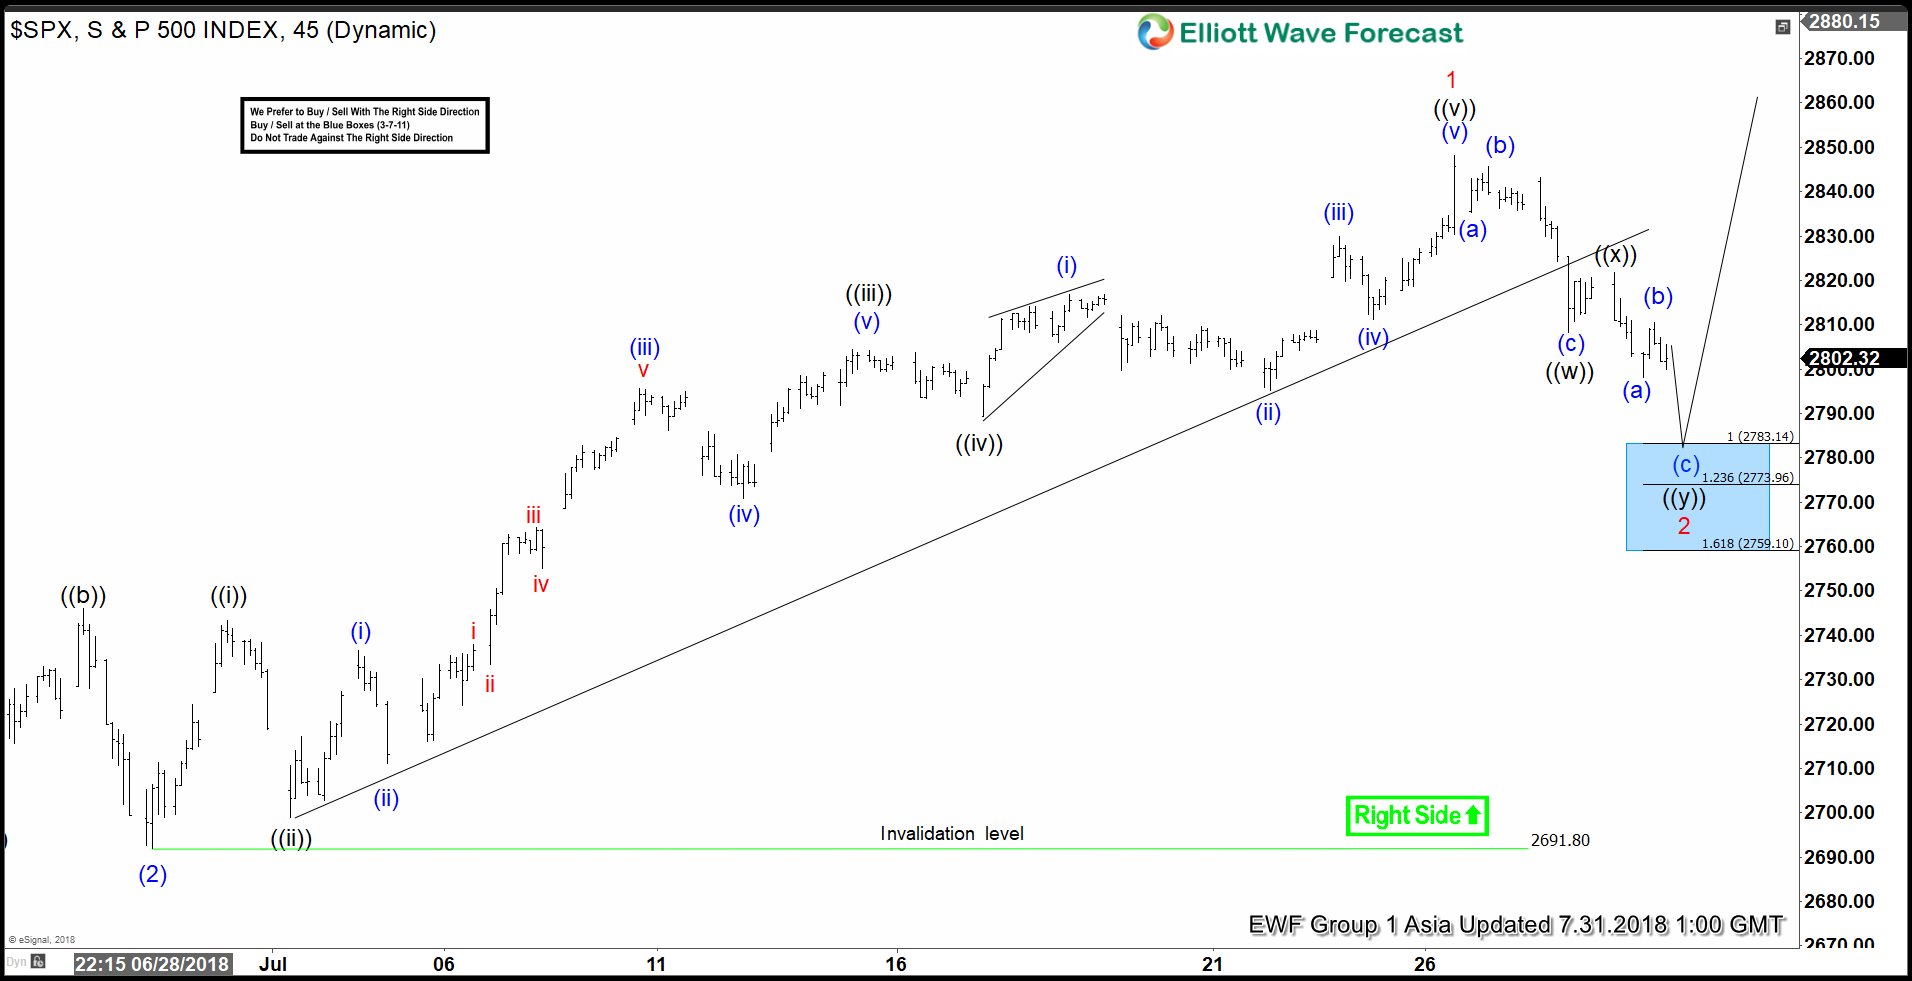
SPX Elliott Wave Analysis: Buying Opportunity Soon
Read MoreSPX Short-term Elliott Wave analysis suggests that the pullback to $2691.80 low on 6.28.2018 ended intermediate wave (2). Above from there, the rally higher to $2848.03 peak ended Minor wave 1. The internals of that rally higher took the form as impulse Elliott wave structure where Minute wave ((i)), ((ii)) & ((iii)) unfolded in 5 waves structure […]
-
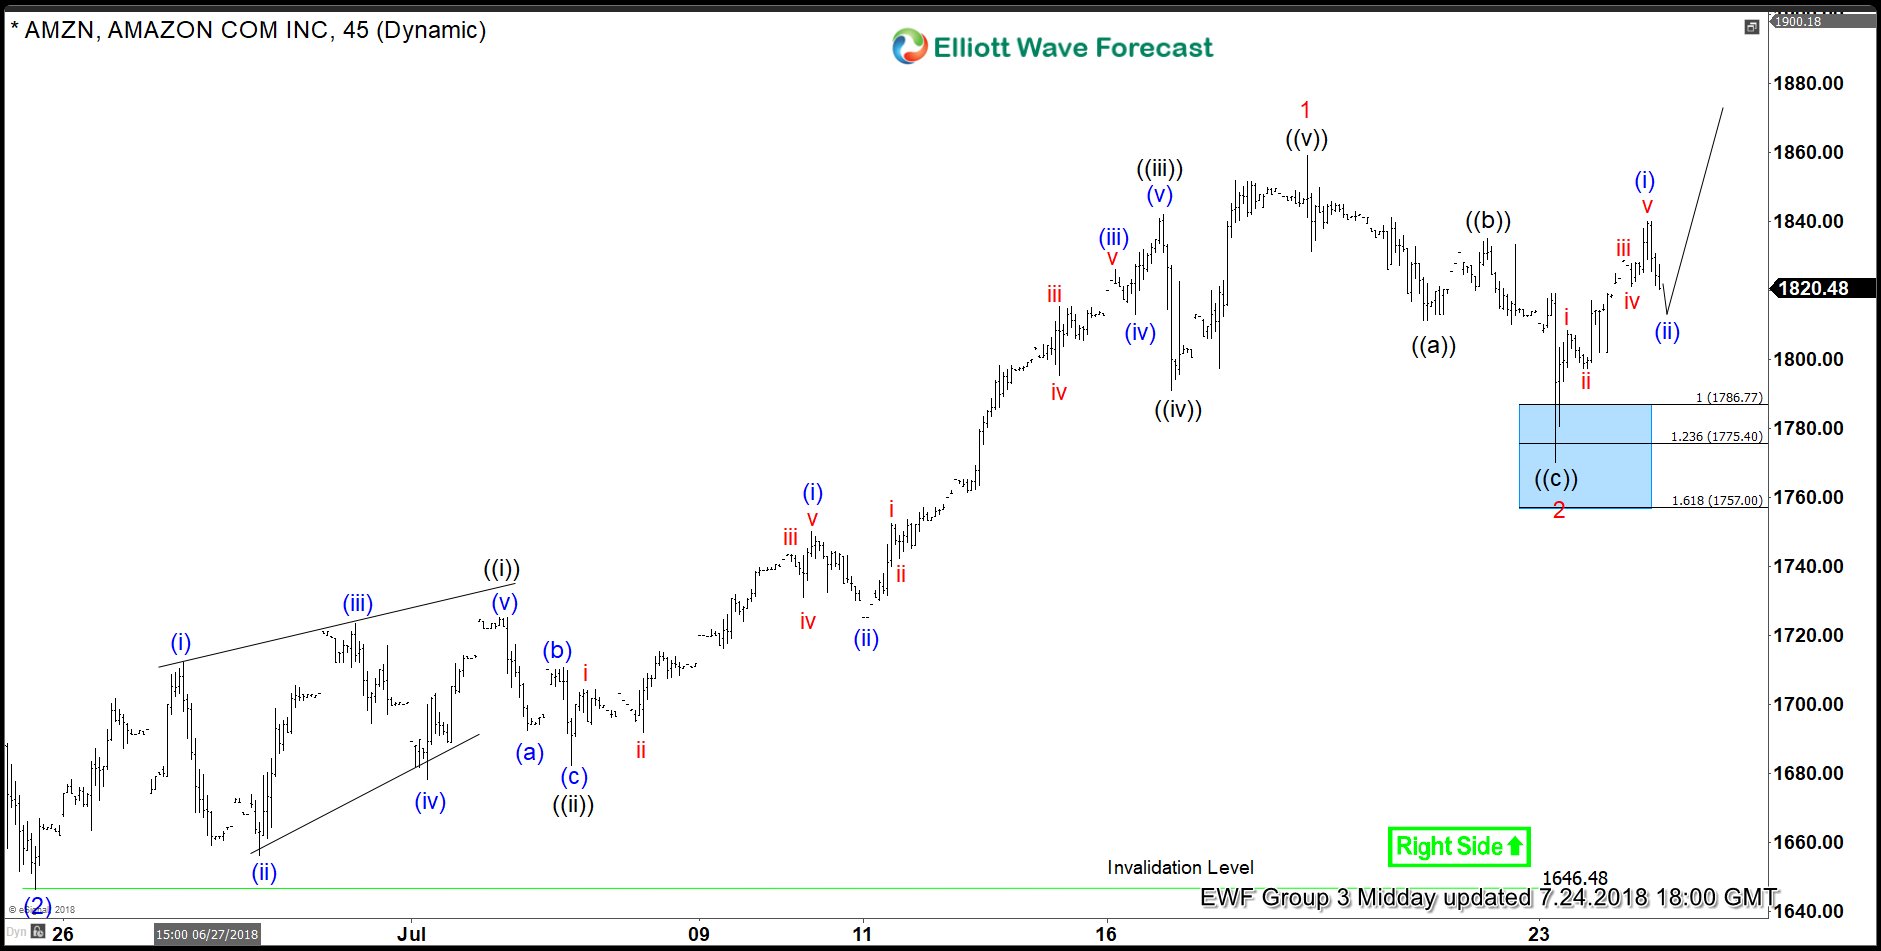
Amazon Elliott Wave Analysis: Forecasting And Buying The Rally
Read MoreIn this blog, I want to share some short-term Elliott Wave charts of Amazon which we presented to our members in the past. Below, you see the 1-hour updated chart presented to our clients on the 07/23/18 indicating that Amazon ended the cycle from 06/25 low in red wave 1. As Amazon ended the cycle from 06/25 […]
-
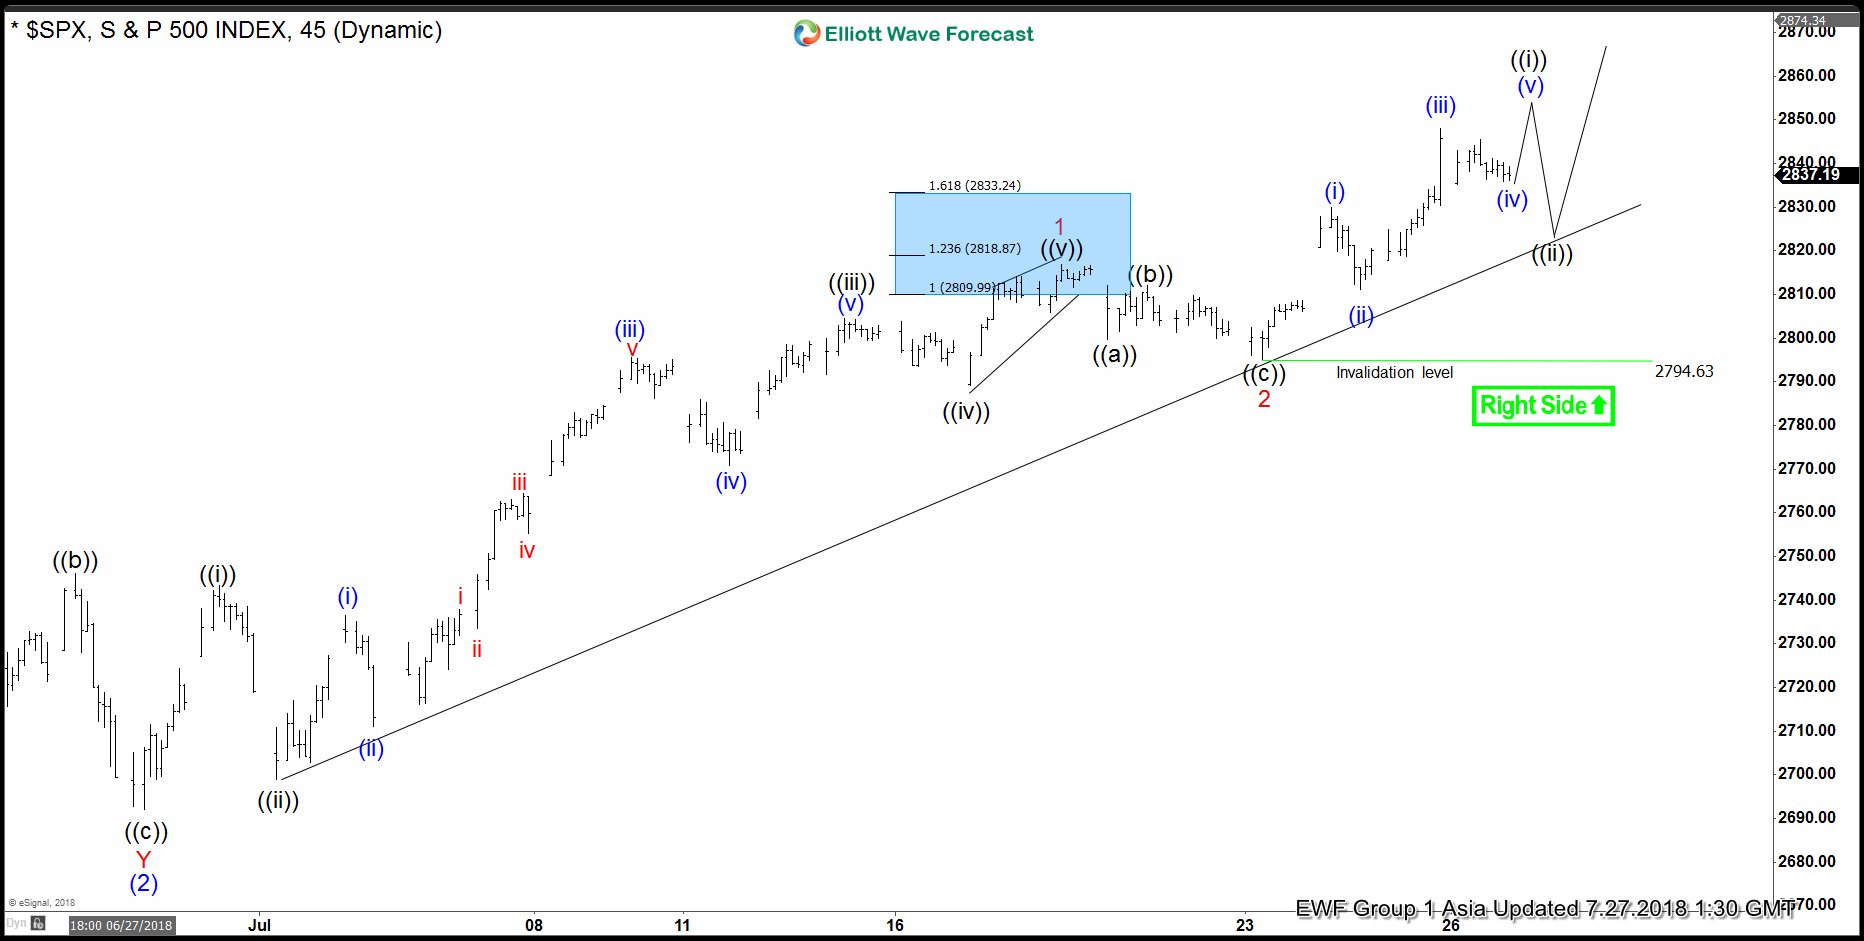
SPX Elliott Wave Analysis: Next Leg Higher May Have Started
Read MoreSPX short-term Elliott Wave analysis suggests that the decline to $2691.99 low ended intermediate wave (2) pullback. Above from there, the rally is taking the form of an impulse Elliott wave structure. The internal subdivision of each leg higher unfolded in 5 waves (i.e Minor wave 1, 3 and 5). On the other hand, Minor wave […]
-
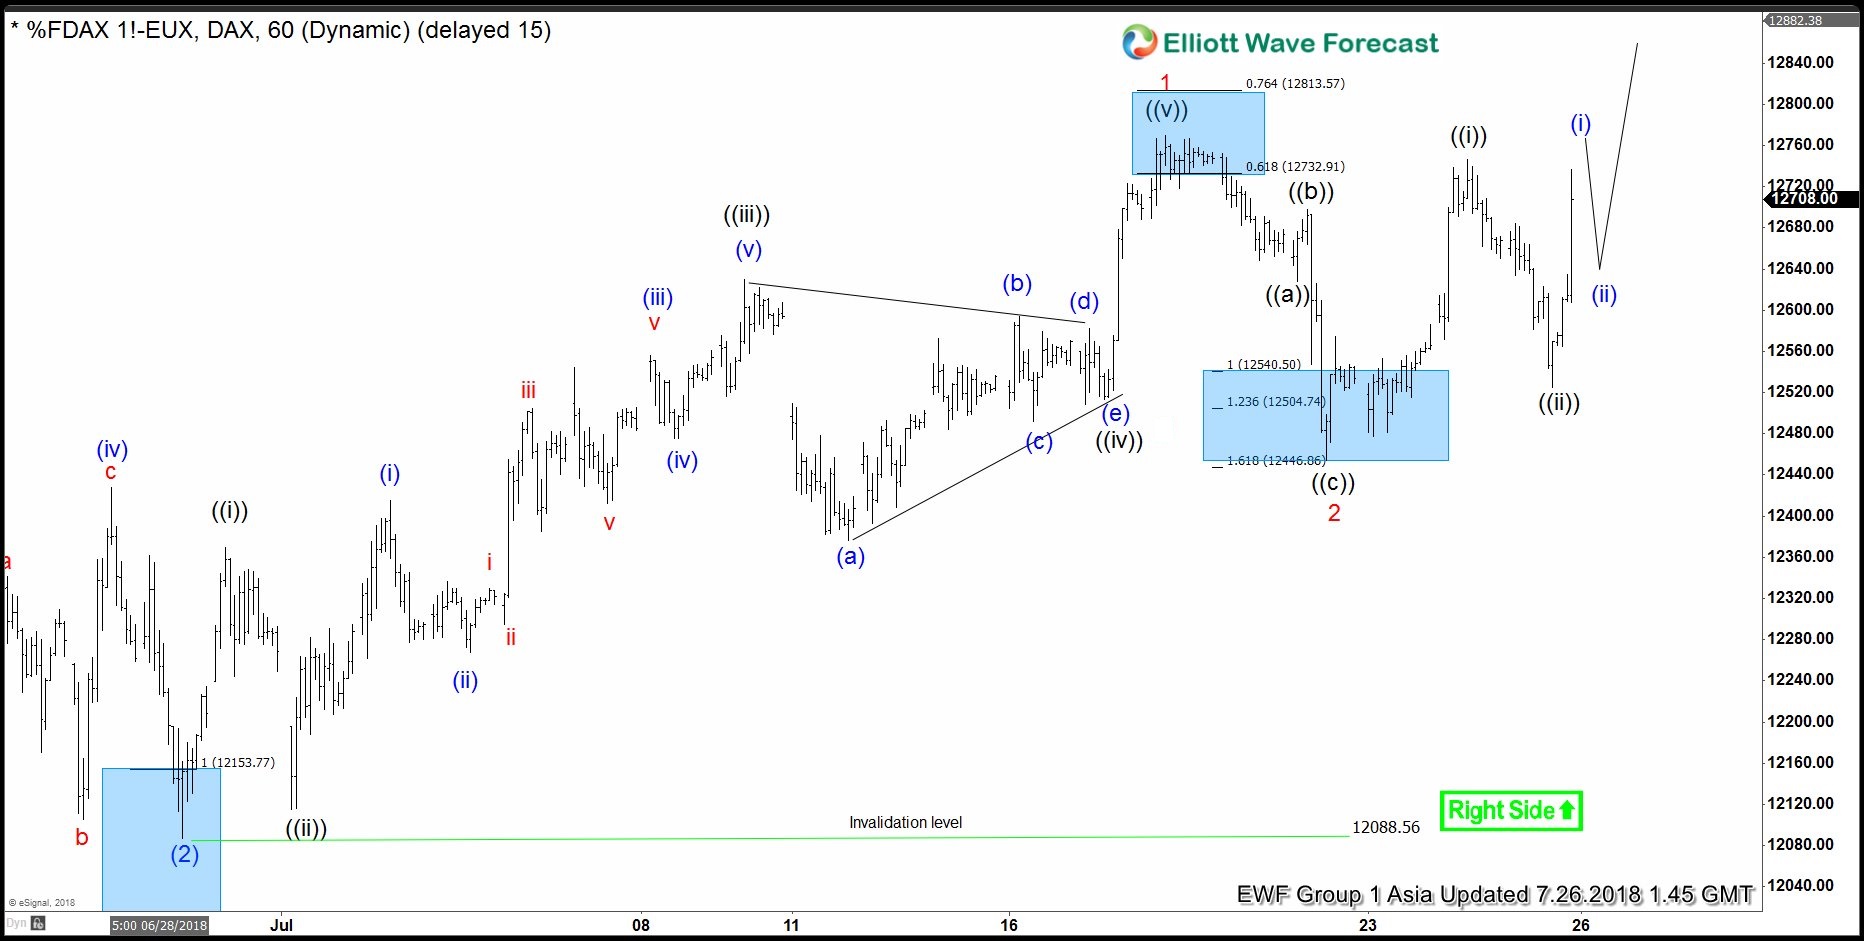
Elliott Wave Analysis: DAX Ready For Rally Higher?
Read MoreDAX short-term Elliott wave analysis suggests that the pullback to 6.28.2018 low ended intermediate wave (2) at 12088.56. Up from there, the rally higher to 12769.8 higher ended Minor wave 1. The internals of that rally higher took place as impulse structure with internal sub-division of 5 wave structure in Minute wave ((i)), ((iii)) & ((v)). […]
-
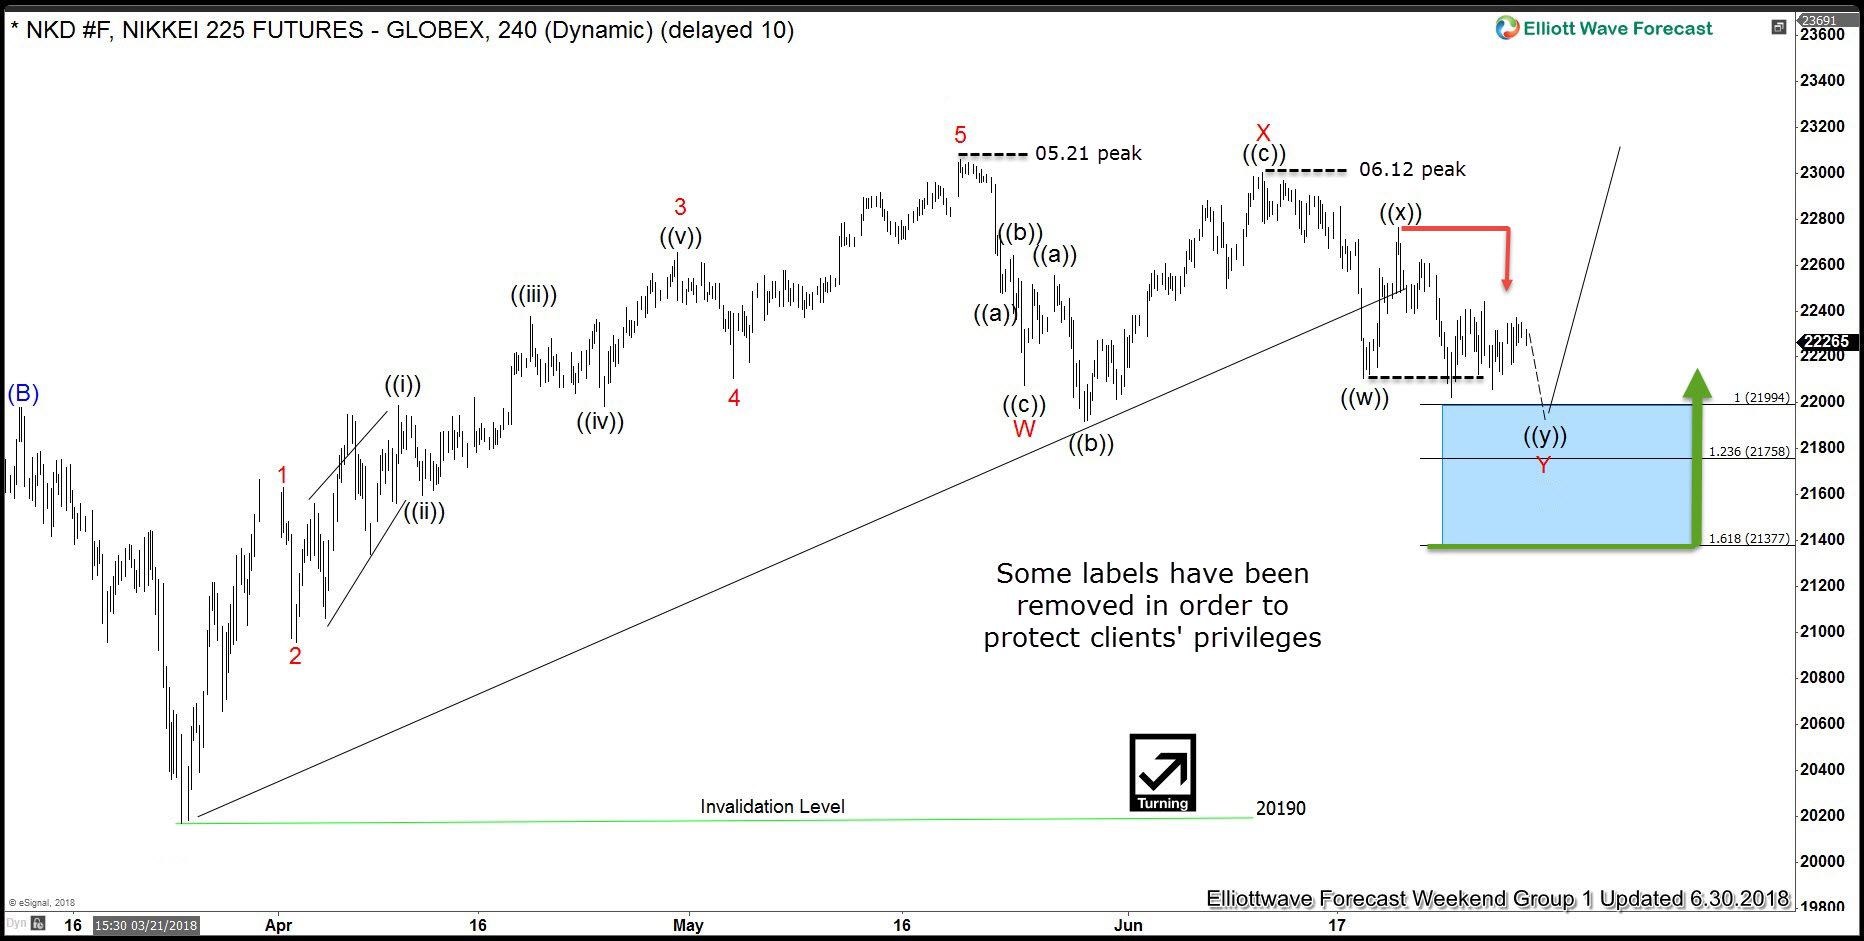
NIKKEI: Elliott Wave Forecasting The Rally
Read MoreHello fellow traders. In this technical blog we’re going to take a quick look at the past Elliott Wave charts of NIKKEI published in members area of the website. As our members know NIKKEI has been correcting the cycle from the 3/26 low (20190). We expected price to reach extreme zone at 21994-21377 to complete […]