
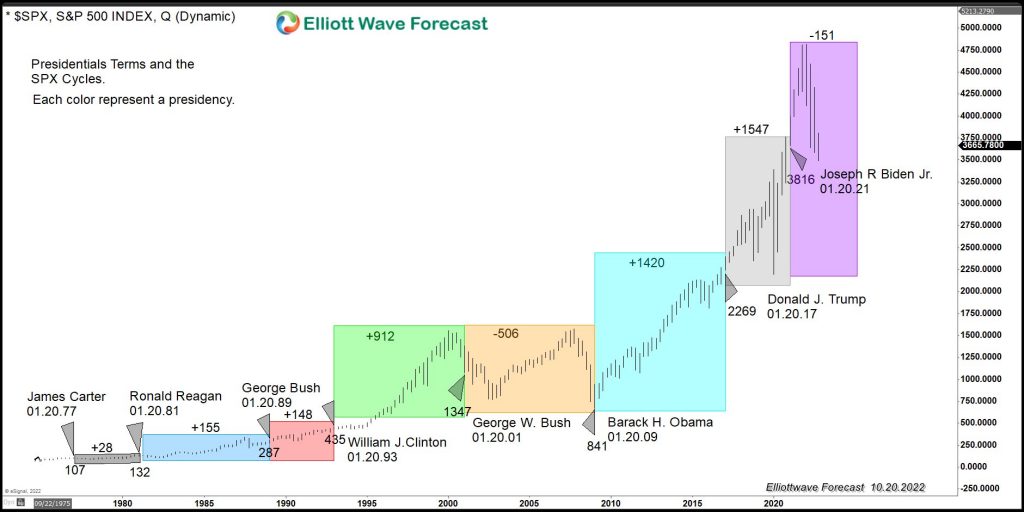
A lot has been said and written about both the Democrat and Republican economic plans for a better economy. We believe in free enterprise and limited regulation, allowing humans to create and expand at their own will for the better but there is a vast difference between the two parties regarding the economic agenda. Most […]
-
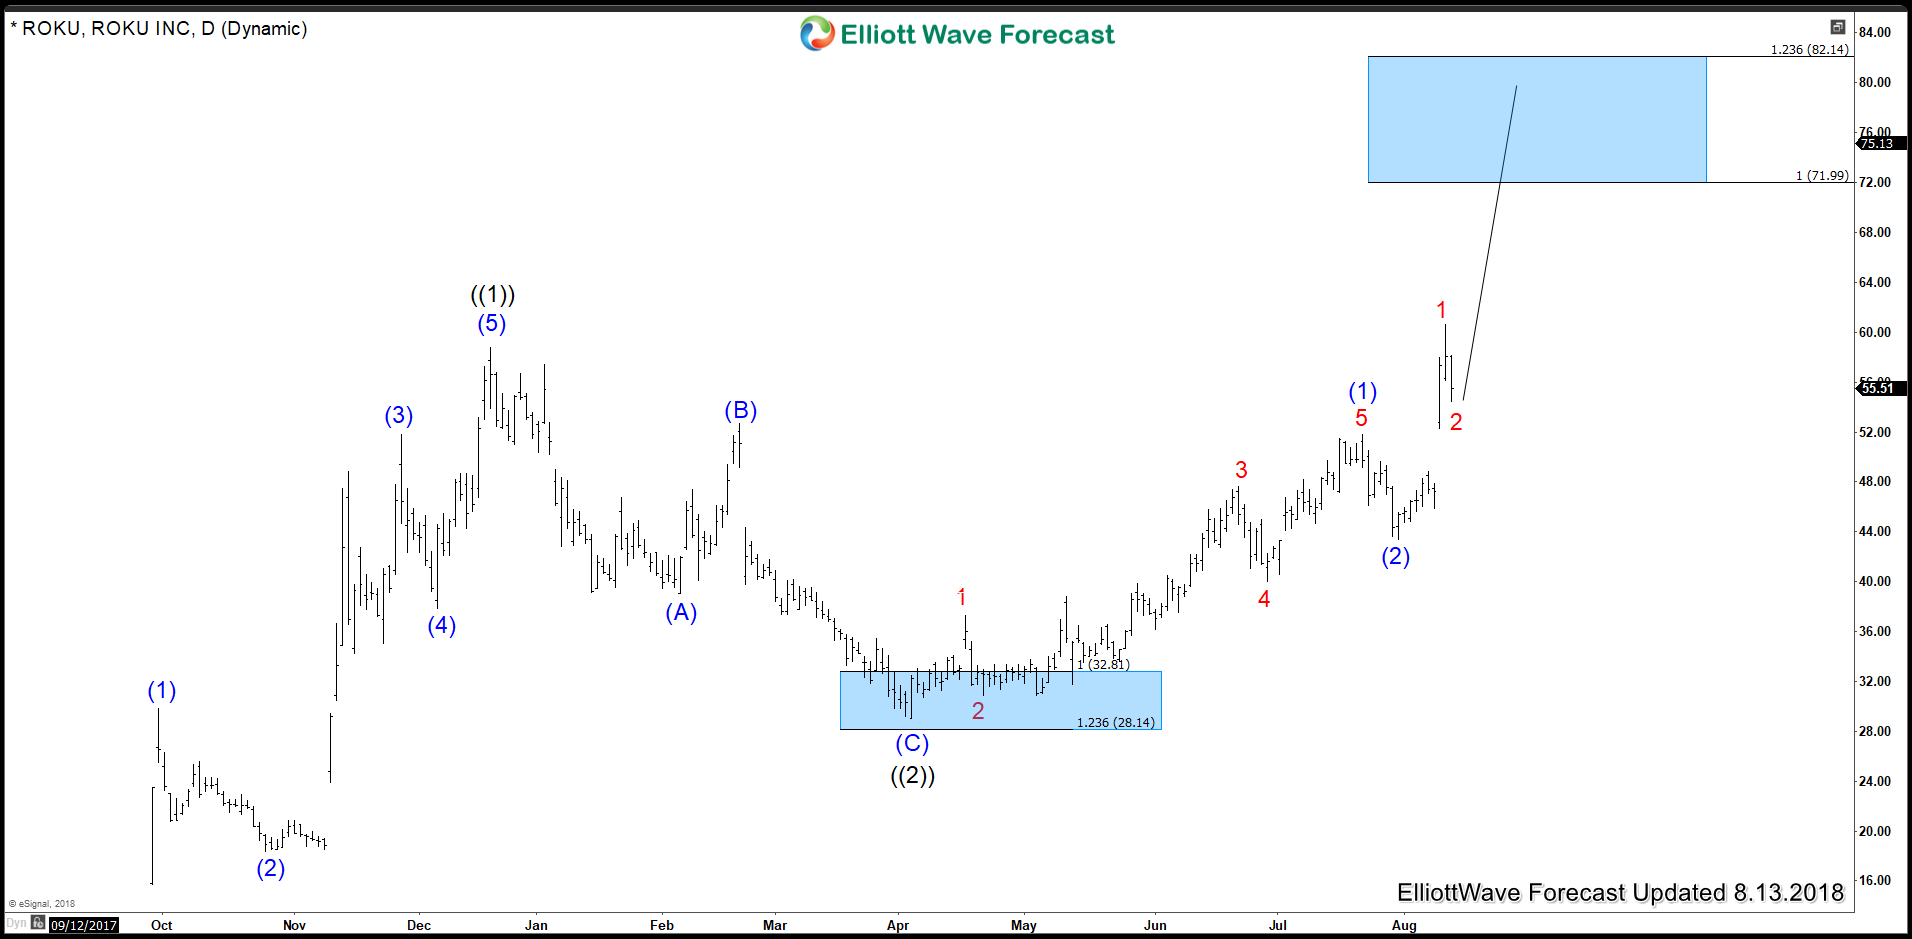

Can ROKU Stock price surpass $100? ElliottWave Forecast Analysis
Read MoreROKU (NASDAQ:ROKU) a streaming TV platform surged last Thursday more than 20% after the company reported better-than-expected second-quarter results. The company currently has 22 million active users but still can’t compete with the giant Netflix (NASDAQ:NFLX) having 130 million subscriber. However, ROKU is taking serious steps to expand and not limit the product to Roku devices. It already […]
-
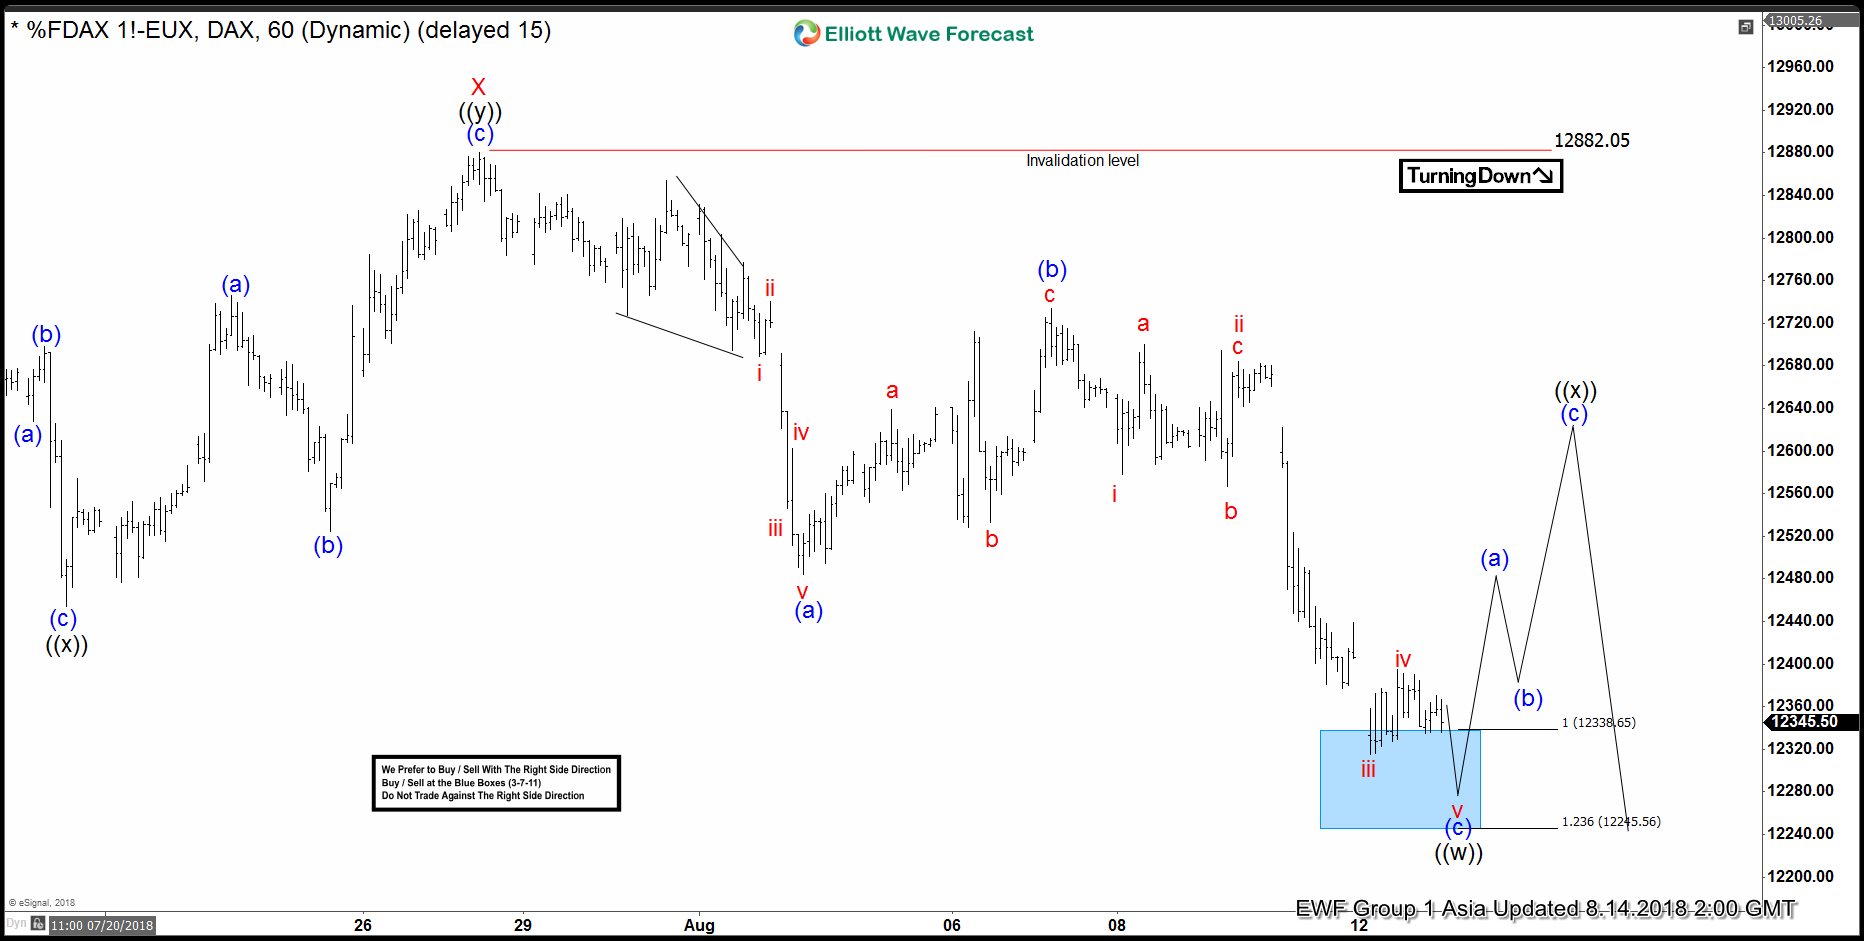
DAX Elliott Wave Analysis: Bounce Can be Temporary
Read MoreDAX short-term Elliott wave analysis suggests that the rally to 12882.05 high ended Minor wave X bounce. The internals of that bounce unfolded as Elliott wave double three structure where Minute wave ((w)) ended at 12640.87. Minute wave ((x)) ended at 12468.68 and Minute wave ((y)) of X ended at 12882.05 high. Down from there, […]
-
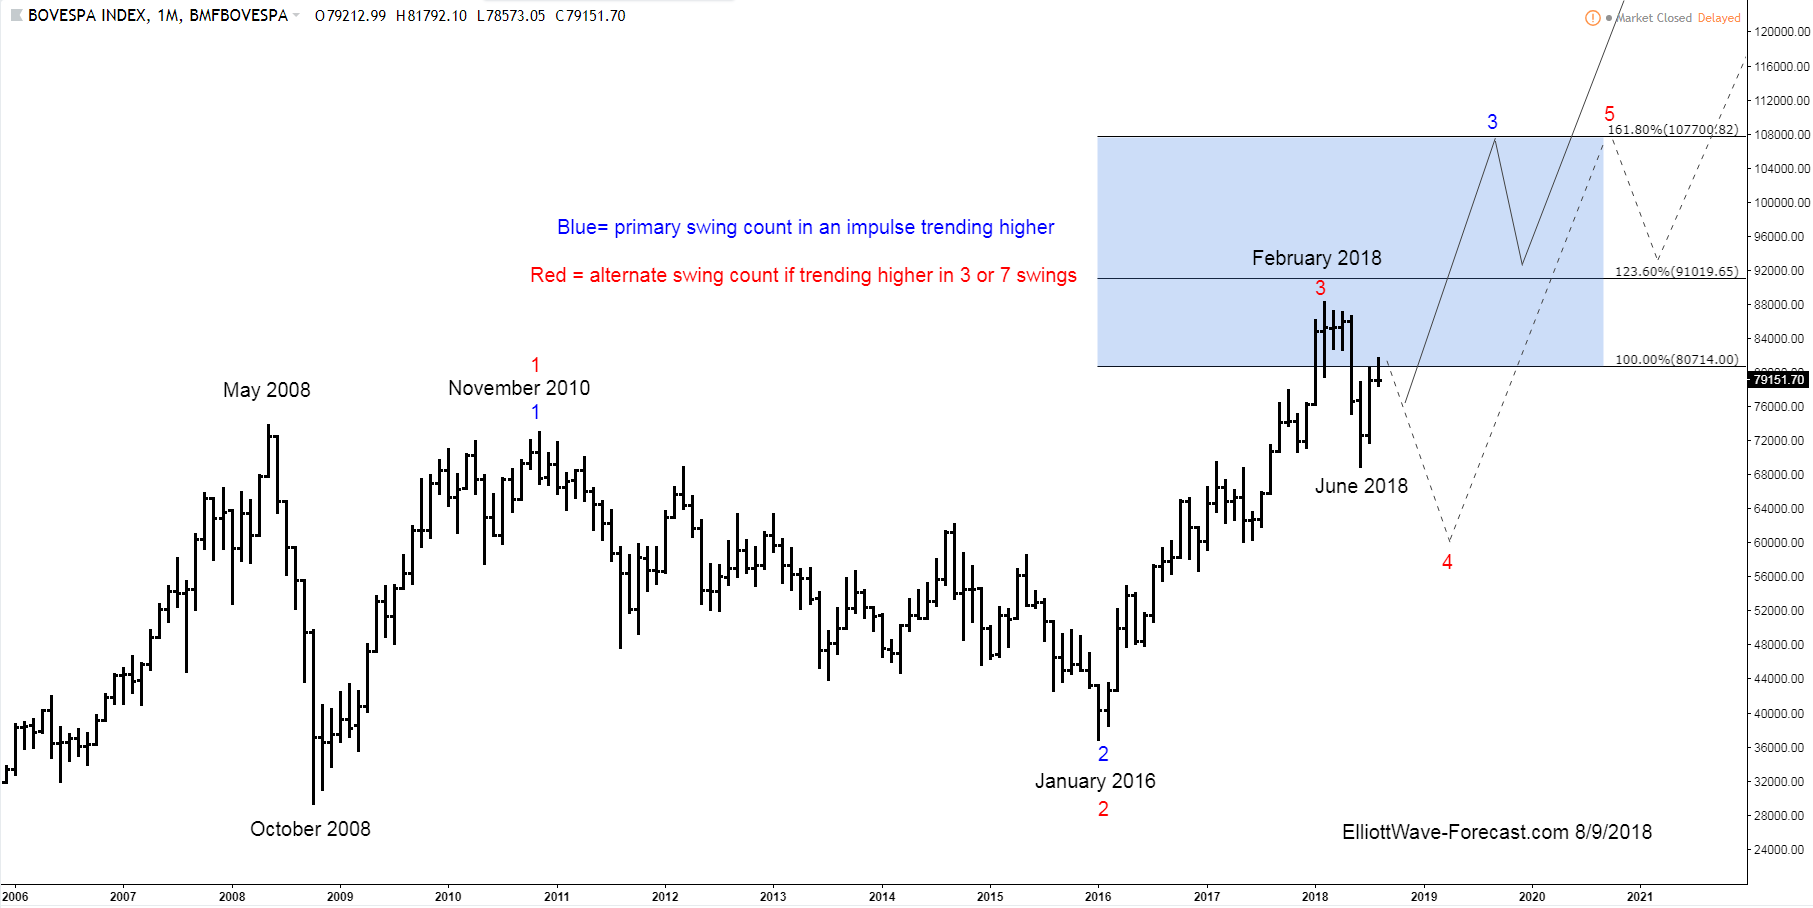
The Bovespa Index Long Term Bullish Trend and Cycles
Read MoreThe Bovespa Index Long Term Bullish Trend and Cycles The Bovespa Index has been trending higher with other world indices. Since inception the cycles have shown a bullish trend. In early years not seen on this chart it rallied with other world indices trending higher into the May 2008 highs. It then corrected the whole bullish cycle […]
-
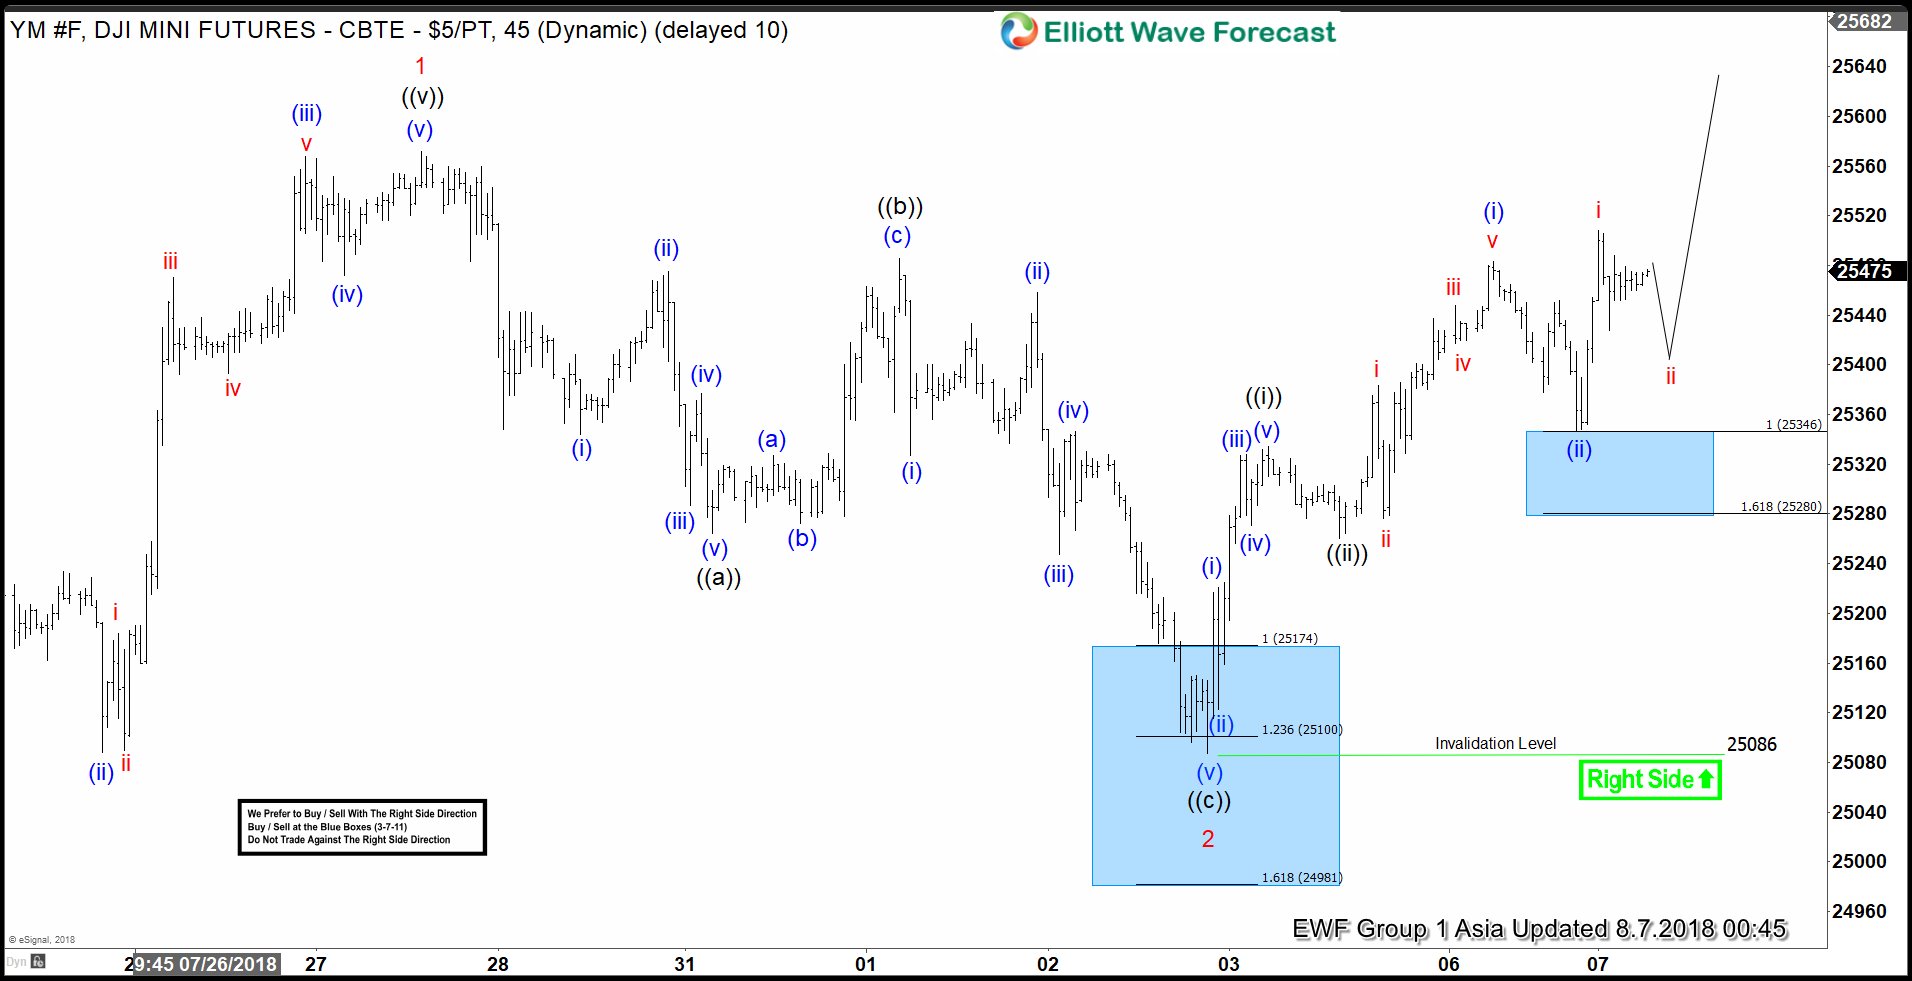
Dow Jones Elliott Wave Analysis: Inflection Area Called The Bounce
Read MoreIn this blog, I want to share some short-term Elliott Wave charts of the Dow Jones Industrial which we presented to our members in the past. Below, you see the 1-hour updated chart presented to our clients on the 08/02/18 indicating that Dow Jones ended the cycle from 07/27 low in red wave 1. As Dow Jones ended the […]
-
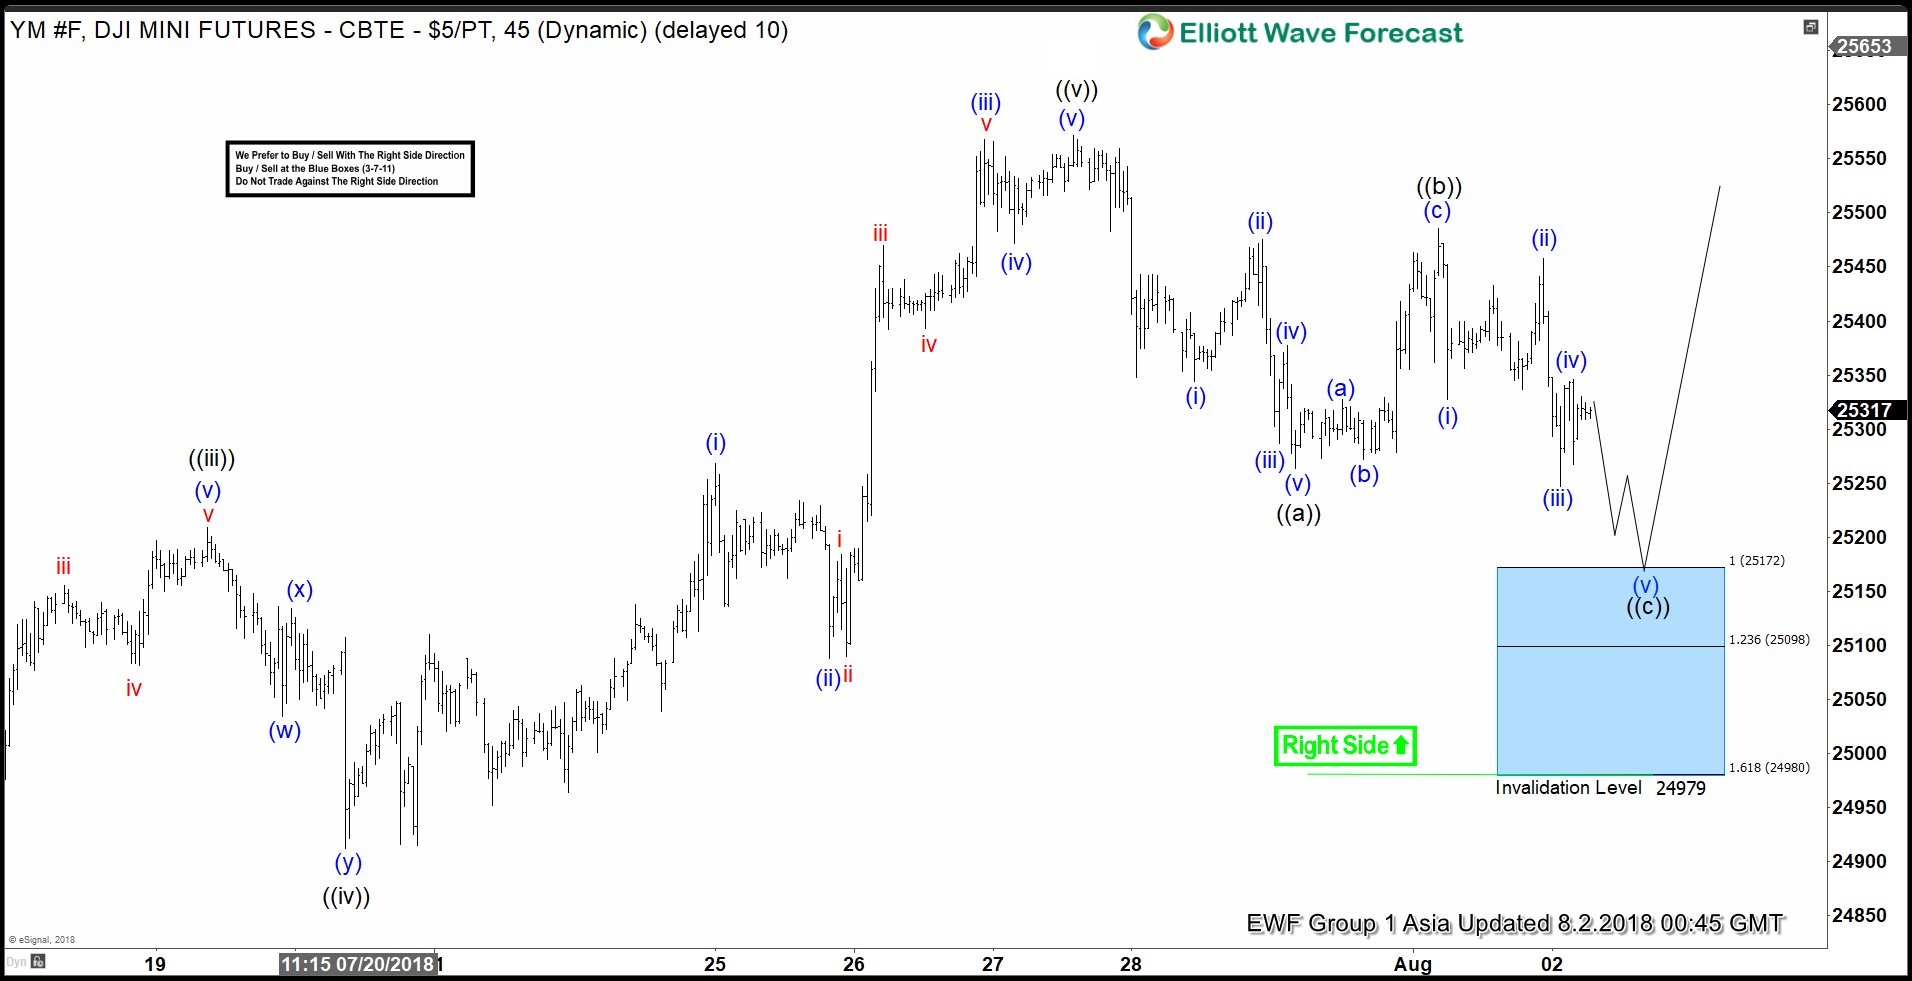
Dow Futures (YM_F) Elliott Wave View: Reacting Higher From Blue box
Read MoreDow Futures ticker symbol: YM_F short-term Elliott wave view suggests that the rally from 6/28/2018 low cycle to 25572 high on 7/27/2018 peak ended Minor wave 1. The internals of that rally higher took place as an impulse structure with sub-division of 5 waves structure in each leg higher. Down from there, the index corrected […]
-
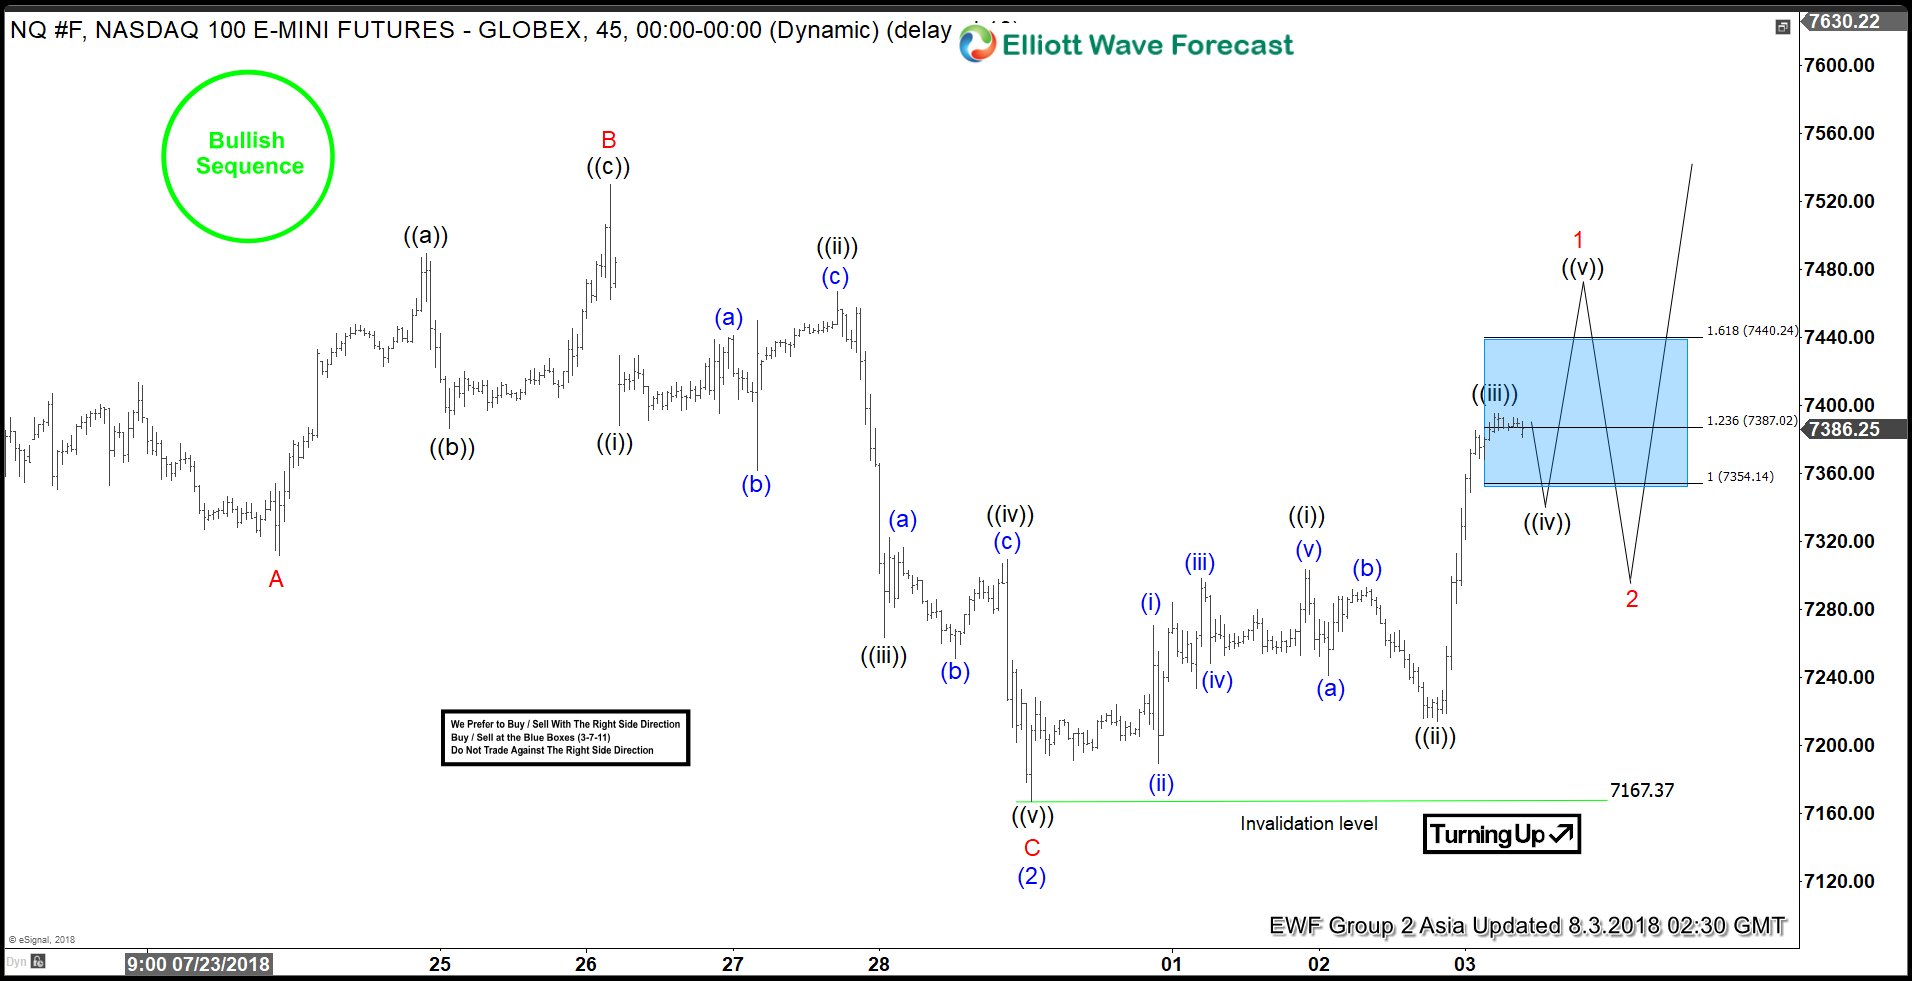
NASDAQ Elliott Wave Analysis: Ready To Rally Higher?
Read MoreNASDAQ futures: ticker symbol NQ_F short-term Elliott wave analysis suggests that the decline to $7167.37 low ended intermediate wave (2) pullback. The internals of that pullback unfolded as Elliott Wave Flat correction where Minor wave A ended at $7311.50 low. Above from there, the bounce to $7530 high ended Minor wave B bounce as Elliott […]