Home Depot (HD), is an American multinational home improvement retail corporation that sells tools, construction products, appliances, and services, including fuel and transportation rentals. Home Depot is the largest home improvement retailer in the United States.
The shares of the Home Depot HD company have entered a very interesting stage. After reaching all-time highs in December 2021, the price fell considerably. According to the Elliott Wave Principle, the stock price should continue to fall. The structure that is developing appears to be a zigzag correction, and if so, it still has a lot of things to say. (If you want to learn more about Elliott Wave Theory, please follow these links: Elliott Wave Education and Elliott Wave Theory).
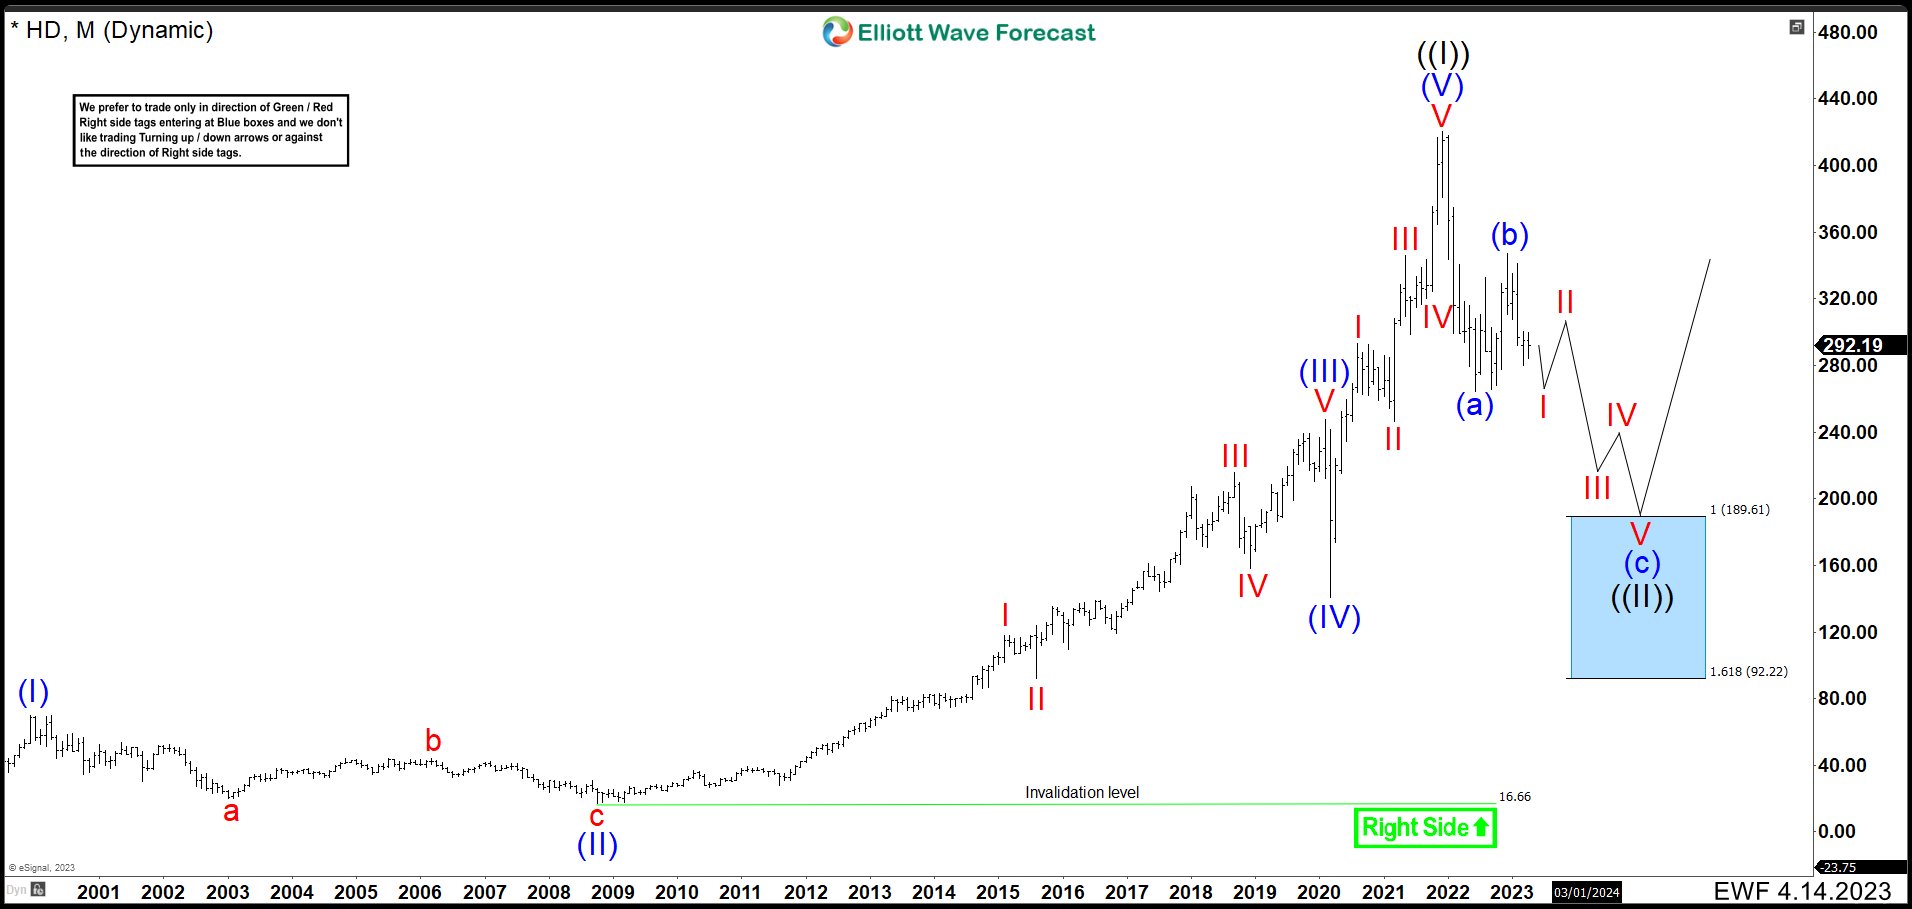
Home Depot HD Monthly Chart April 2023

As we can see above on the monthly chart, HD finished its first grand cycle since the company’s inception in late 1999, reaching $70.08. We called this movement the wave (I). At this price, it entered in a corrective phase that ended in 2008 recession at $16.66. We labeled it as wave (II). Since then, the price kept a strong bullish trend, rising as high as $247.70 to complete wave (III). Then, we clearly see the wave (IV) at the beginning of the COVID19 pandemic, in 2020, when the price fell to $139.84. From here, it had again a strong rebound creating a new impulse, being wave IV as triangle, thus wave V is the shortest of the impulse. This completed wave (V) at $420.79 and wave ((I)) of the grand super cycle in December 2021.
The Correction Started in December 2021
Since 2021 high, the price of HD has remained bearish and to complete the corrective structure it should continue to decline further. This is because, to finish a corrective structure is needed a minimum of 3 waves where the third wave must break the end of the first wave at least marginally. Suggesting further drops in HD price which it should ideally hit the blue box. This is in $189.61 – $92.22 area. If we see 5 waves down from wave (b) in this area, this is a good opportunity to look for longer-term buys. However, it is not 100% certain that HD will go as low as $189.61. If 5 waves marginally breaks the low of wave (a) at $263.85, wave (c) of ((II)) and wave ((II)) could be over to continue a new rally.
Wave (V) Impulse
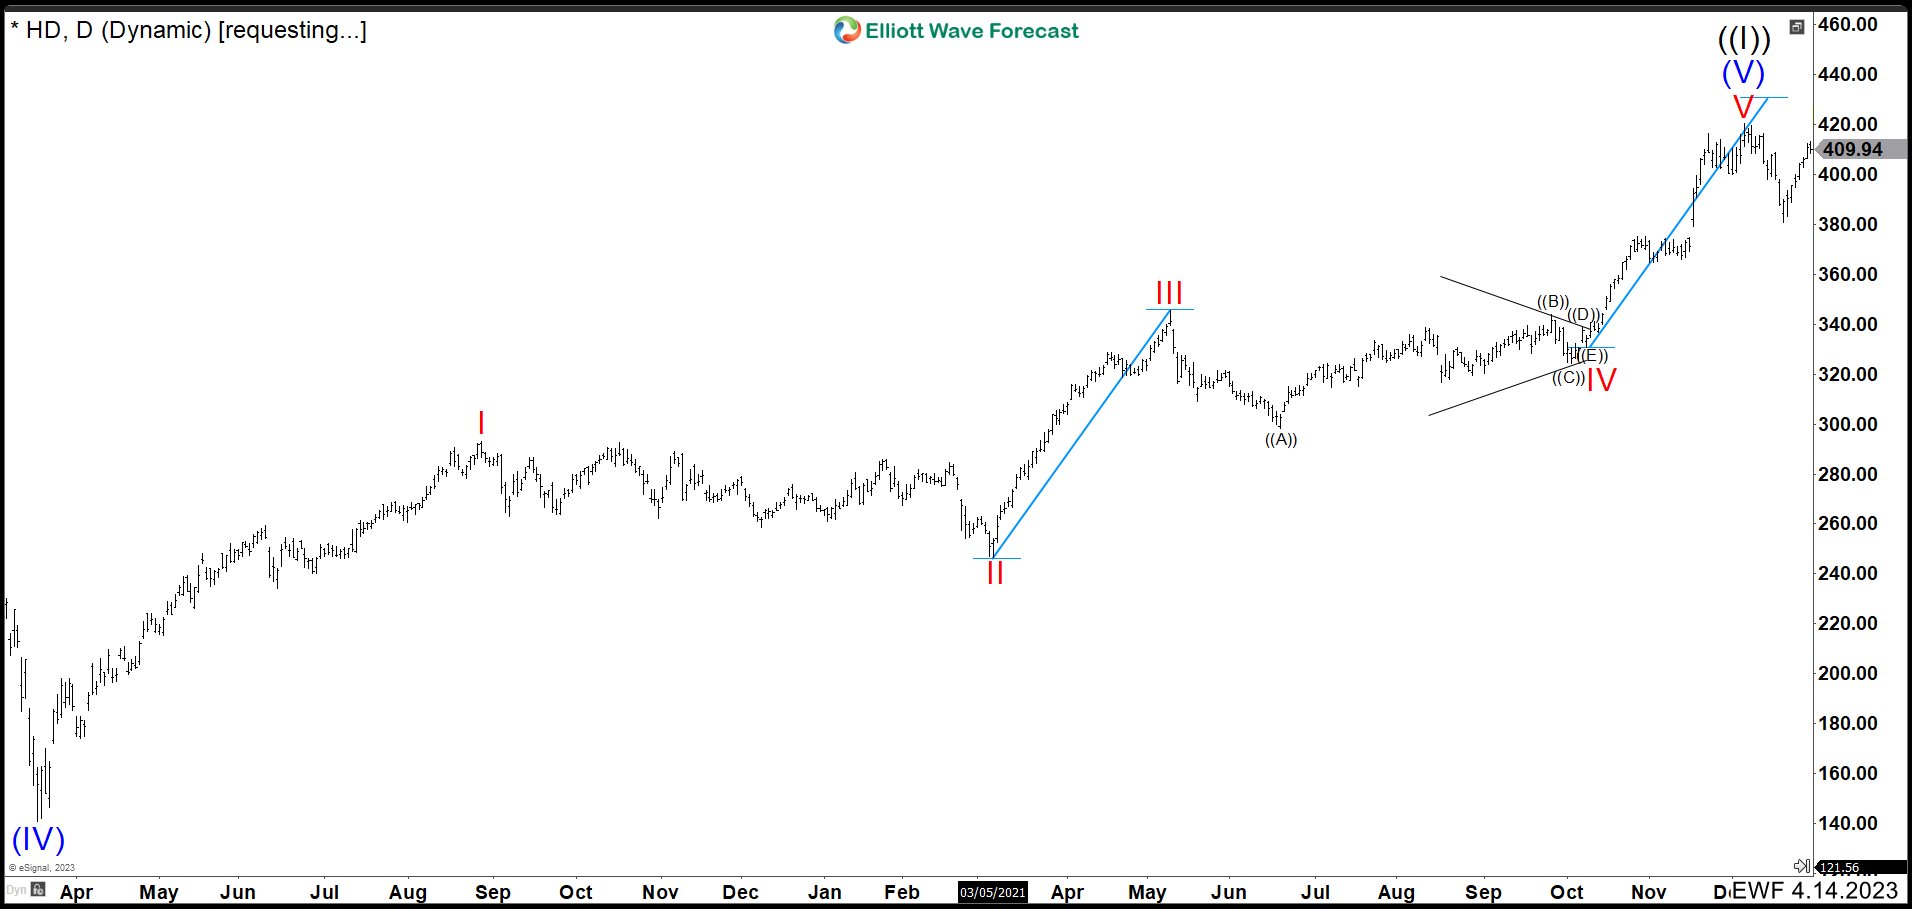
If there is some confusion about how we labeled wave (V) in HD because the chart above is a montly one, we are sharing the count of wave (V) in daily chart.
We can see the chart above, how wave IV built a triangle ending wave ((E)) of IV at 330.88 low. Then we compare the wave lengh of wave III and wave V. The blue line of wave III is longer than the wave V lengh, fulfilling the rules of an impulse without a problem.
Taking 14 Days Trial
Elliottwave Forecast updates one-hour charts 4 times a day and 4-hour charts once a day for all our 78 instruments (Stocks, ETFs, Indices, Commodities, Forex, Cryptos). We do a daily live session where we guide our clients on the right side of the market. In addition, we have a chat room where our moderators will help you with any questions you have about what is happening in the market.
Let’s trial 14 days for only $9.99 here: I want 14 days trial. Cancel Any time at support@elliottwave-forecast.com
Back

