Hello, fellow traders. In this technical blog, we’ll take a closer look at our Elliott Wave charts for the EUROSTOXX (SX5E), published in the members’ area of our website. We identified incomplete bearish sequences within the cycle from the August 12 peak, calling for further downside. In the following analysis, we’ll review the Elliott Wave structure and see how the market followed our outlook.
EUROSTOXX Elliott Wave 1-Hour Chart 10.06.2026
The break below the August 15 low, marked as (w) blue, confirmed the incomplete bearish sequences within the cycle from the August 12 peak at 6577. These types of price structures are very important, because incomplete swing structures can help us anticipate the market’s next move with greater accuracy.
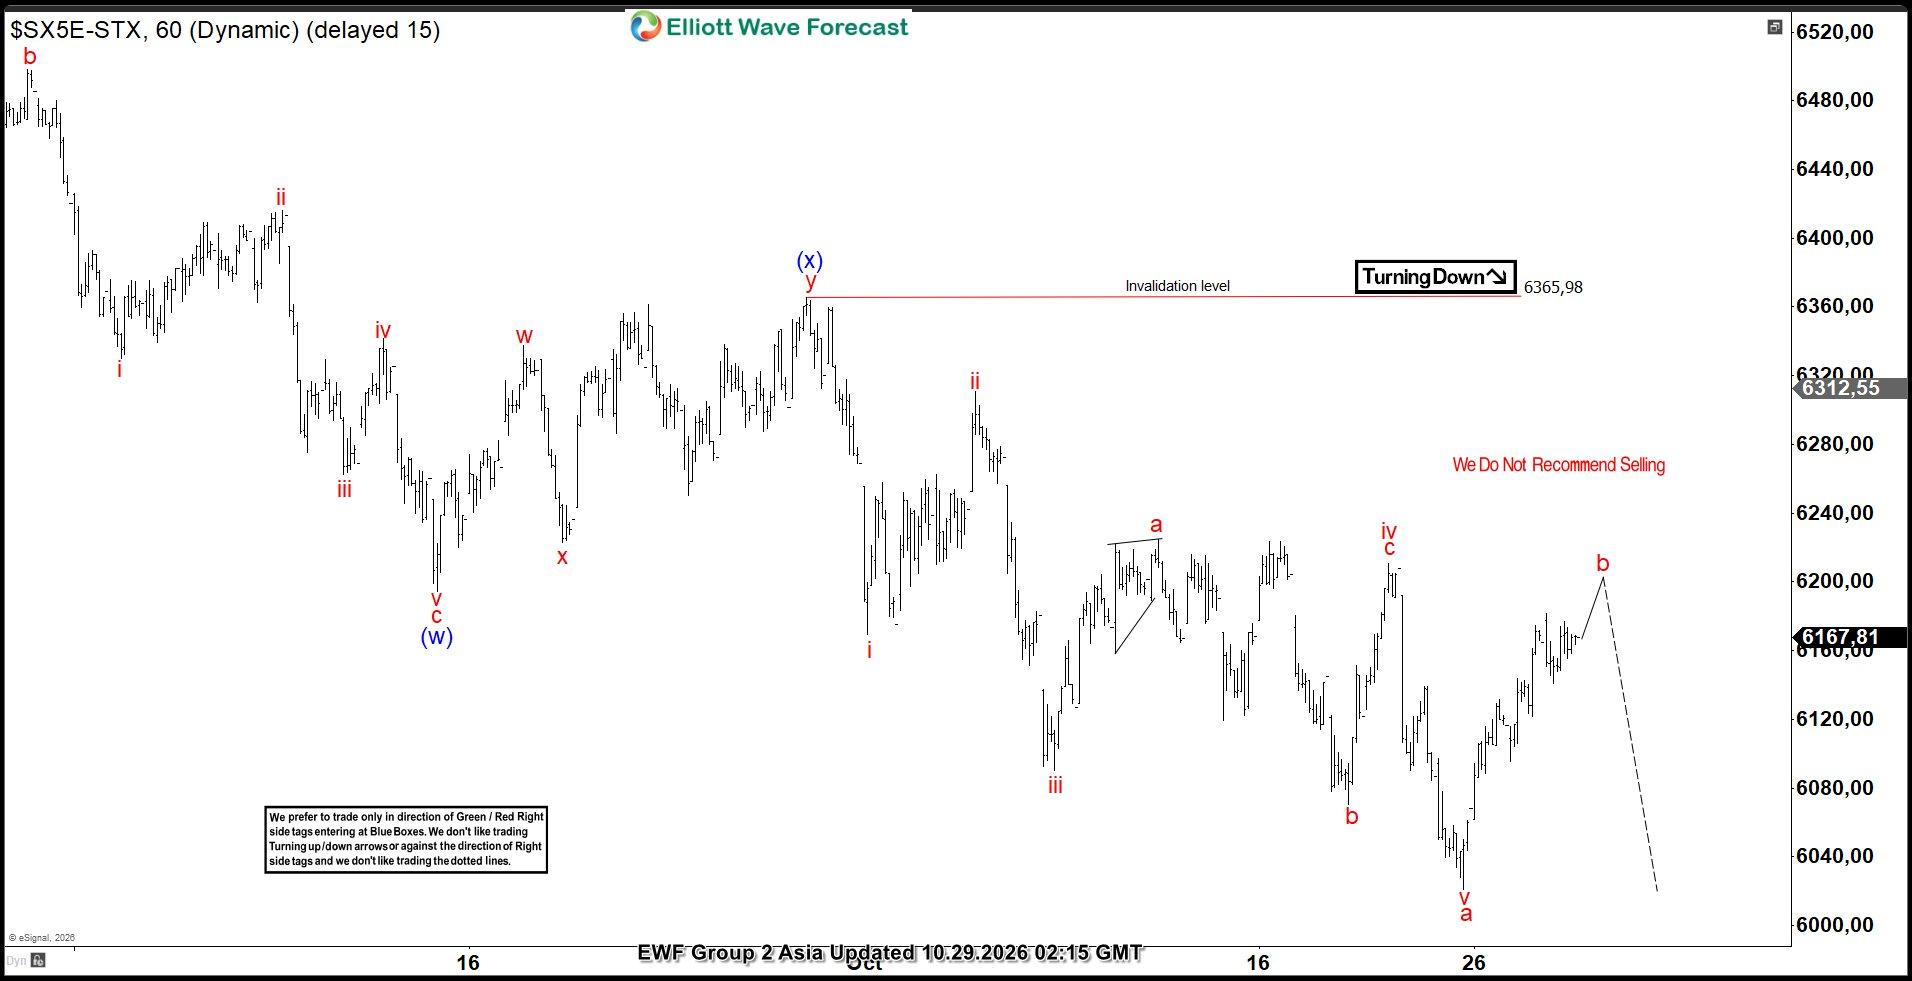
The current view suggests further short-term weakness in the coming days. The index remains bearish against the 6365.57 peak, marked as (x) blue on the chart. As long as the price stays below this level, we expect further downside.
The cycle is forming an Elliott Wave Double Three pattern. Therefore, we identify the potential downside target by measuring the (w)-(x) Equal Legs area using the Fibonacci Extension tool. In this case, the Equal Legs target zone comes at 5979–5743.
You can learn more about Elliott Wave Patterns at our Free Elliott Wave Educational Web Page

EUROSTOXX Elliott Wave 1-Hour Chart 10.29.2026
The index has continued to trade lower, as expected. However, the Equal Legs target area has not yet been reached. The primary view suggests that another leg down remains possible toward the previously mentioned target zone of 5979–5743. Alternatively, a break of the 6365.98 pivot would suggest that the cycle has already completed as a truncation.
Important note: Keep in mind that the market is dynamic, and the outlook may have changed in the meantime. Our member Chat Rooms are open 24 hours a day, Monday through Friday, on trading days, providing ongoing expert guidance on market trends and Elliott Wave analysis. Members can ask questions about market structure and technical setups at any time during trading days.
Elliott Wave Forecast Membership
Trade with a clear plan. Trade with confidence.
Our team of professional analysts monitors 78 instruments across global markets every trading day, helping members identify high-probability setups, define risk before entering, and manage positions with a structured, rules-based approach.
Inside your membership, you’ll receive:
- Real-Time Trading Recommendations — clearly defined Entry, Stop Loss, and Take Profit levels for every setup.
- Live Trading Room Access — follow professional setups and trade management as they develop in real time.
- 24-Hour Analyst Support — ask unlimited questions and get expert guidance throughout the trading week.
- Expert Multi-Market Analysis — covering Forex, Stocks, Indices, ETFs, Commodities, and Cryptocurrencies.
- Education Built Into Every Setup — learn how experienced analysts identify opportunities, define risk, and manage positions. Exclusive educational videos are included at no additional cost.
Stop reacting after the market moves. Start preparing before it does.
See the setups our analysts are watching, follow the market in real time, and learn the strategy behind each trade.
Your membership starts with just a few clicks.
Regular 14-Day Trial: $9.99
Limited-Time Price: Only $0.99
👉 Start Your 14-Day Trial for Only $0.99