

Hello fellow traders. In this technical blog we’re going to take a quick look at the charts of CHFJPY published in members area of the website. As our members know CHFJPY has ended 5 waves down from the 112.212 peak. Now, the pair is giving us recovery against the mentioned high and we can see more short term strength. The recovery against the 112.212 peak looks incomplete at the moment and we can get at least another leg up toward 109.95-11.23. In the charts below, we’re going to explain the Elliott Wave Structure and the forecast.
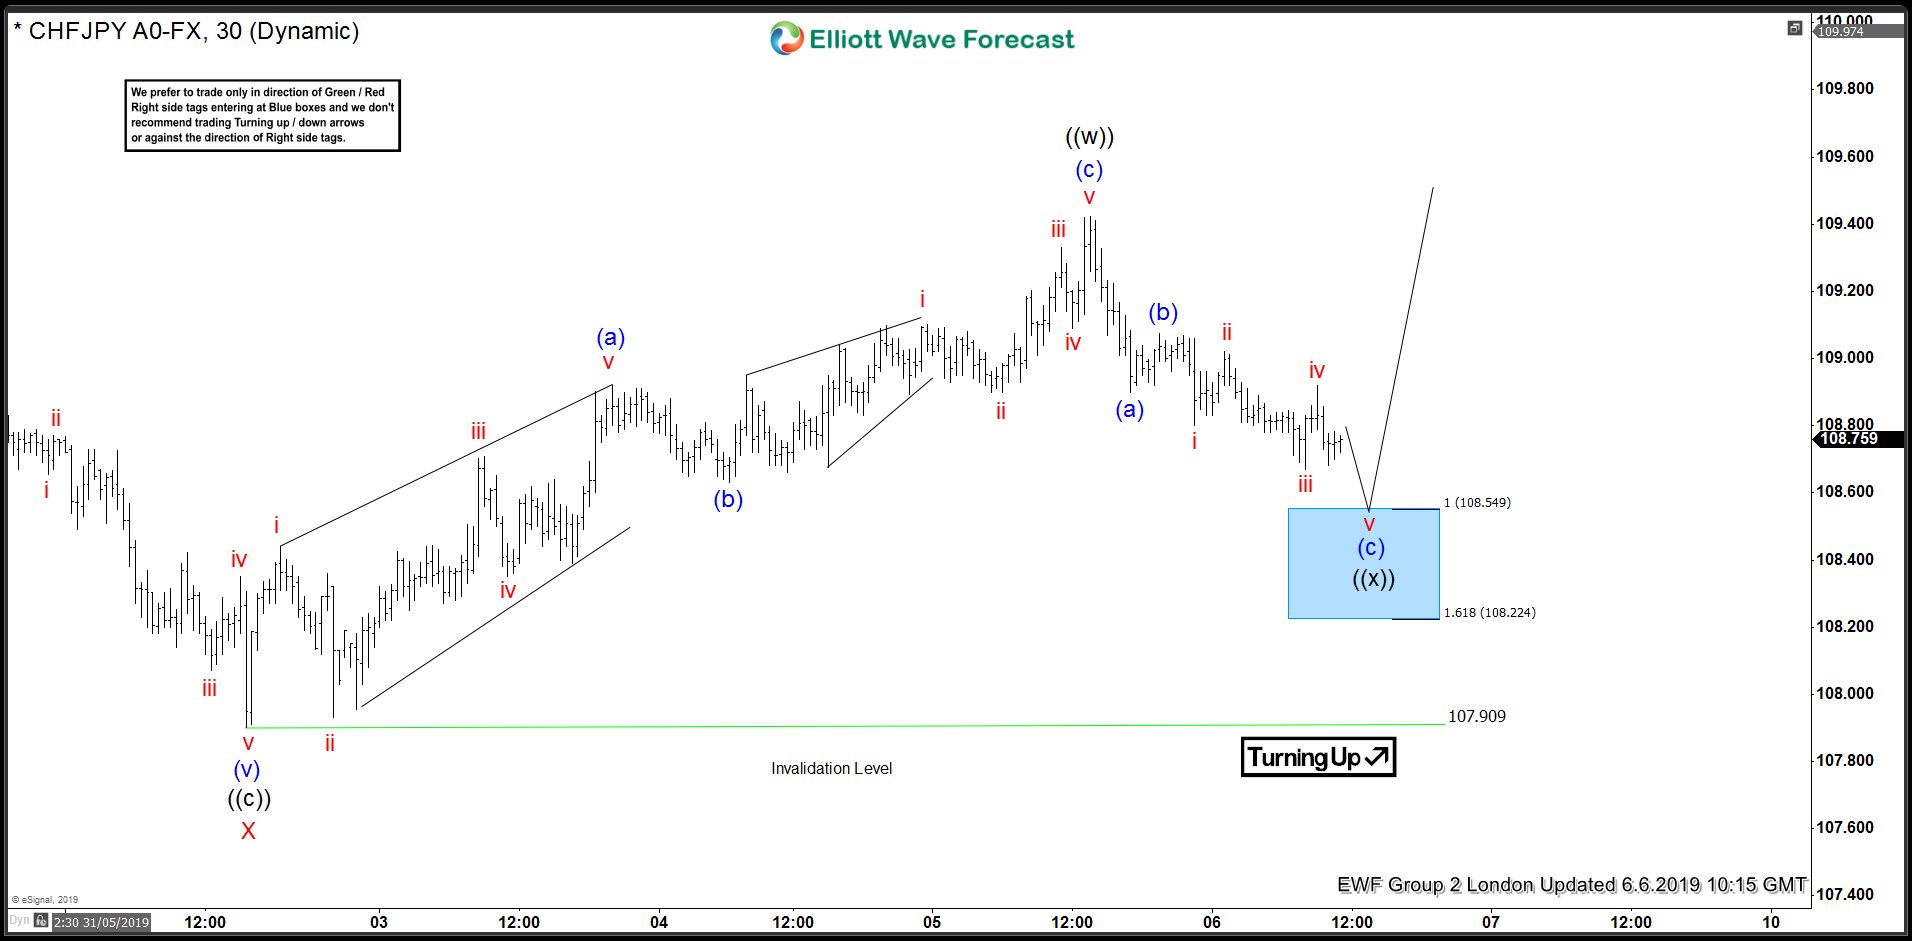
CHFJPY Elliott Wave Chart 6.6.2019
Current view suggests the pair is doing short term pull back against the 107.9 low. As of right now ((x)) pull back looks incomplete. Pull back is unfolding as Zig Zag, when we are in (c) leg that is missing another 5th wave at the moment. So, we are calling for another term low toward (a)-(b) equal legs area that comes at 108.54 -108.22 ( marked blue box) . We expect buyers to appear for proposed rally toward new highs. We don’t recommend selling the pair.
Note: Turning Black arrows shows the highest path but highest probability path is not the same as highest probability trade which is why we focus on green / red right side tags or bullish / bearish sequence combined with blue boxes to trade.
You can learn more about ZIG ZAG Elliott Wave Patterns at our Free Elliott Wave Educational Web Page.
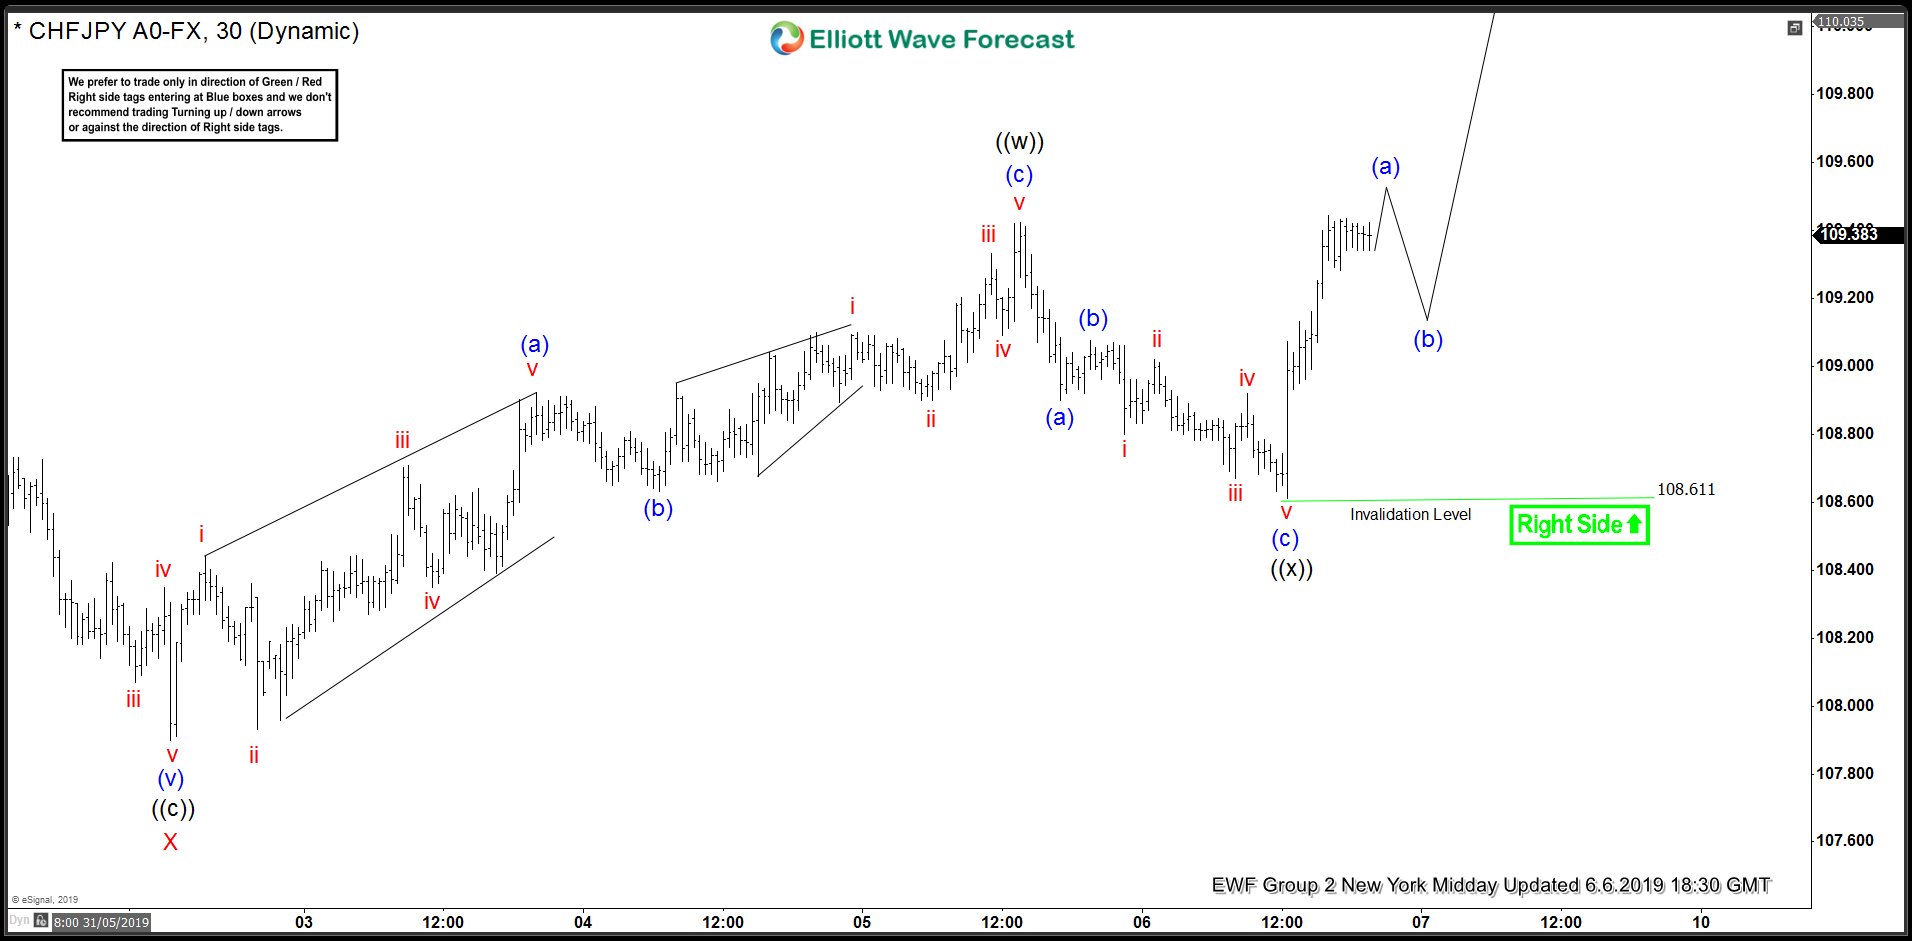
CHFJPY Elliott Wave Chart 6.6.2019
We got proposed leg down : wave v of (c) however buyers appeared early. Proposed technical area is missed by a few points and we got rally. ((x)) pull back is counted completed at the 108.61 low. The pair has made break above last peak ((w)) black, confirming next leg up is in progress. CHFJPY is now bullish against the 108.61 low and we expect wave (b) pull back to happen before rally resumes.
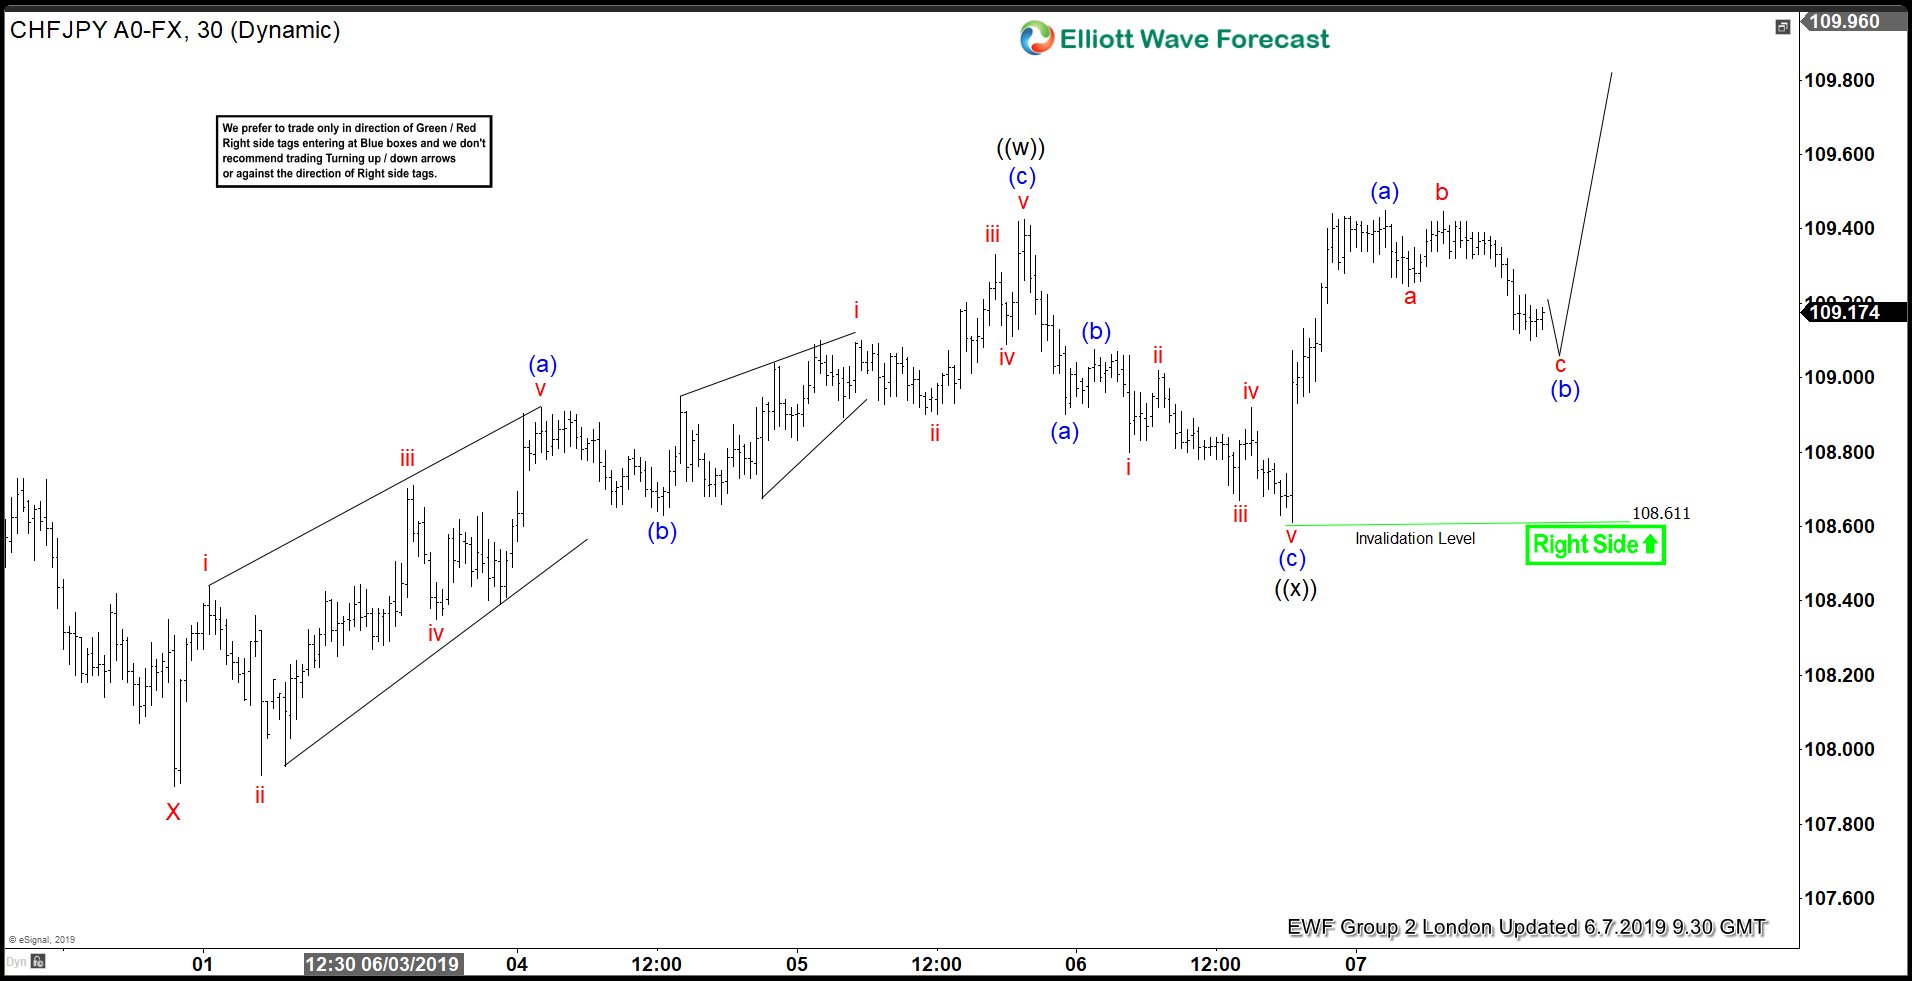
CHFJPY Elliott Wave Chart 6.7.2019
We got short term pull back against the 108.61 low. The price is about to complete 3 waves from the peak, and we could be ending wave (b) any moment.
Keep in mind that market is dynamic and presented view could have changed in the mean time. Best instruments to trade are those having incomplete bullish or bearish swings sequences. We put them in Sequence Report and best among them are shown in the Live Trading Room. You can check most recent charts in the membership area of the site.
Elliott Wave Forecast Membership
Trade with a clear plan—not guesswork.
Our team of professional analysts monitors 78 instruments across global markets every day, helping members identify high-probability setups, define risk before entering, and manage positions through a structured, rules-based process.
Inside your membership, you’ll receive:
✅ Real-Time Trading Recommendations — clearly defined Entry, Stop Loss, and Take Profit levels for every setup.
✅ Live Trading Room Access — follow professional setups and trade management as they develop in real time.
✅ 24-Hour Analyst Support — ask unlimited questions and receive guidance throughout the trading week.
✅ Expert Multi-Market Analysis — covering Forex, Stocks, Indices, ETFs, Commodities, and Cryptocurrencies.
✅ Education Built Into Every Setup — learn how experienced analysts identify opportunities, define risk, and manage positions, with exclusive educational videos included at no additional cost.
Stop reacting after the market moves. Start preparing before it does.
Your complete membership access is only a few clicks away.
Regular 14-Day Trial: $9.99
Limited-Time Price: Only $0.99
👉 Start Your 14-Day Trial for Only $0.99



