
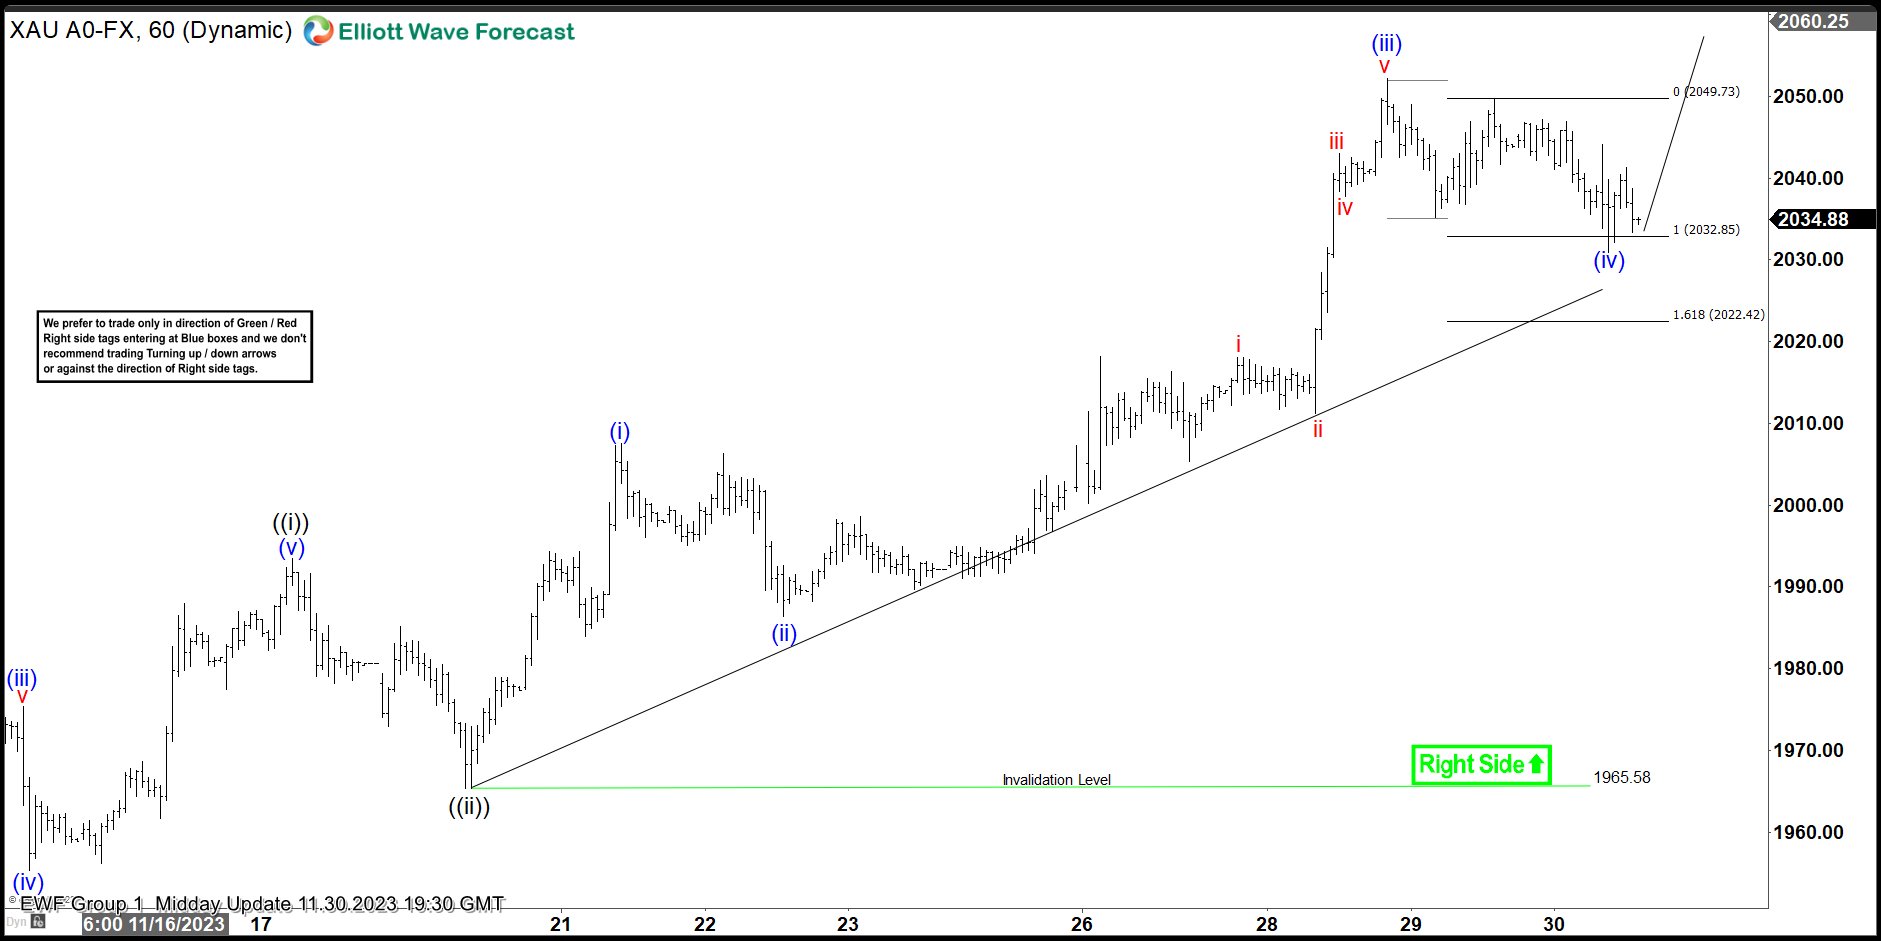
Last year, our live trading room provides 69% return annually across the 3 groups that we cover. In Live Trading Room, we scan the market everyday to find any tradable setup. We believe every serious traders need to have a good trading system with specific rules. A complete system must include the following: 1. Conditions […]
-
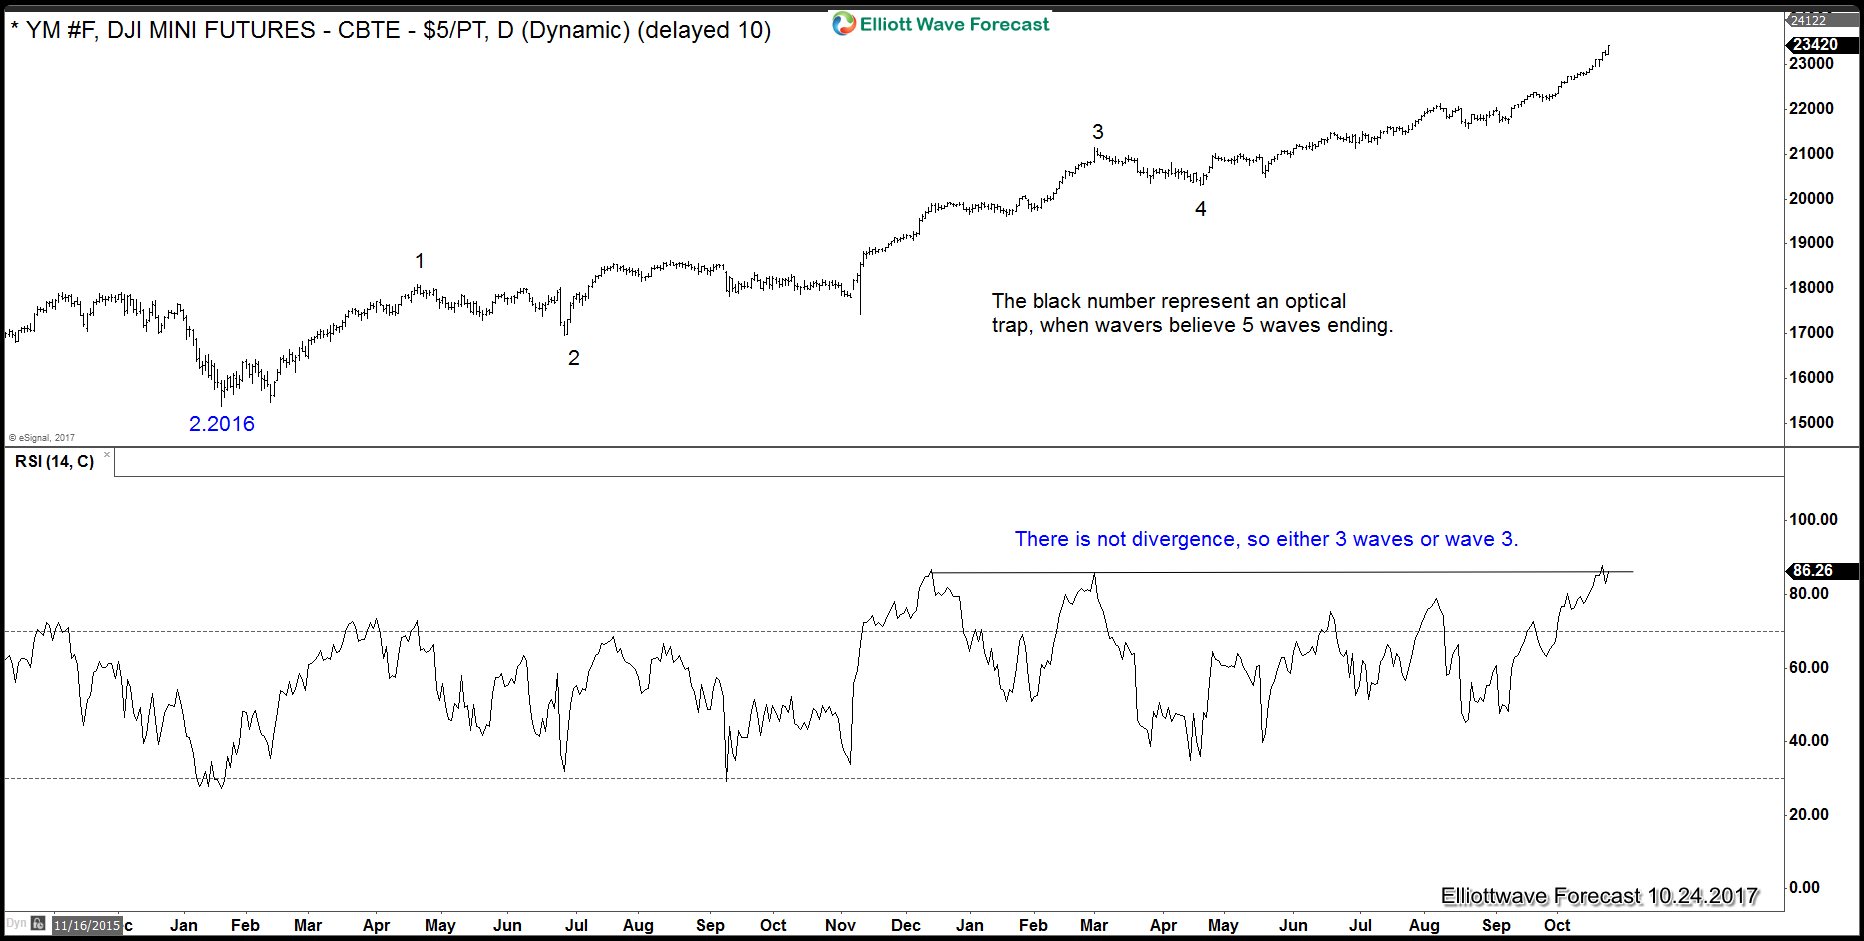
Elliott wave: Are the Indices ending 5 waves or not?
Read MoreElliott wave: The 5 waves advance The Elliott wave Theory is a famous trading tool and is based in the idea that the Market advances in 5 waves and corrects in 3 waves. The Theory has some basic rules which are listed below 1) Wave 2 never retraces more than 100% of wave 1. 2) Wave […]
-
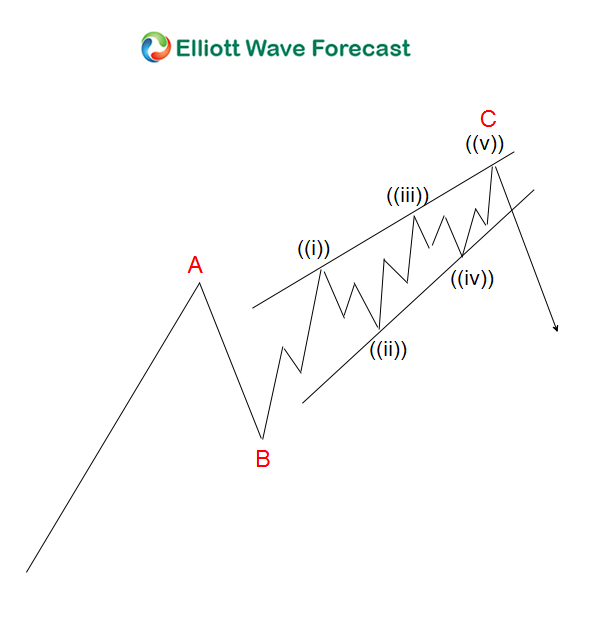
Elliott Wave Theory Structure; An Ending Diagonal
Read MoreWhat is an Ending Diagonal in Elliott Wave Analysis? An ending diagonal is a type of impulsive motive wave in Elliott Wave Theory that occurs in the fifth wave’s subdivision or within an entire C wave structure. An ending diagonal C wave or 5th wave commonly shows an obvious wedge shape with an overlapping wave […]
-
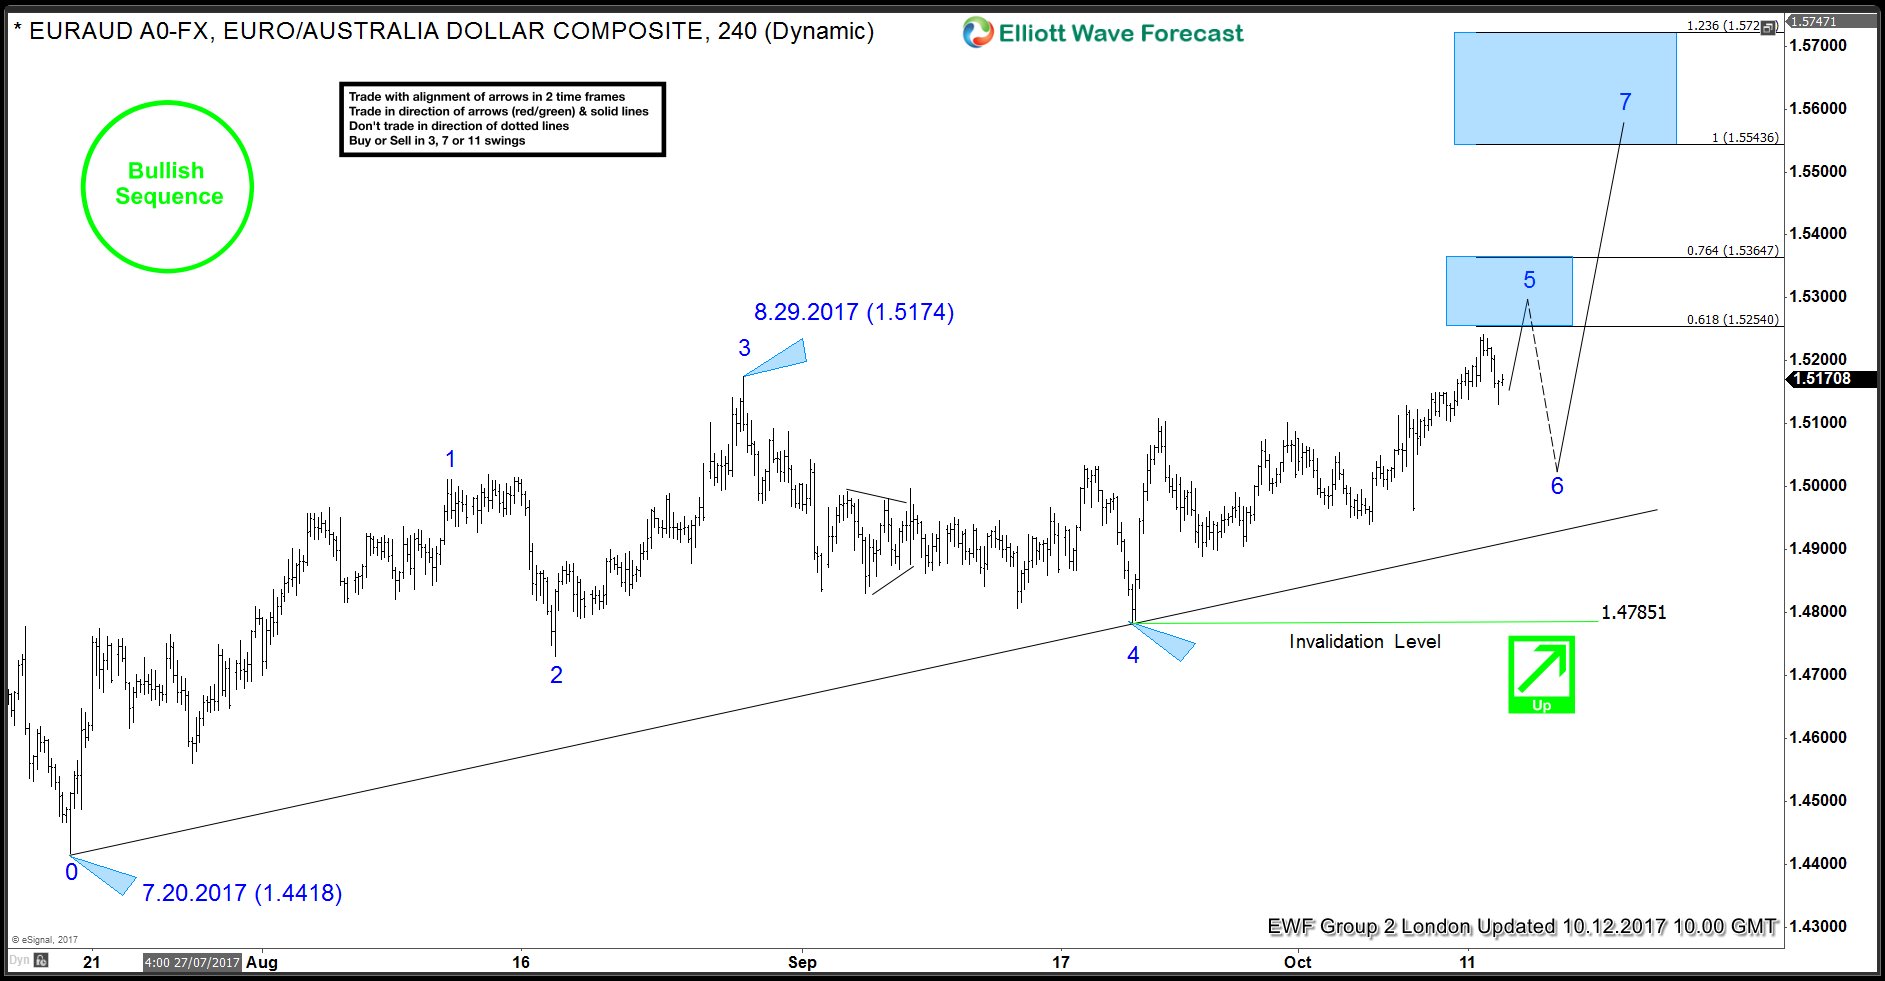
Trading Edge through Swings Sequences
Read MoreMost Elliott Wave Practitioners think that 5 wave move off a high / low provides them with a Trading Edge as according to Elliott Wave Theory, a 5 wave move should be followed by 3 waves back and another 5 wave move in the direction of the first 5 wave move. Experience has taught us […]
-
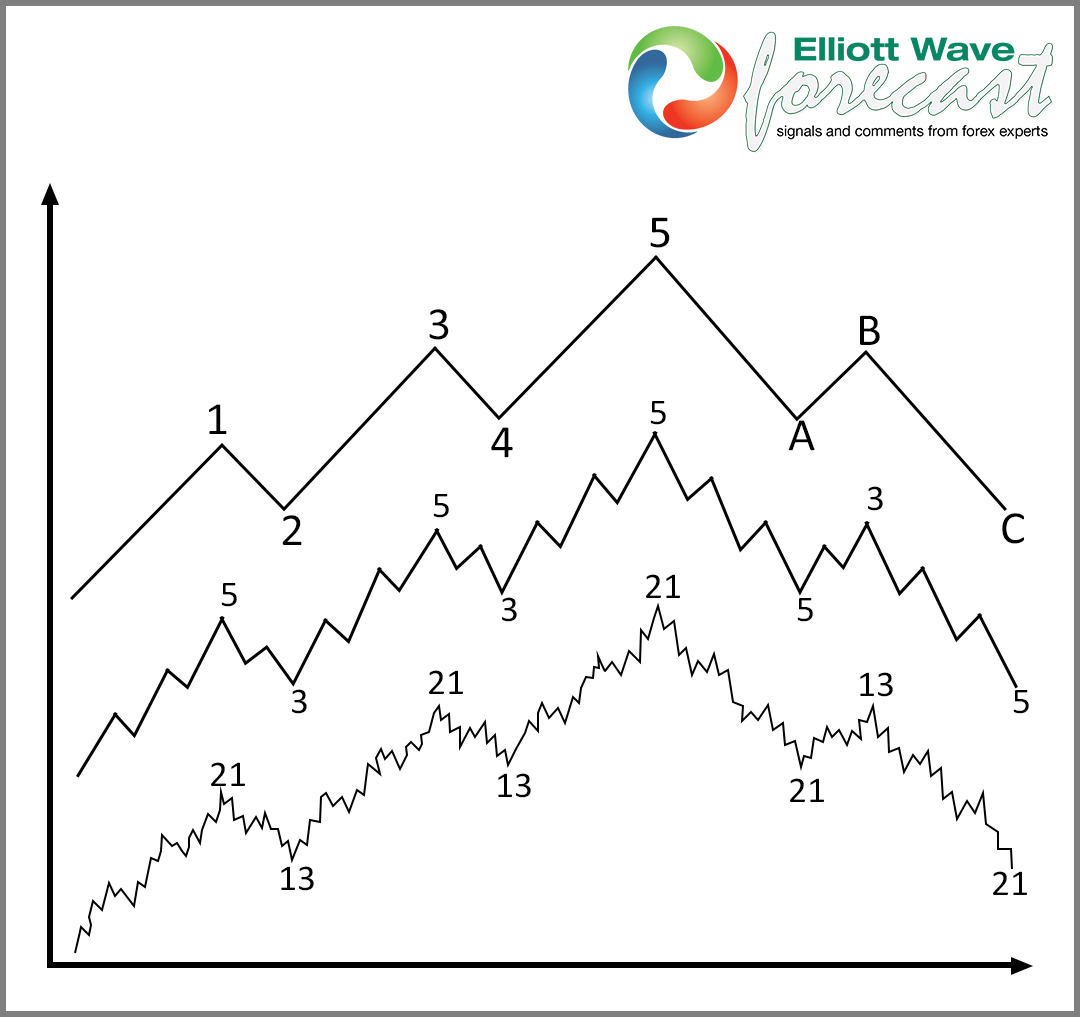
Elliott Wave Theory – Most Powerful Move: Wave 3/C
Read MoreThe Elliott wave Theory and the most powerful move The Elliott wave Theory was developed a century ago but the market has changed a lot since then. The market has become more computer driven and more popular. The volume has also increased tremendously. Despite these changes however, Elliott Wave Theory has stayed the same. As […]
-
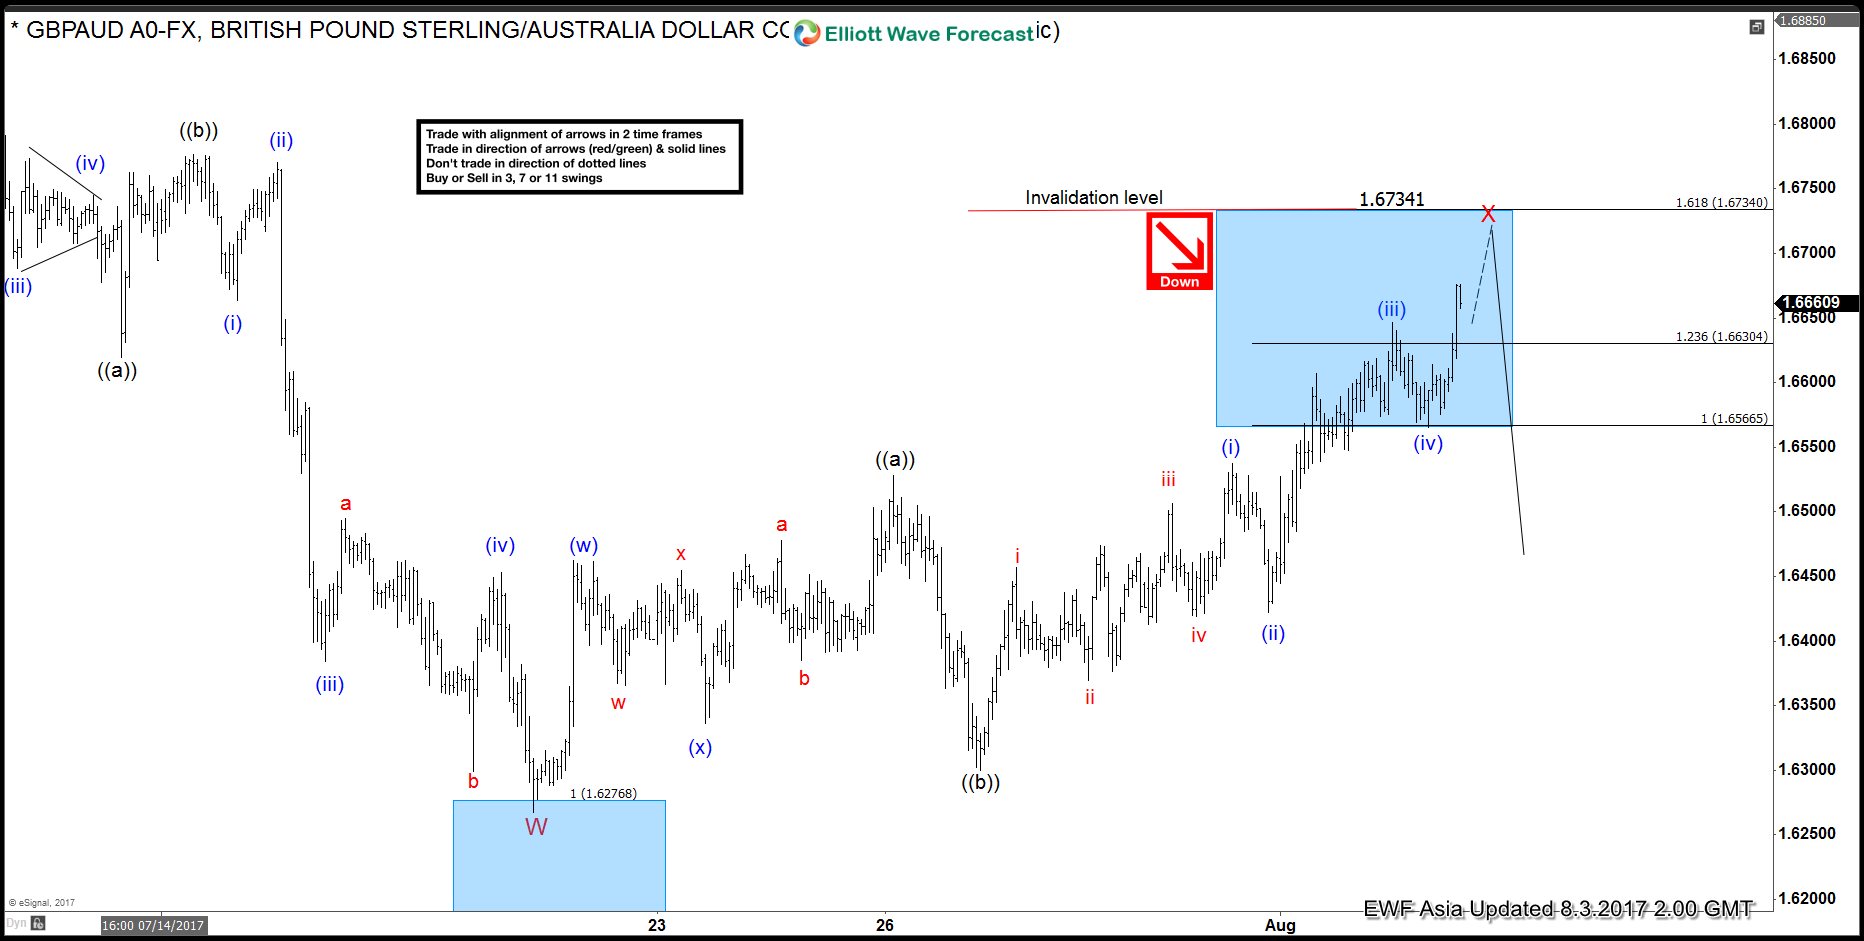
Elliott Wave Flat explained through GBPAUD example
Read MoreHello fellow traders. In this technical blog we’re going to see what Elliott Wave Flat structure looks like with real market example. We’re going to take a quick look at the past Elliott Wave chart of GBPAUD published in members area of www.elliottwave-forecast.com and explain the theory of Flat structure. Elliott Wave Flat Elliott Wave Flat […]
-
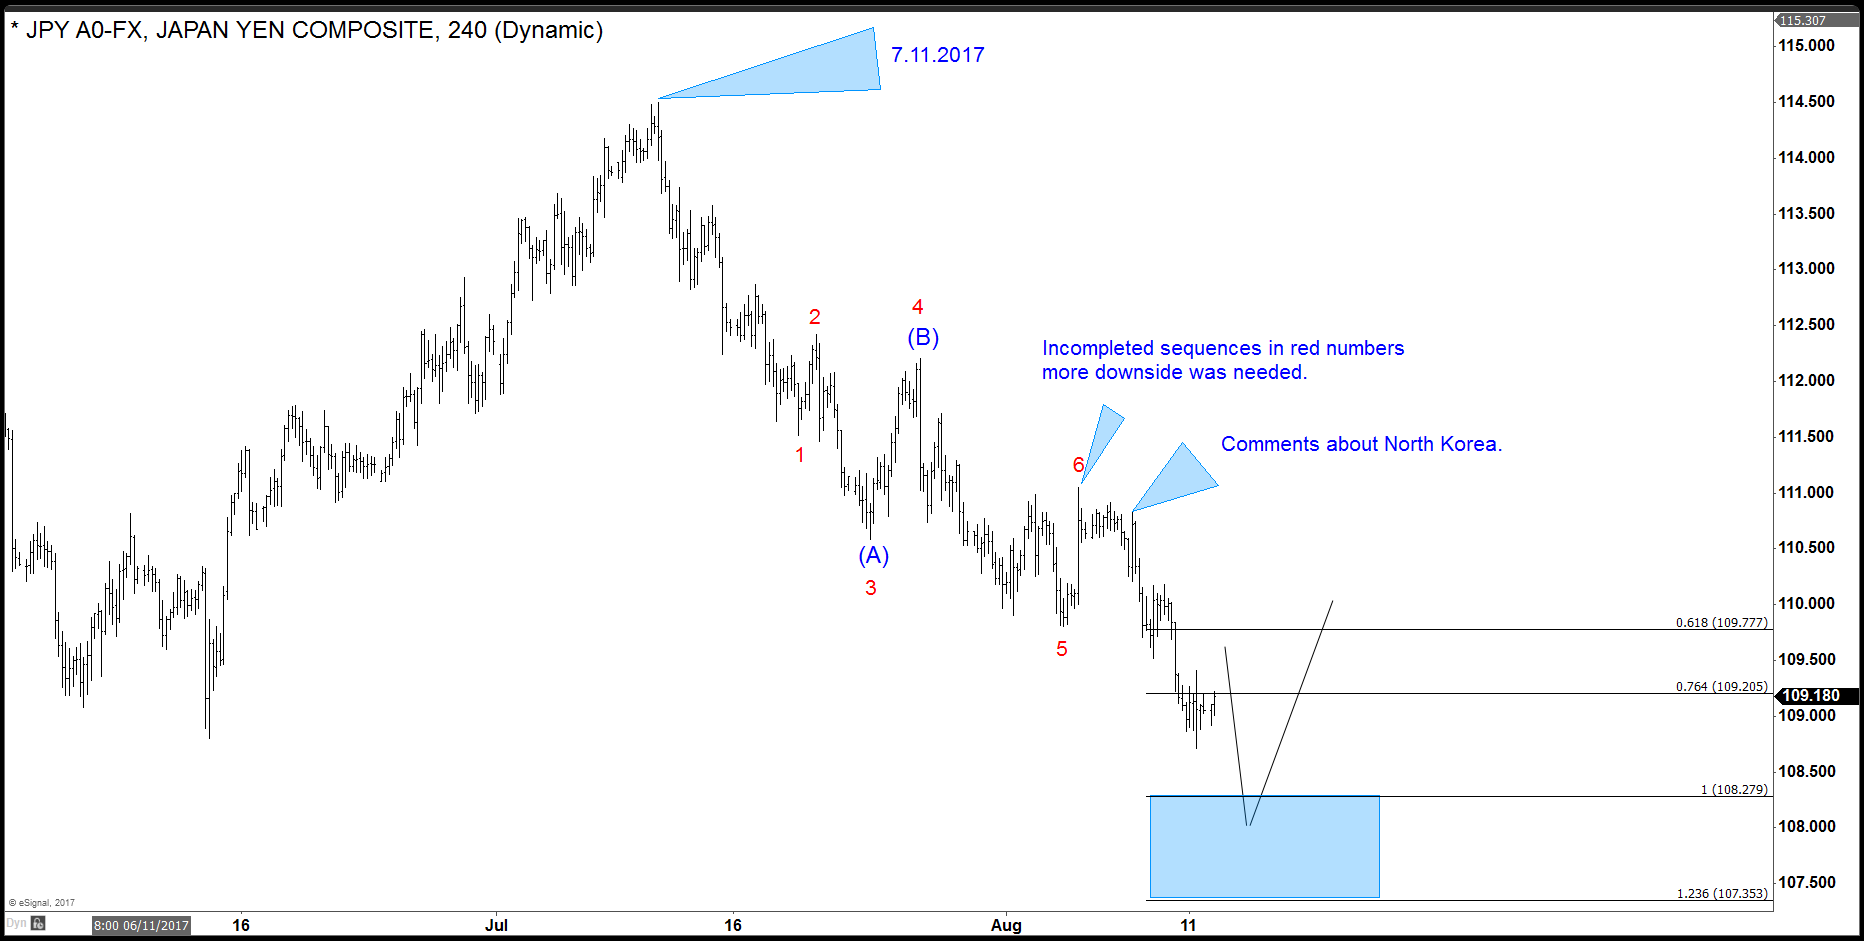
Will North Korea situation create a Market correction?
Read MoreThe situation in North Korea went to another level last week when President Trump made some “Fire and Fury” comment. His response to the provocation by North Korea resulted in risk off with sell off across the market, higher VIX, Yen strength. Precious metals such as Gold and Silver also saw bids and started to rally in the […]