
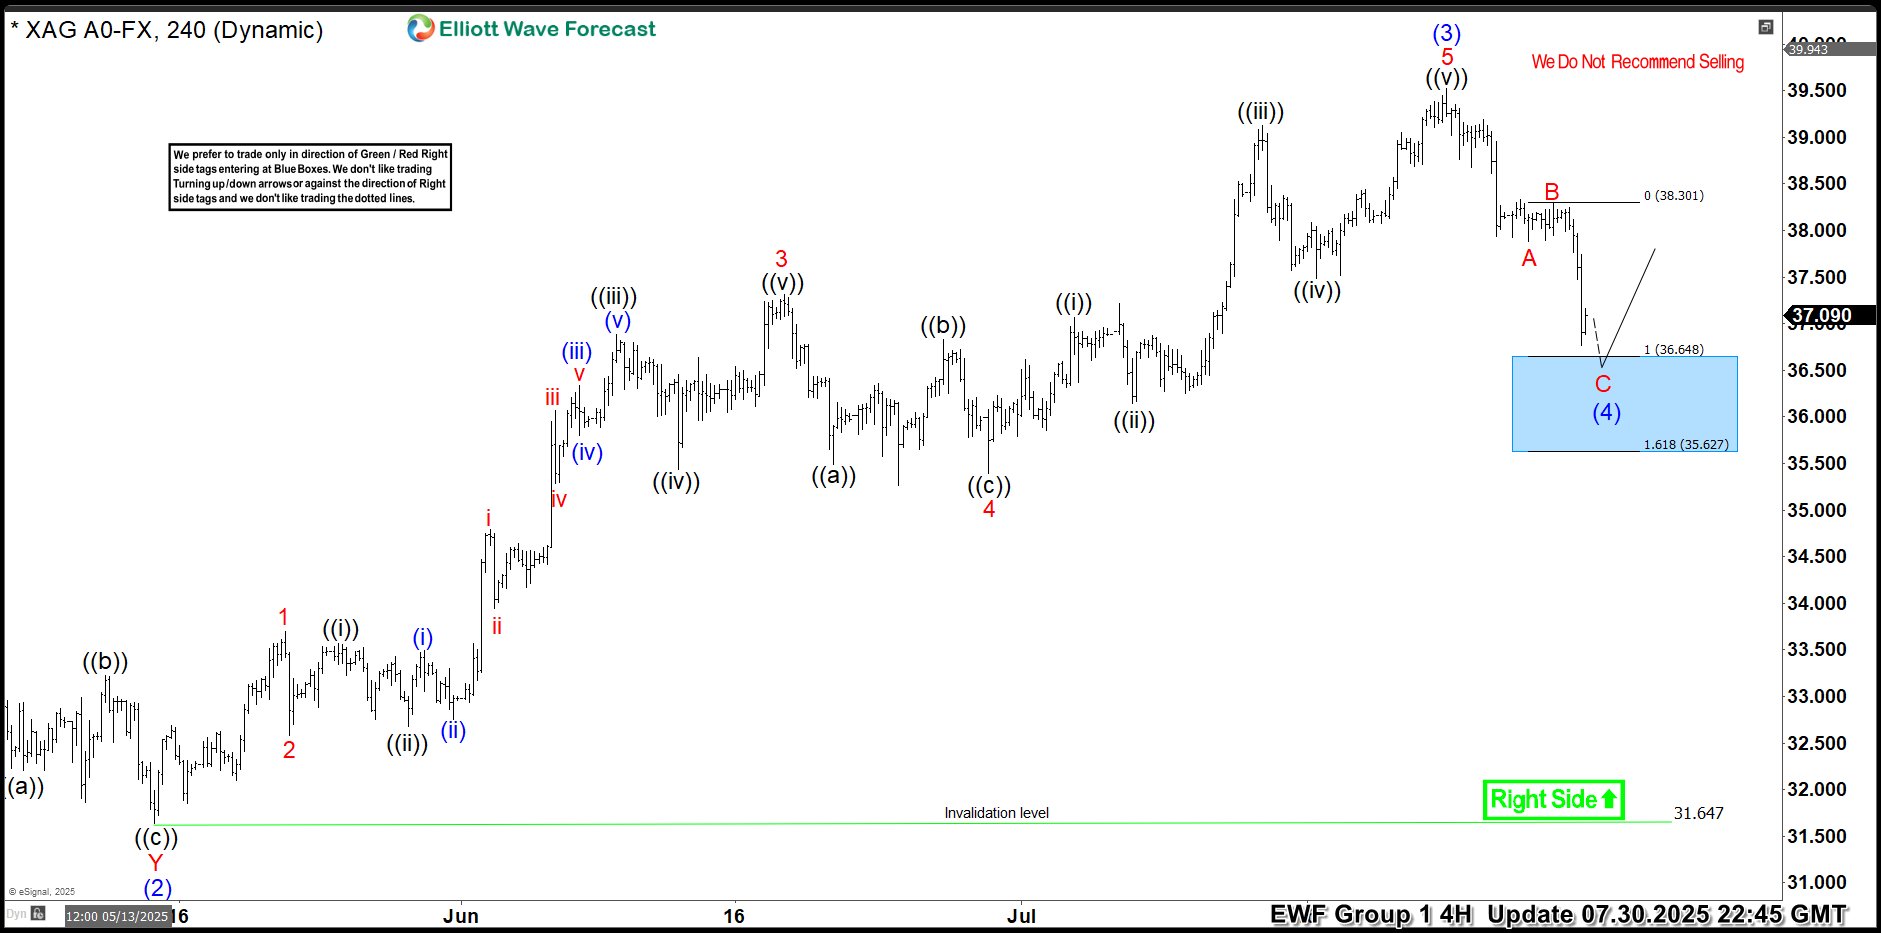
Hello traders. As our members know, we have had many profitable trading setups recently. In this technical article, we are going to talk about another Elliott Wave trading setup we got in Silver (XAGUSD). The commodity has completed its correction exactly at the Equal Legs zone, also known as the Blue Box Area. In this […]
-
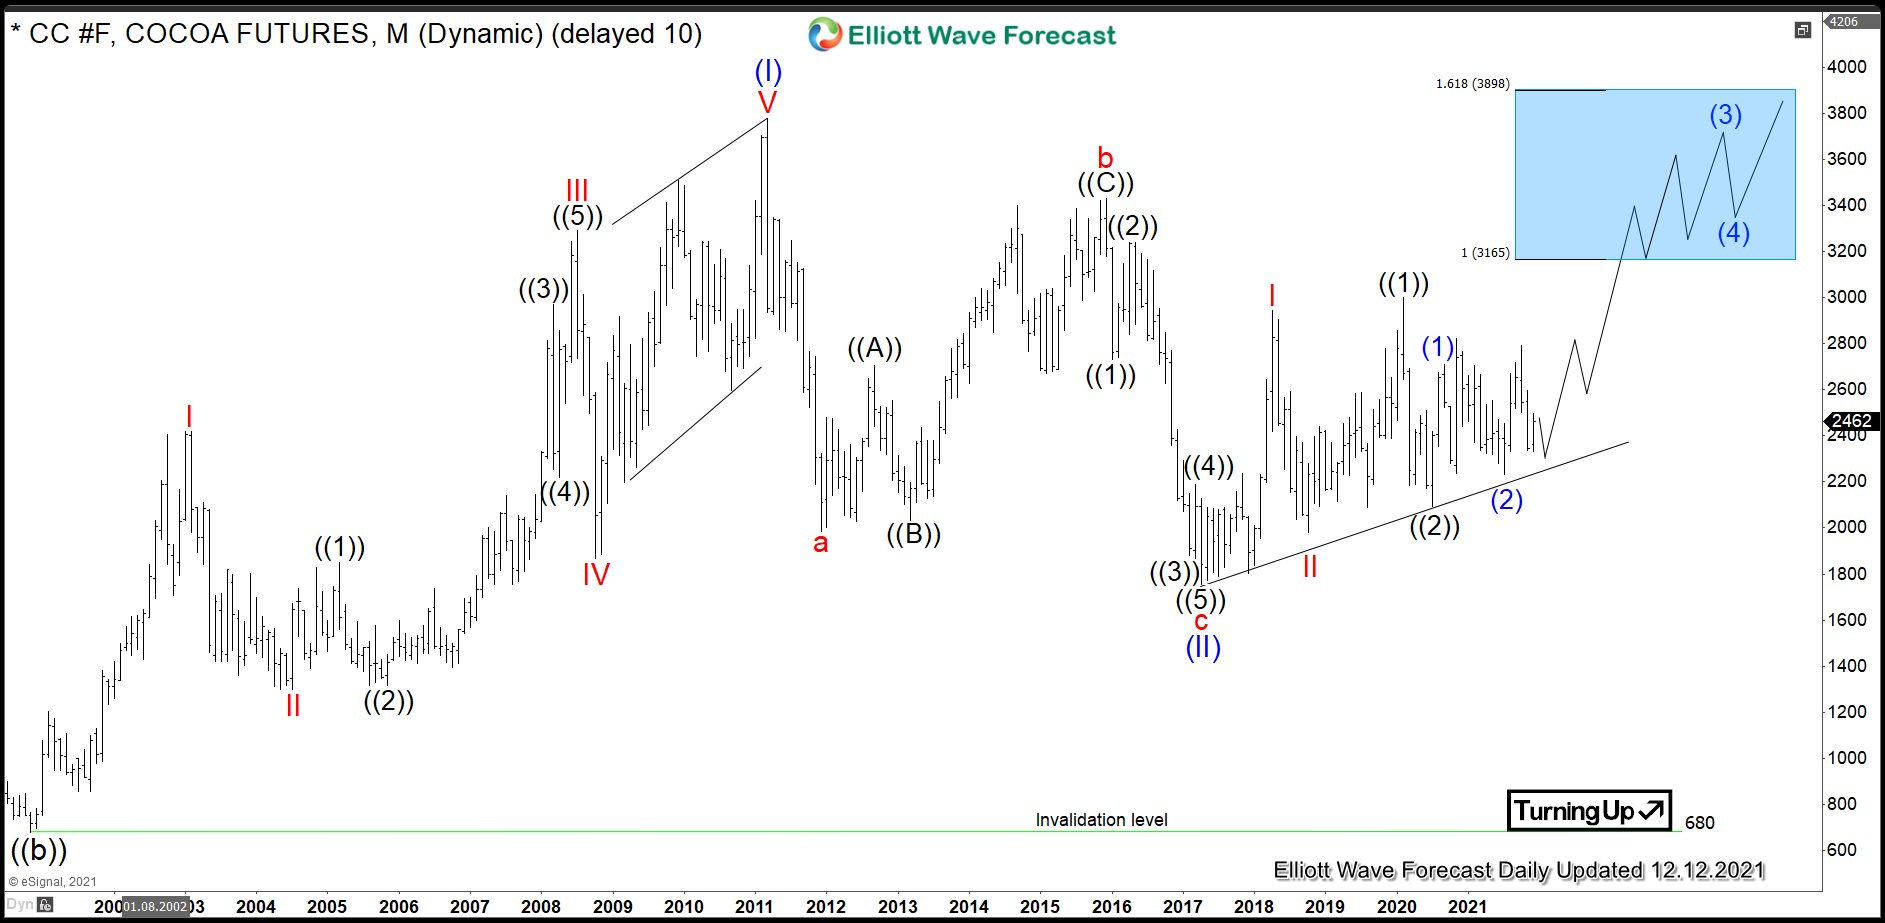
$CC #F: Will Cocoa Prices Catch Up Those of Coffee?
Read MoreCocoa (or cocoa bean) is one of soft commodities, along with sugar, coffee, orange juice and cotton. The bean is the fully dried and fermented seed, wherefrom cocoa solids and cocoa butter can be extracted. Cocoa beans are the basis of the chocolate. One can trade Cocoa futures at ICE owned New York Board of […]
-
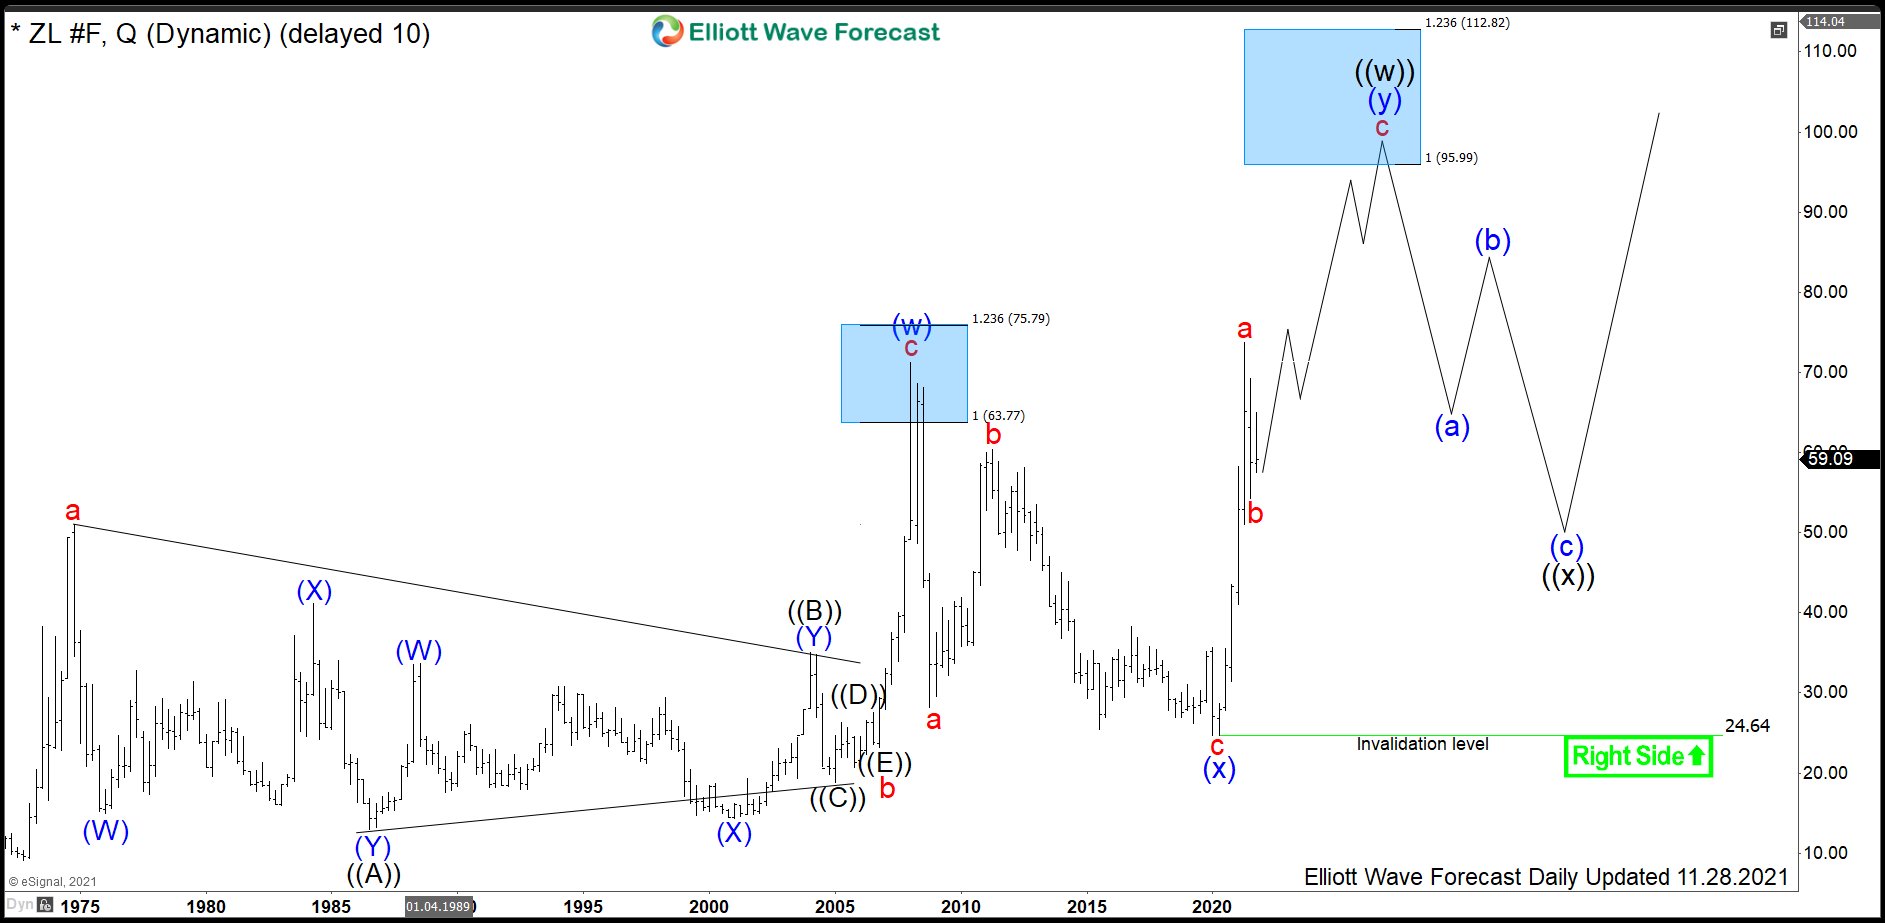
ZL #F: Soybean Oil Ready for a New Cycle Higher
Read MoreSoybean Oil is one of the grain & oilseed commodities, along with wheat, soybeans, corn, rice, oats and others. Just behind palm oil, it is the second most used vegetable oil, basically, for frying and baking. Also, soybean oil finds applications medically and, when processed, for printing inks and oil paints. One can trade Soybean […]
-

Best Commodities to Invest in 2024
Read MoreCommodities are the goods and raw materials that circulate on the global market, such as natural resources and agricultural products. They impact our everyday lives, whether we’re investors or not. Investors can also invest in commodities through the use of futures contracts or exchange-traded products (ETPs) that directly track the specific commodity index. There are […]
-
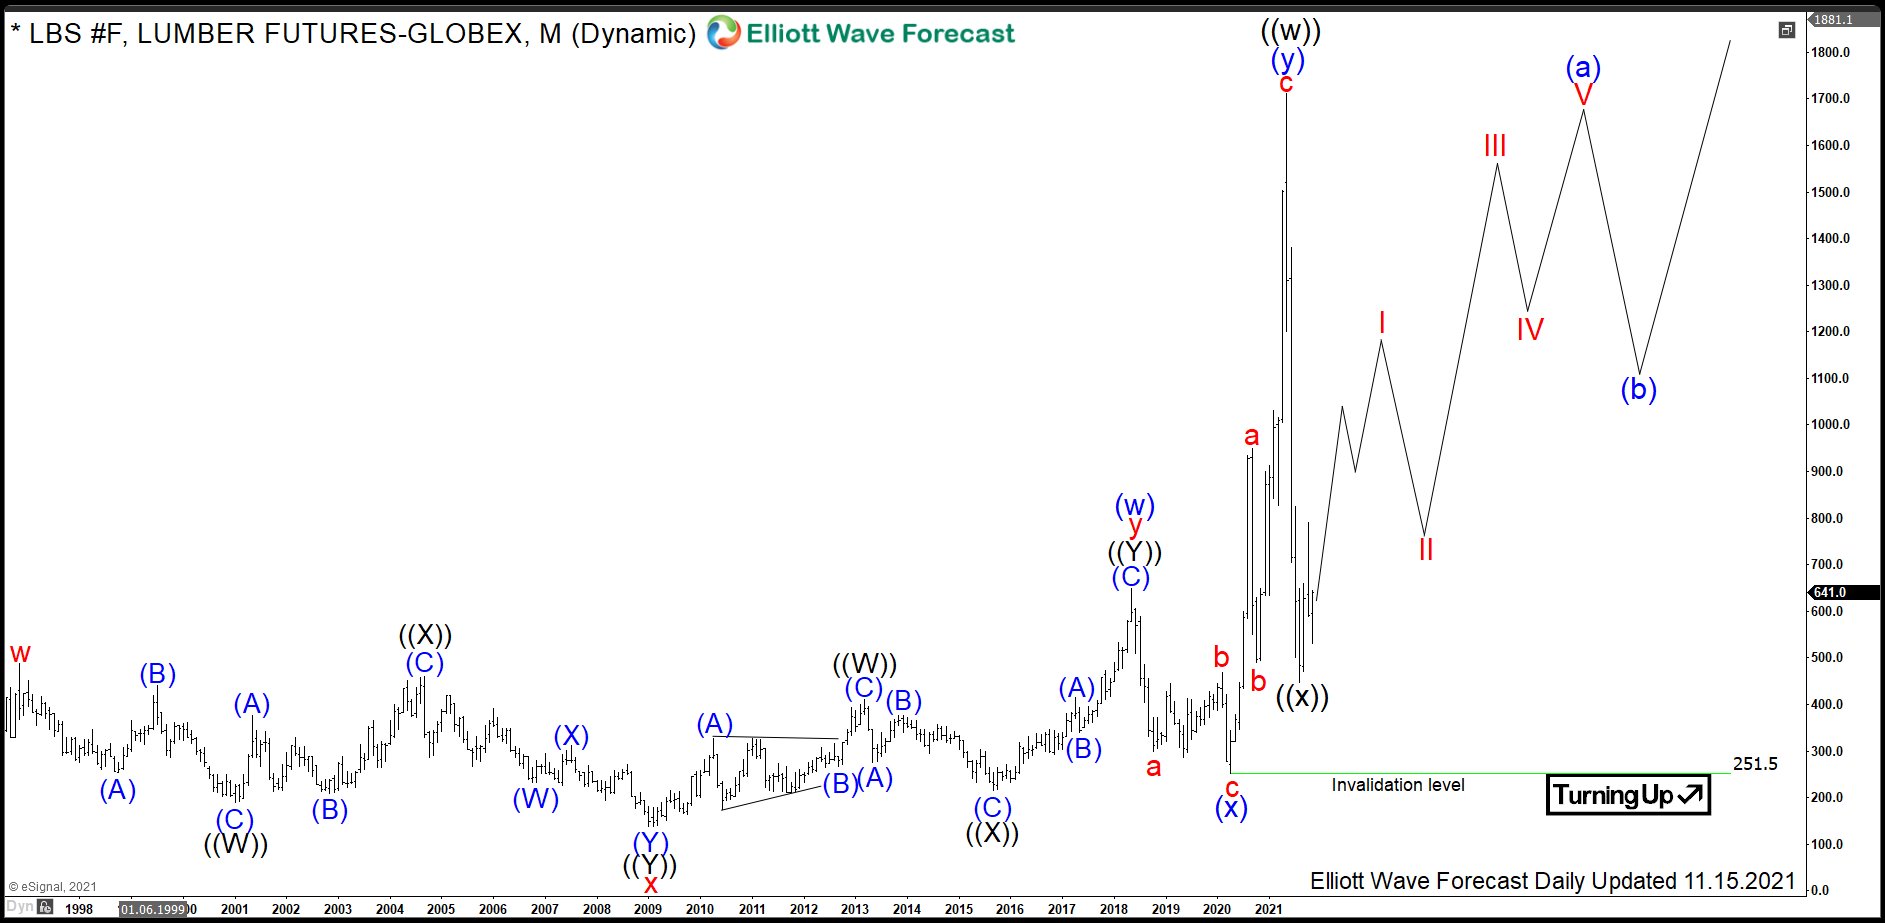
$LBS: Lumber Prices Start a New Large Cycle Higher
Read MoreLumber, also known as timber, is a type of wood that has been processed into beams and planks. One can trade it in form of Random Length Lumber futures and options at Chicago Mercantile Exchange within the agriculture asset class under the ticker $LBS. In 2020, we saw commodities turning higher. Then, a medium term […]
-
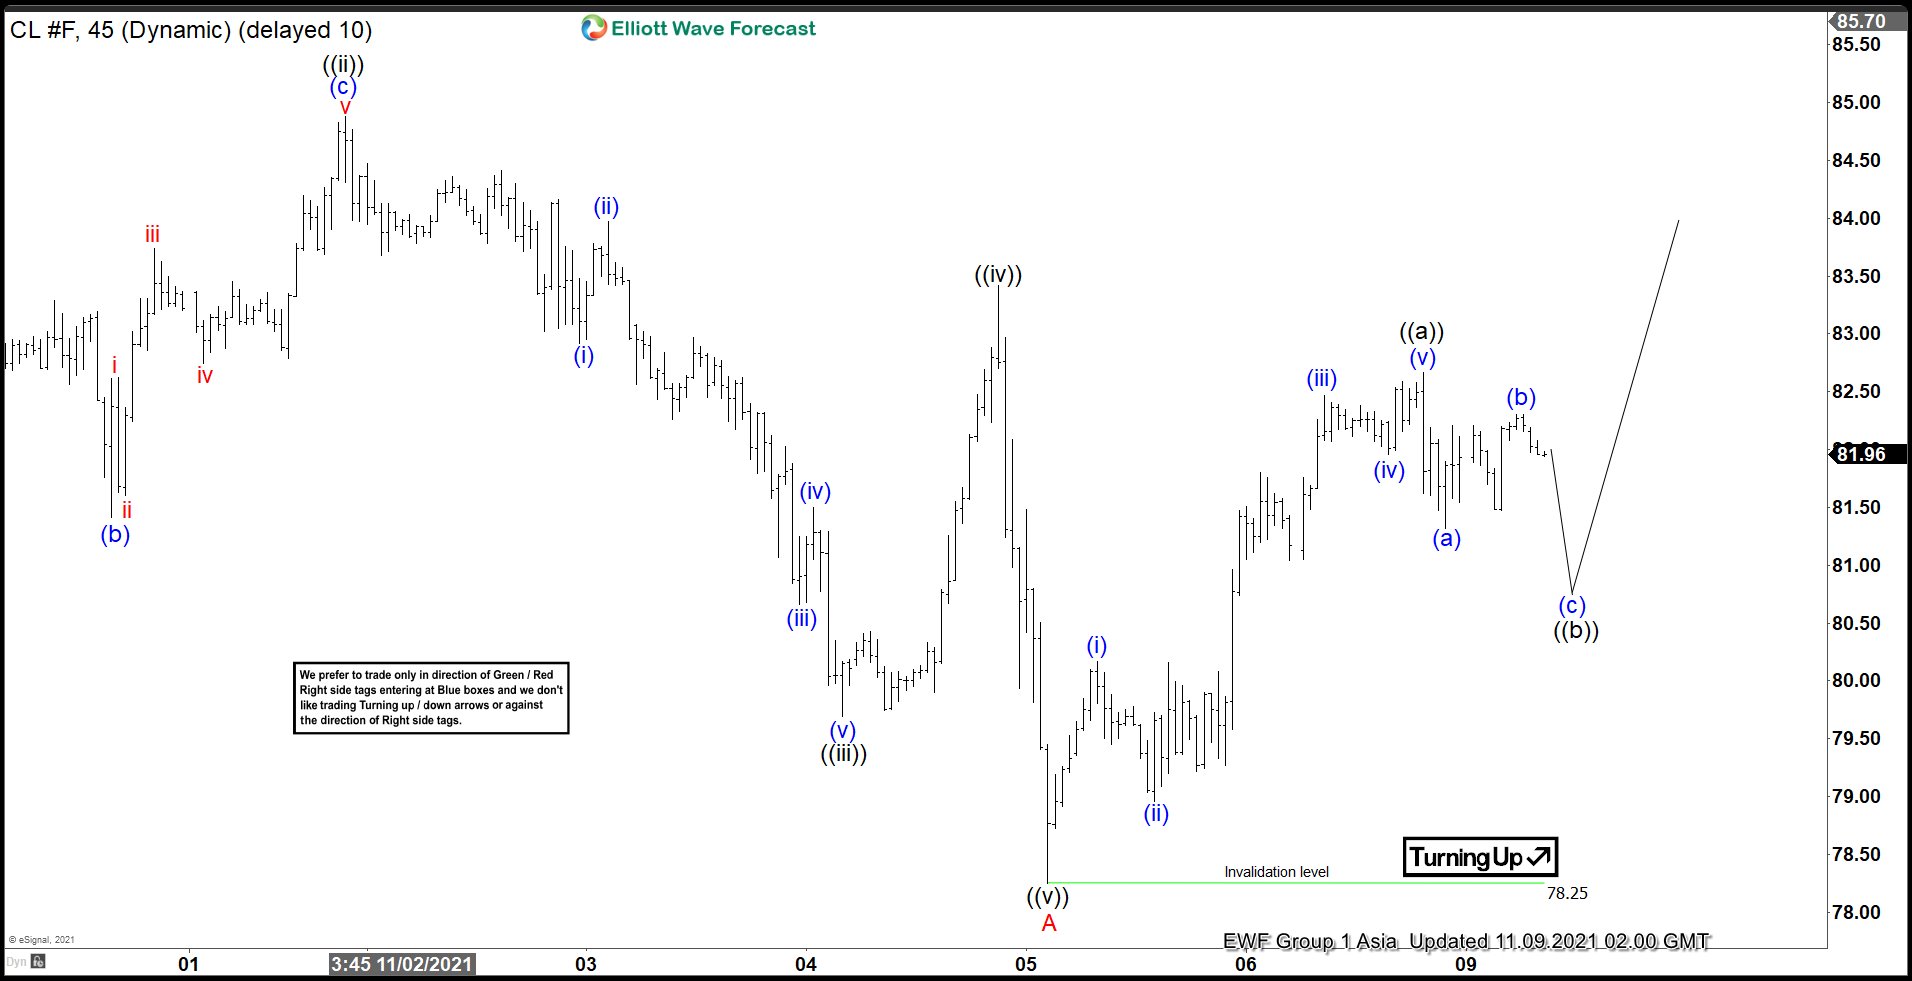
Elliott Wave View: Oil (CL) Looking for 3 Waves Rally
Read MoreOil (CL) is looking for at least a 3 waves rally from November 5 low suggesting further upside. This article and video look at the Elliott Wave path.
-
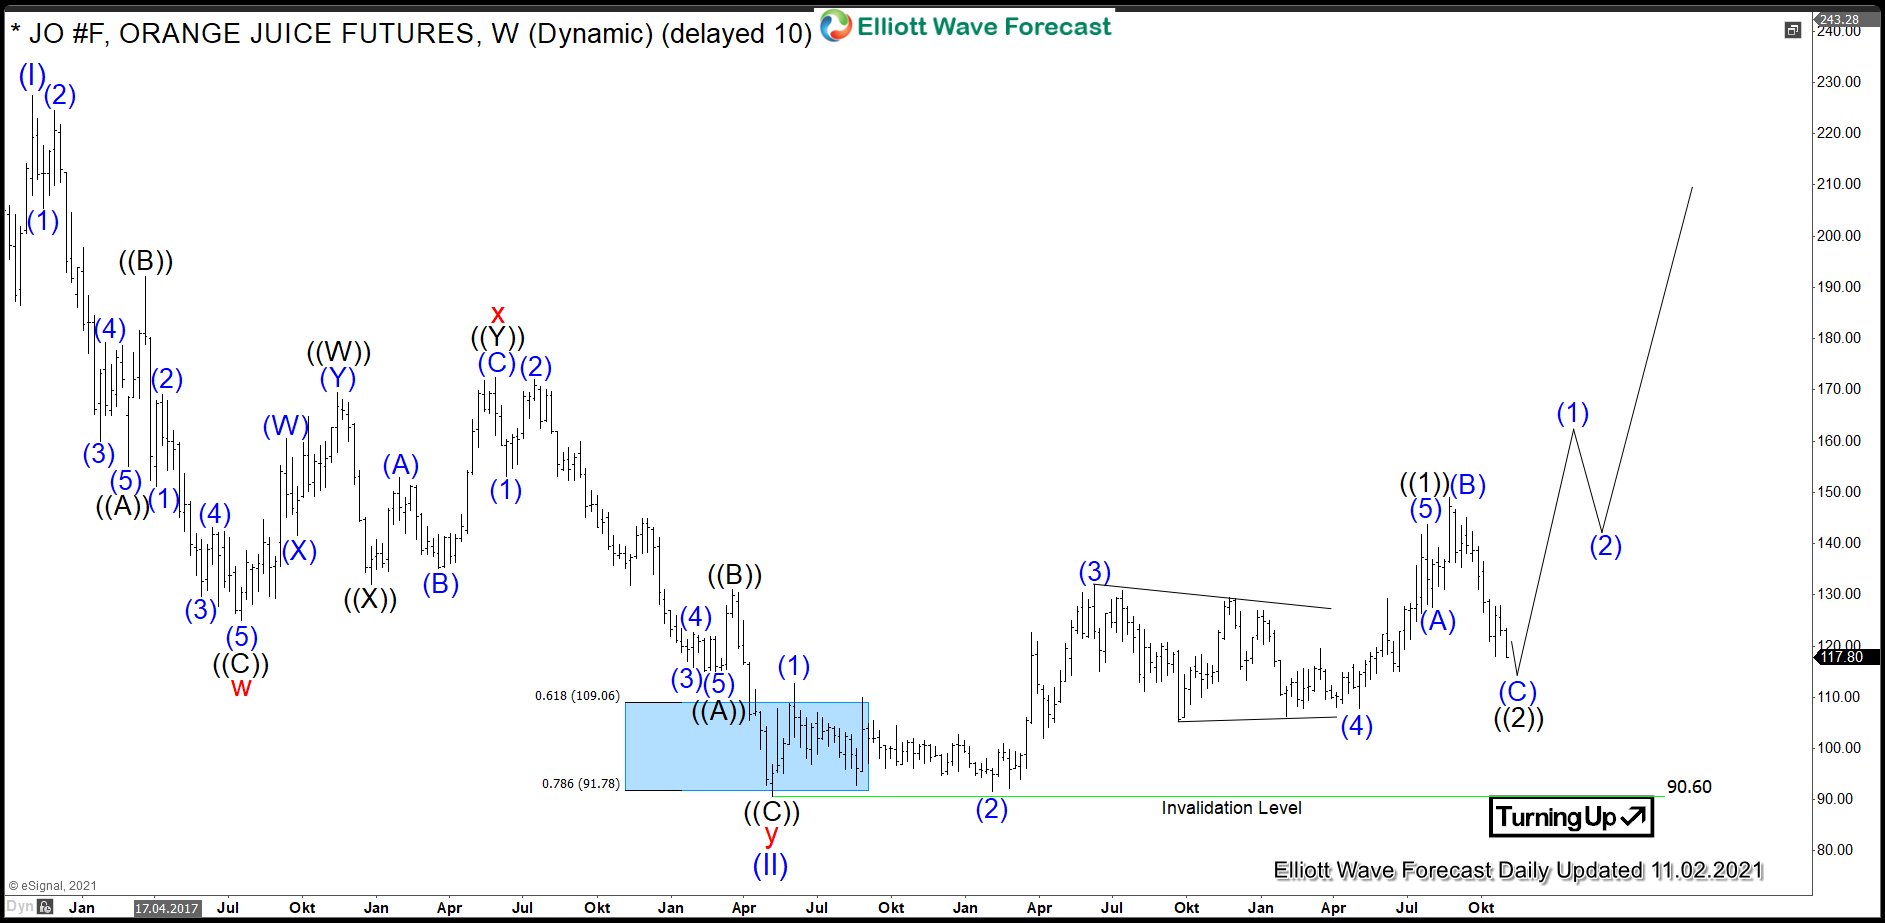
FCOJ: Frozen Concentrated Orange Juice Provides Opportunity
Read MoreIn the original article from March 2021, we have discussed the price action and the outlook for the Frozen Concentrated Orange Juice. Today, we present un updated view. As it has been expected, the soft commodities have advanced. In particular, we saw commodities like coffee, cocoa, cotton and sugar extending higher. Hereby, orange juice futures OJ #F […]