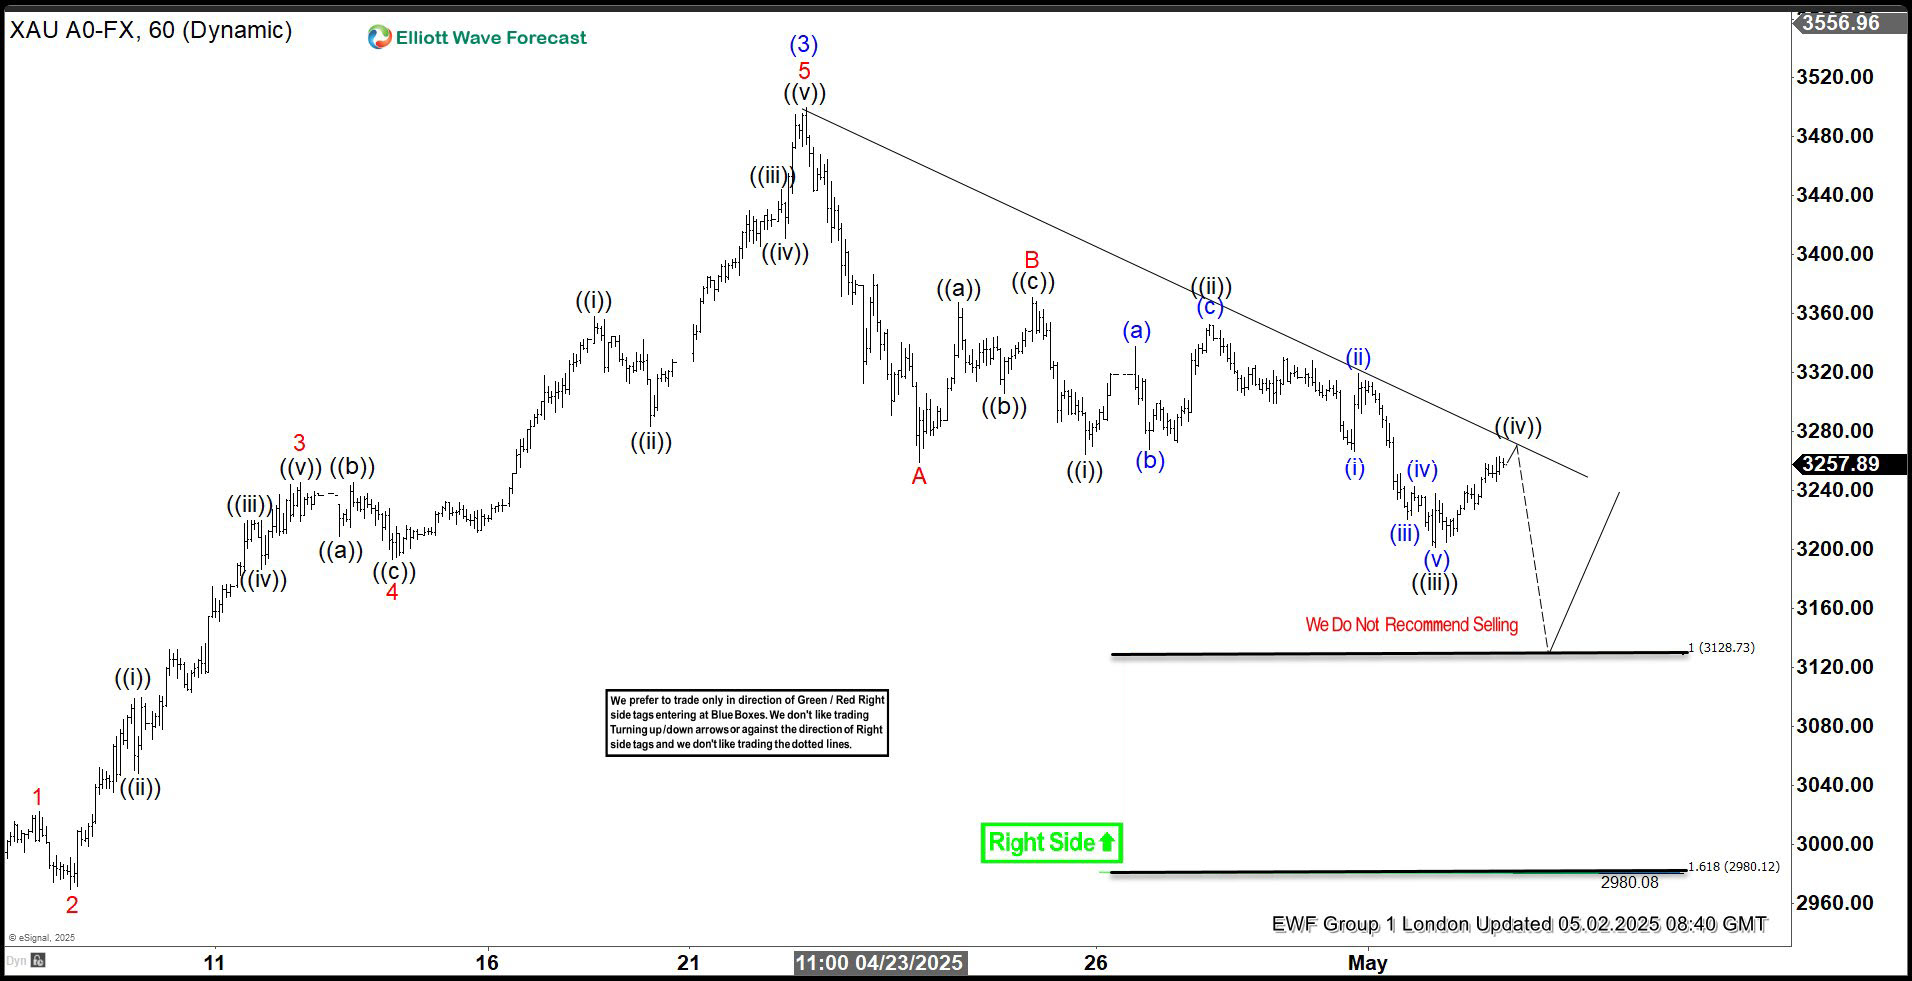
Hello fellow traders. In this technical article we’re going to look at the Elliott Wave charts of GOLD ($XAUUSD ) published in members area of the website. As our members know, XAUUSD is forming a correction against the 2954.2 low. In the following text, we’ll explain the Elliott Wave analysis and outline the target areas.
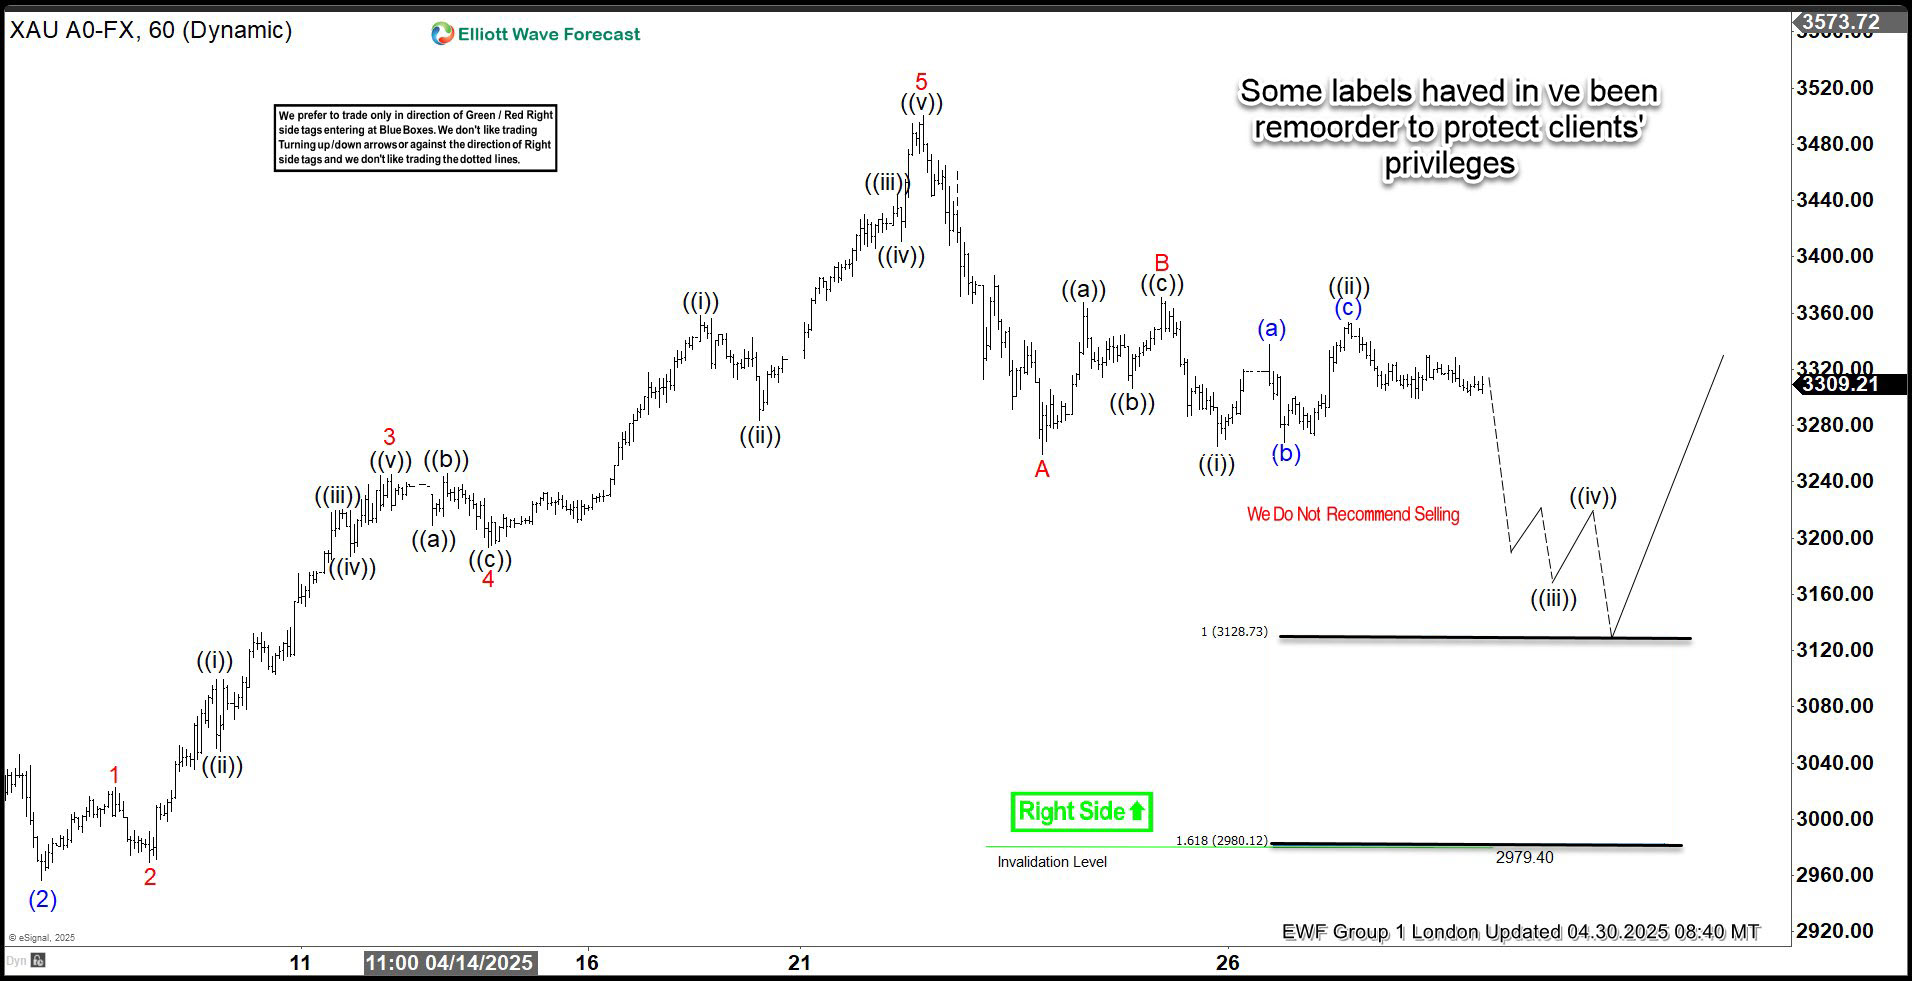
XAUUSD Elliott Wave 1 Hour Chart 04.30.2025
The price structure shows incomplete sequences from the April 22nd peak. The price broke below the 3260 level, confirming a potential extension to the downside.
As long as the price remains below the 3352.9 peak, we consider the intraday wave ((ii)) bounce completed and anticipate further decline in the near term.
90% of traders fail because they don’t understand market patterns. Are you in the top 10%? Test yourself with this advanced Elliott Wave Test
XAUUSD Elliott Wave 1 Hour Chart 05.02.2025
GOLD continued to drop as expected. The price broke to new lows, confirming the extension toward the 3128.7–2980.2 area.
We do not recommend selling at this point. If the marked extreme zone is reached, we will consider entering long positions again.
Remember, the market is dynamic, and the presented view may have changed in the meantime. For the most recent charts and target levels, please refer to the membership area of the site. The best instruments to trade are those with incomplete bullish or bearish swing sequences. We put them in Sequence Report and best among them are presented in the Live Trading Room
Reminder for members: Our chat rooms in the membership area are available 24 hours a day, providing expert insights on market trends and Elliott Wave analysis. Don’t hesitate to reach out with any questions about the market, Elliott Wave patterns, or technical analysis. We’re here to help.