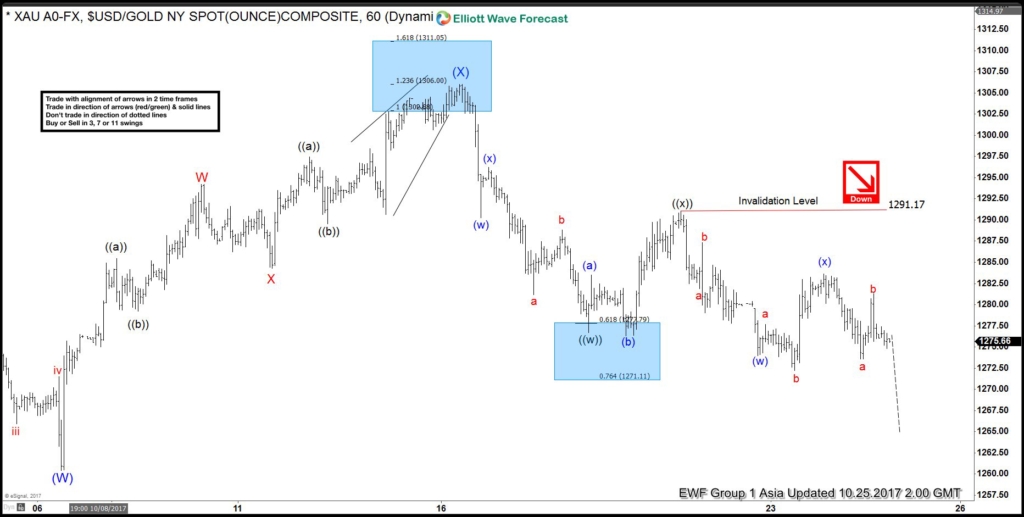
Short term Gold Elliott Wave view suggests that the rally from 10/06 low (1260.52) to 10/16 peak (1306.35) ended intermediate wave (X) then the decline from there is unfolding as a a double three Elliott wave structure. As the structure of the 10/16 peak looks to be overlapping, hence suggesting its corrective structure, either W, X, Y or W, X, Y, Z.
The first leg lower ended in Minute wave ((w)) at 1276.34 & bounce to 1291.17 ended Minute wave ((x)). Minute wave ((y)) currently in progress as double three structures. Where Minutte wave (w) ended at 1272.43 low and Minutte wave (x) bounce at 1283.54 as a flat. Near term, as far as bounces fails below 1291.17 peak metal has scope to extend 1 more push lower towards 1261.19-1254.42 100%-123.6% Fibonacci extension area from 10/16 peak. Afterwards it should end the cycle from 10/16 peak and should do a 3 wave bounce minimum. We don’t like buying the metal and as far as bounces fails below the 1291.17 peak and more importantly the pivot from 10/16 peak stays intact metal is expected to trade lower.
Gold 1 Hour Elliott Wave Chart
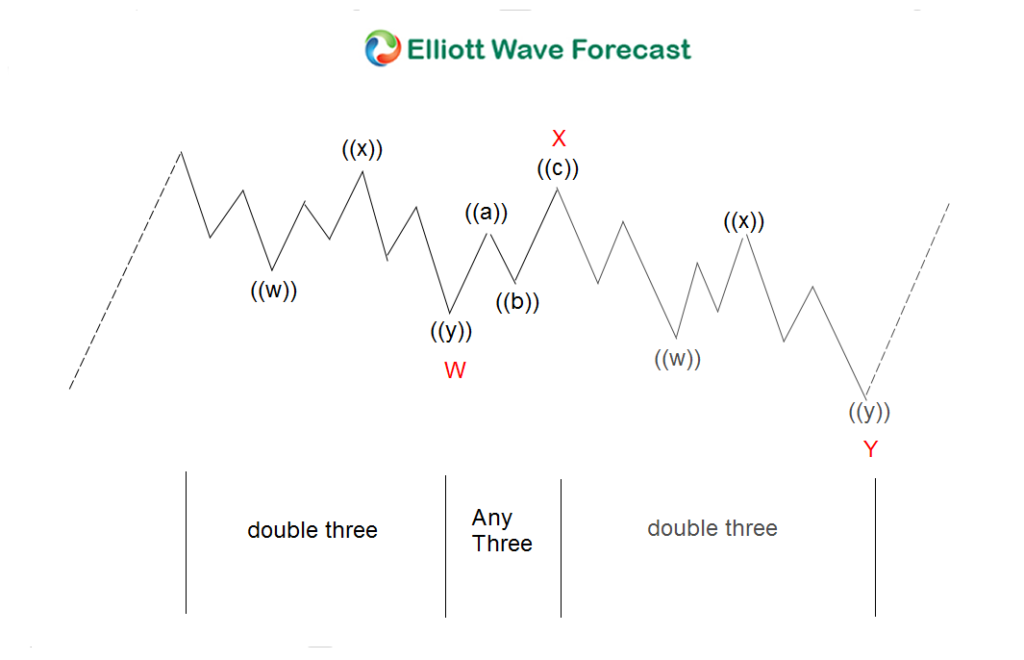
Double three is the most important pattern in the new Elliott wave theory and probably the most common pattern on the market these days, also known as 7 swing structure. It is a very reliable pattern that is giving us good entries with clearly defined invalidation levels and target areas. The image below shows what Elliott Wave Double Three looks like. It has (W), (X), (Y) tagging and internal structure 3,3,3, which means that all 3 legs are corrective sequences. Each (W) and (Y) are made of 3 swings, have structure W, X, and Y to a lesser extent.
If you enjoyed this article, feel free to try our 14-day trial. We provide Elliott Wave analysis on 78 instruments in 4 different time frames, updating up to 4 times per day on a 1 hour chart, 3 live sessions by our expert analysts, 24 hour chat room moderated by our expert analysts, market overview and more! Try us for 14 days trial and start making a profit with us.
Back


