

The Power of 3-7-11 and the Grand Super Cycle: How We Saw the Bullish Turn in April 2025 Back on April 9, 2025, while World Indices were dropping sharply and global sentiment had turned overwhelmingly bearish, we published an article that challenged the fear-driven narrative. We explained why selling was not the right approach and […]
-
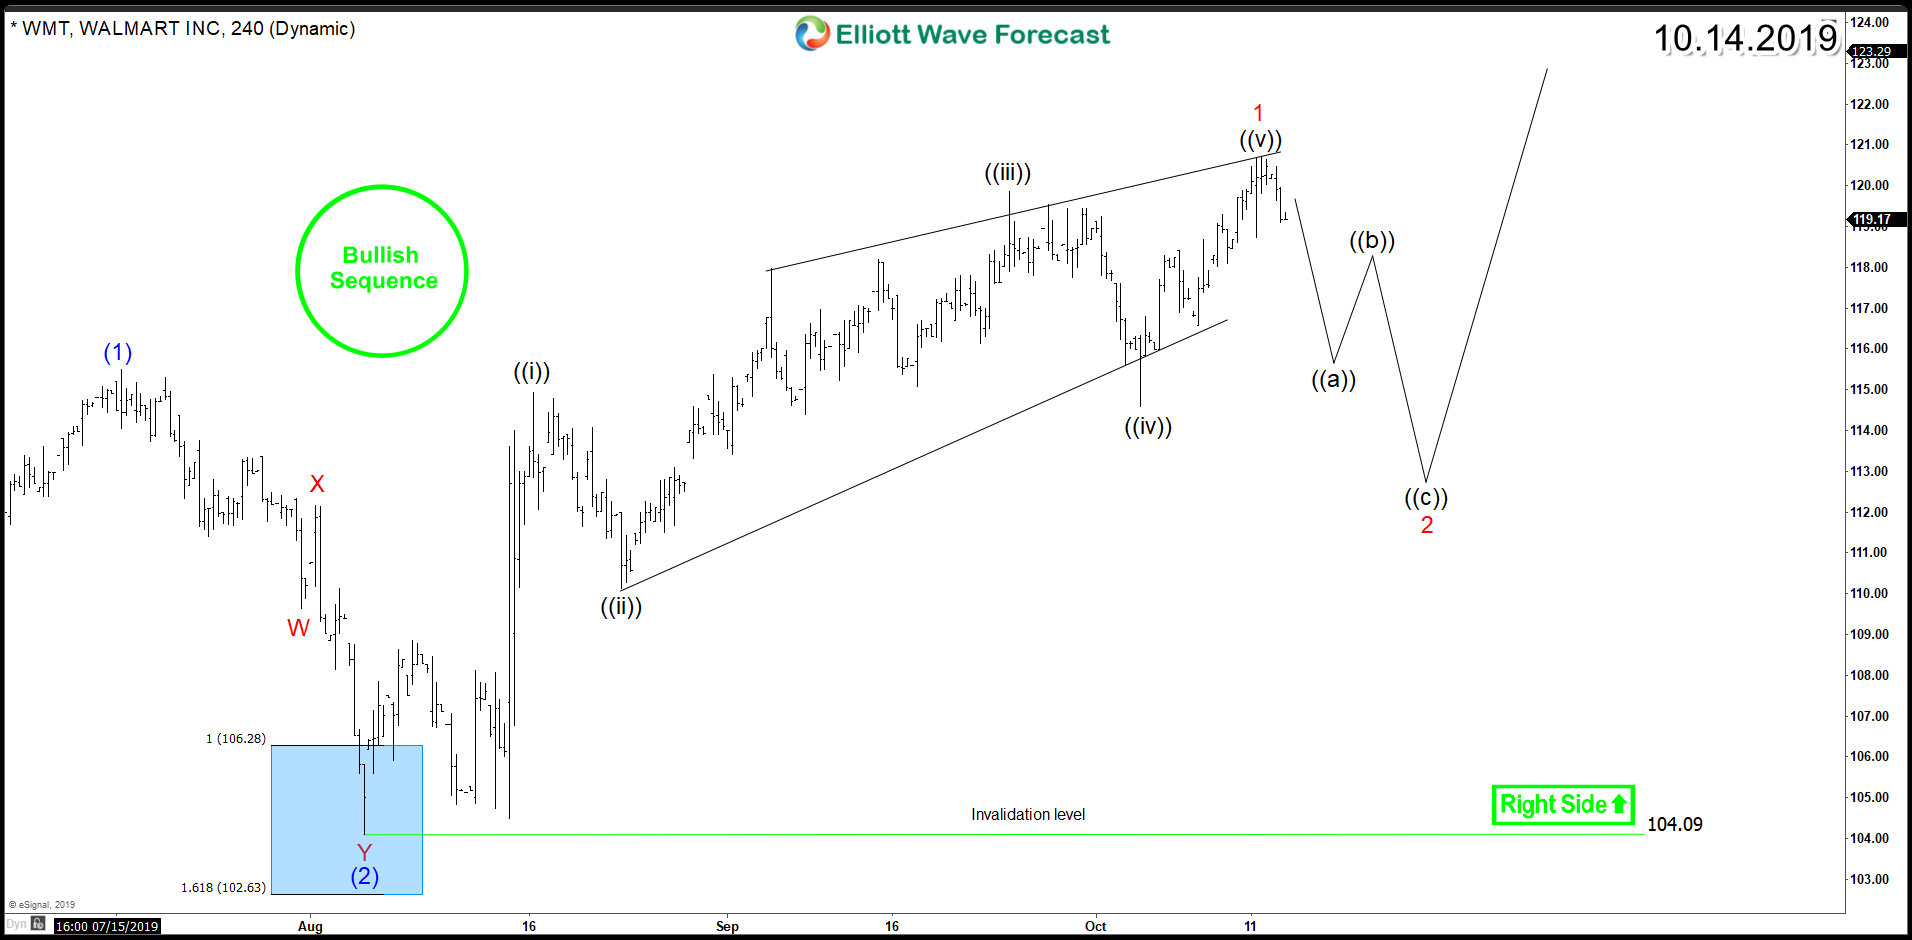
Walmart (NYSE: WMT) Bull Run Leads the Market
Read MoreWalmart (NYSE: WMT) is the world’s largest retailer, operating discount stores, supercenters, and grocery stores around the world. In today’s article, we’ll take a look at the short term cycle of the stock based on Elliott Wave Theory : Back in July 2019, WMT made new all time highs by breaking above January 2018 peak and […]
-
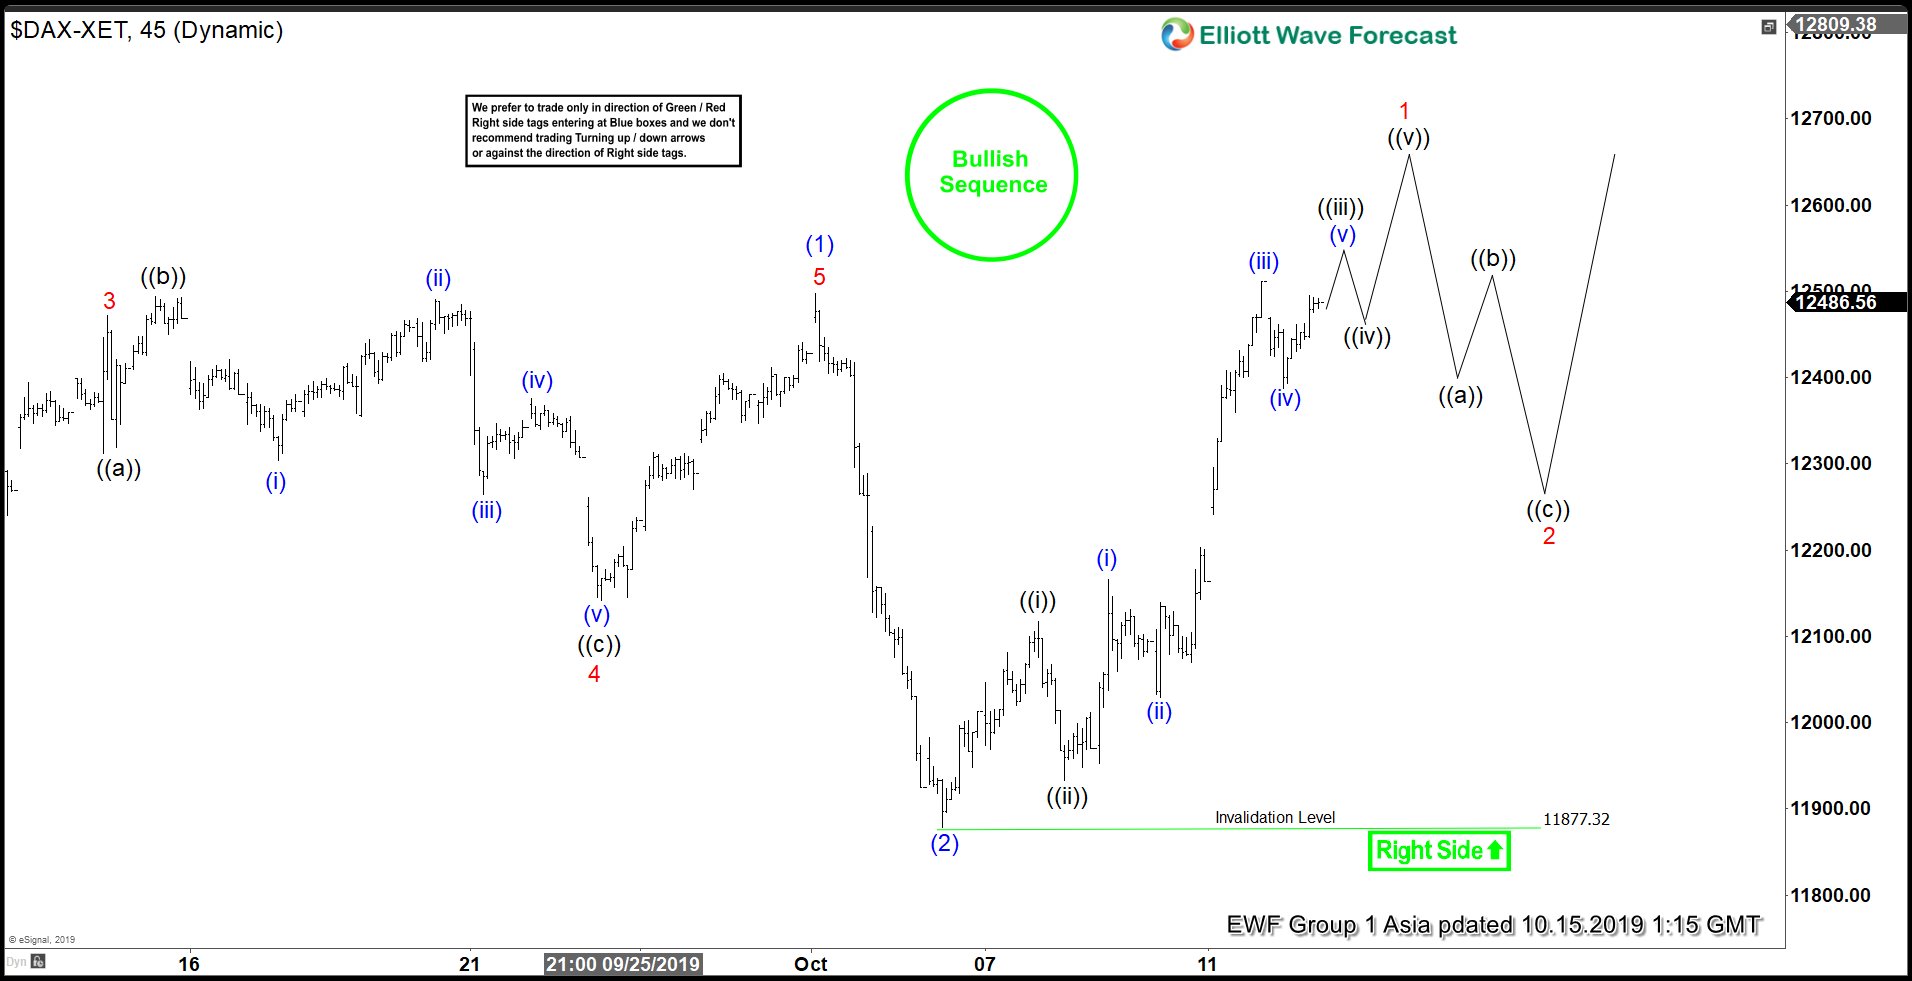
Elliott Wave View: Bullish Sequence in DAX
Read MoreDAX shows Elliott Wave bullish sequence from August 15, 2019 low (11266.48) favoring more upside. The rally from 11266.48 to 12497.28 ended wave (1) as a 5 waves impulse Elliott Wave structure. On the chart below, we can see wave 3 of (1) ended at 12471.83, wave 4 of (1) ended at 12141.82, and wave 5 of […]
-
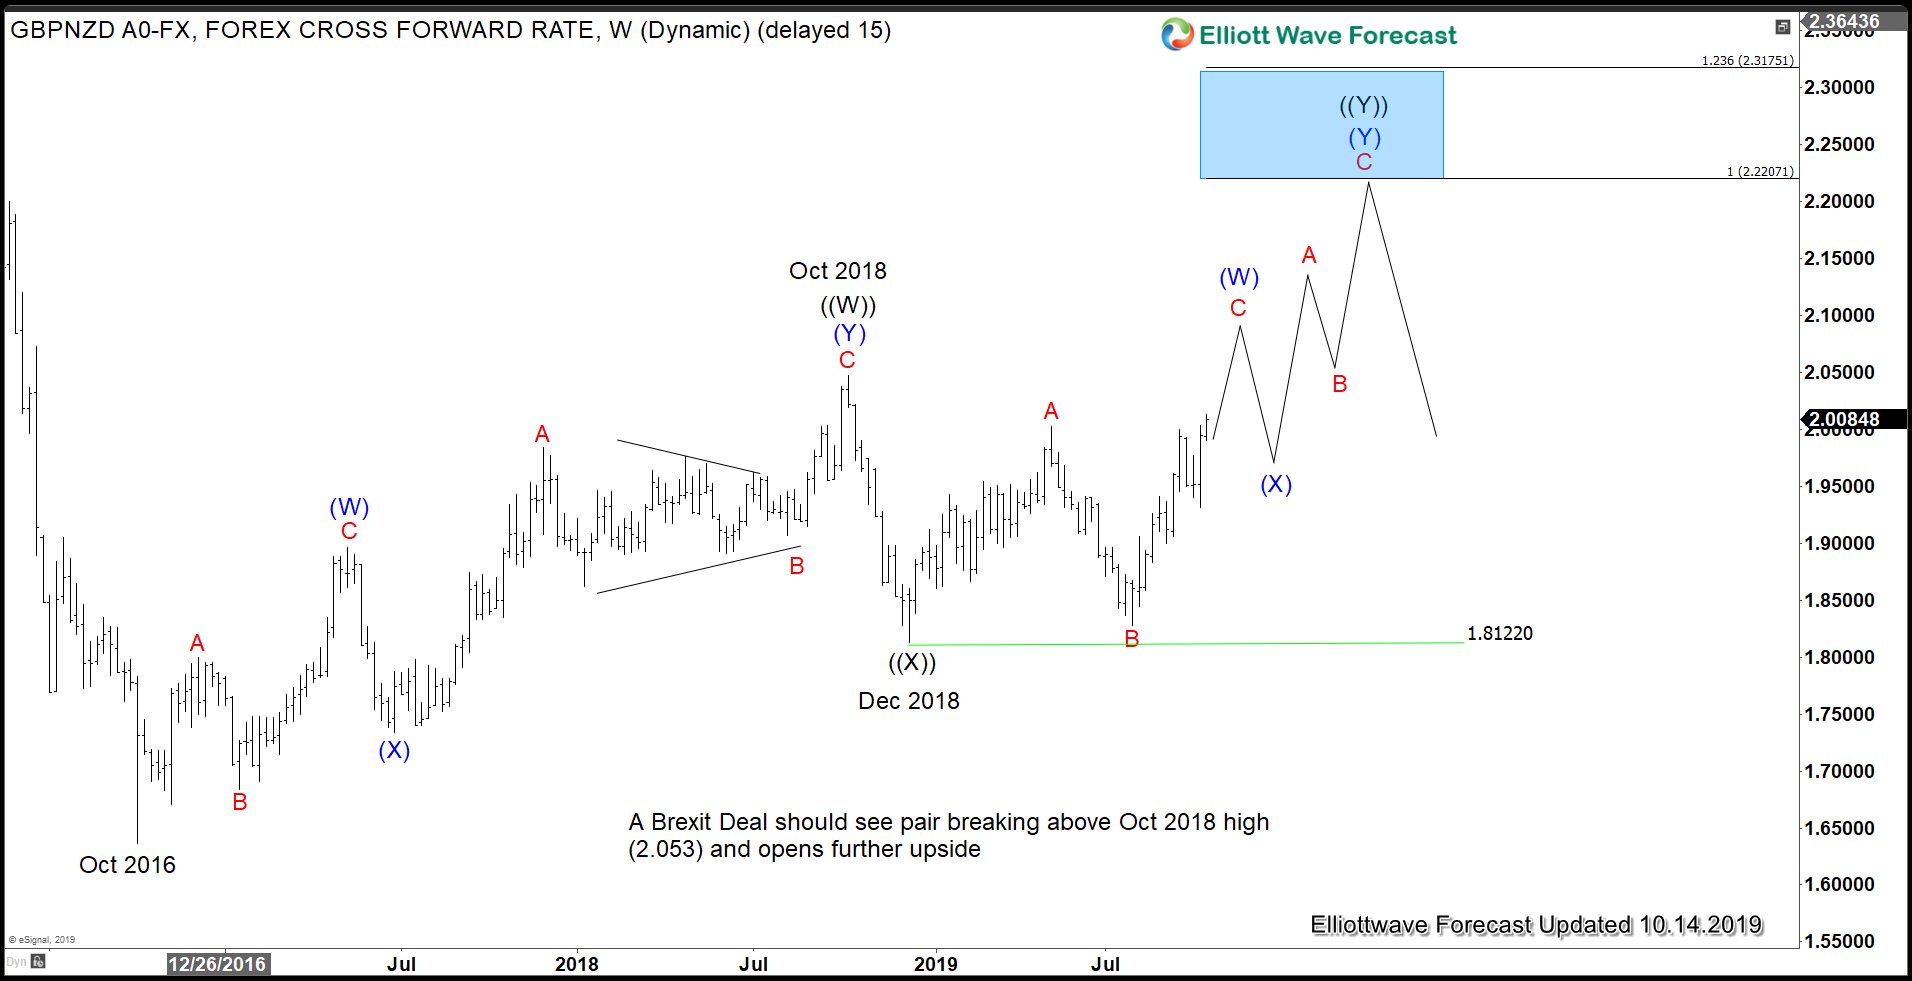
Poundsterling Soars as UK and Irish Leaders Find Pathway to Brexit Deal
Read MoreThe last ditch Brexit talks between British and Irish leaders last week yield unlikely breakthrough. Both leaders issued an upbeat statement after the meeting, saying they see a pathway to a possible deal. The issue of Irish border and the proposed backstop has become the bottleneck in Brexit negotiations. Irish leader Leo Varadkar reportedly said […]
-
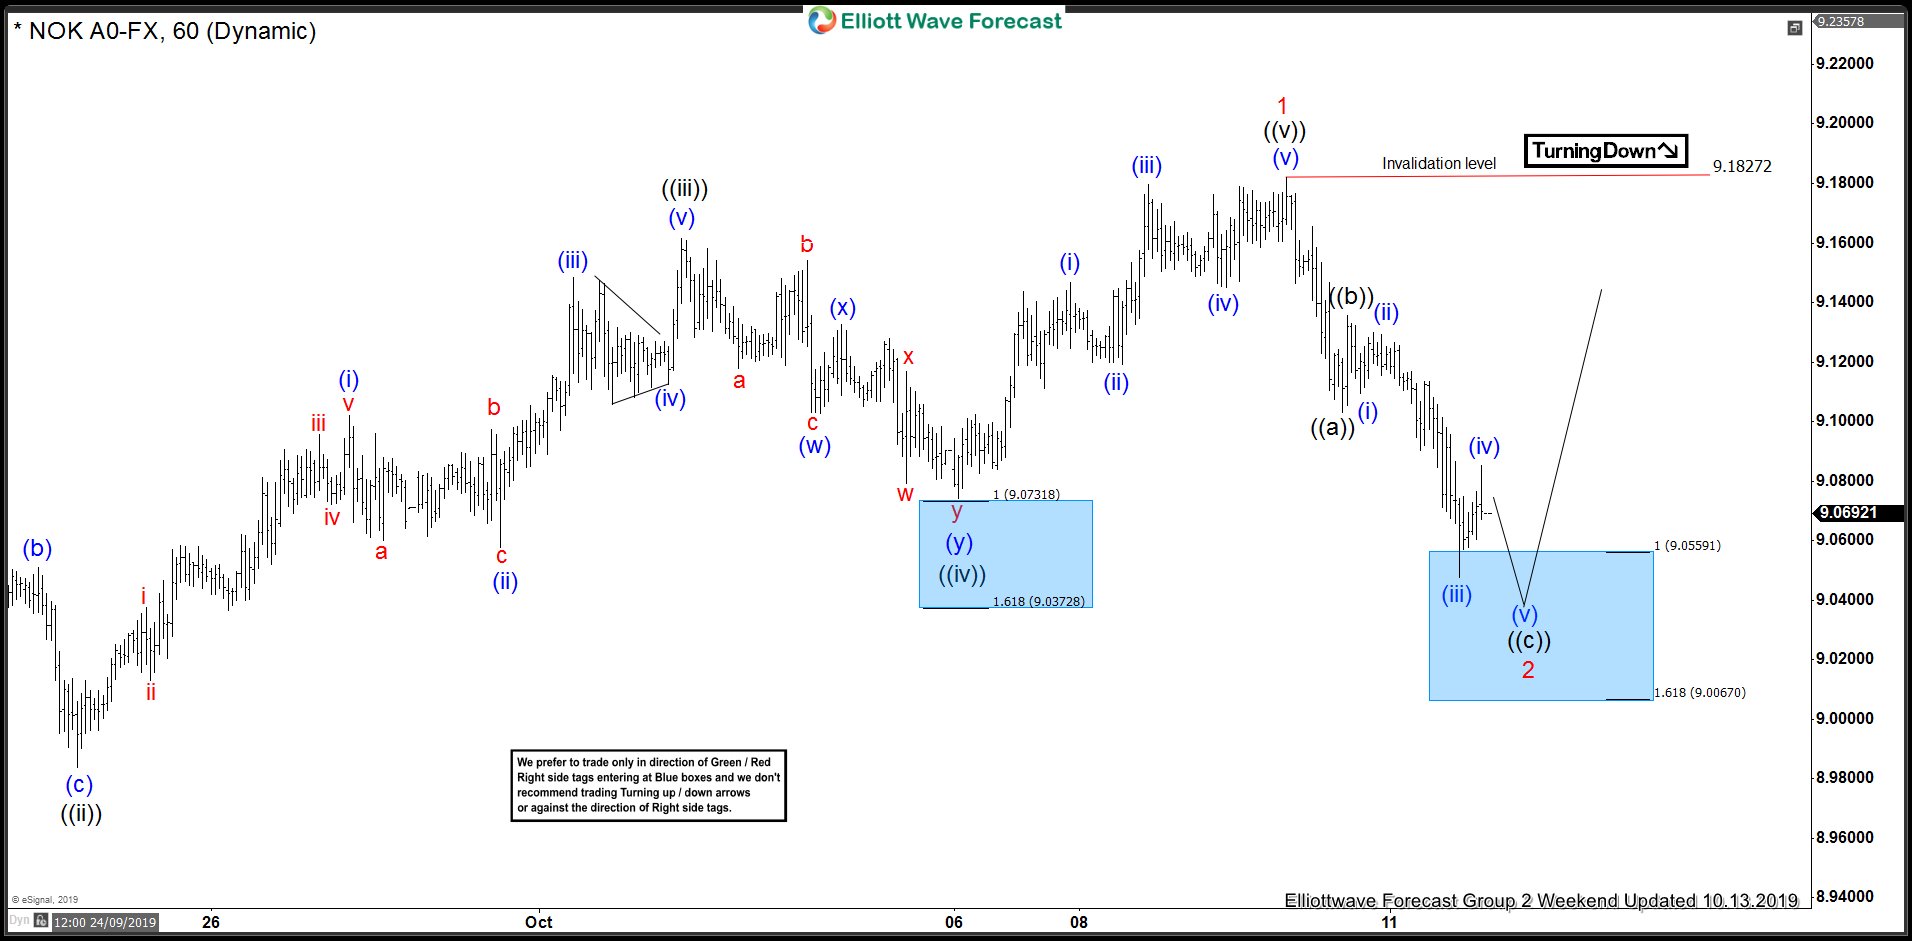
USDNOK Found Intraday Buyers At The Blue Box Area
Read MoreIn this technical blog we’re going to take a quick look at the Elliott Wave charts of USDNOK published in the membership area of the elliottwave-forecast.com . USDNOK broke September 3rd peak , which made the pair bullish against the 8.870 low. Besides that USDNOK made 5 waves up in the short term cycle from […]