
The Power of 3-7-11 and the Grand Super Cycle: How We Saw the Bullish Turn in April 2025 Back on April 9, 2025, while World Indices were dropping sharply and global sentiment had turned overwhelmingly bearish, we published an article that challenged the fear-driven narrative. We explained why selling was not the right approach and […]
-

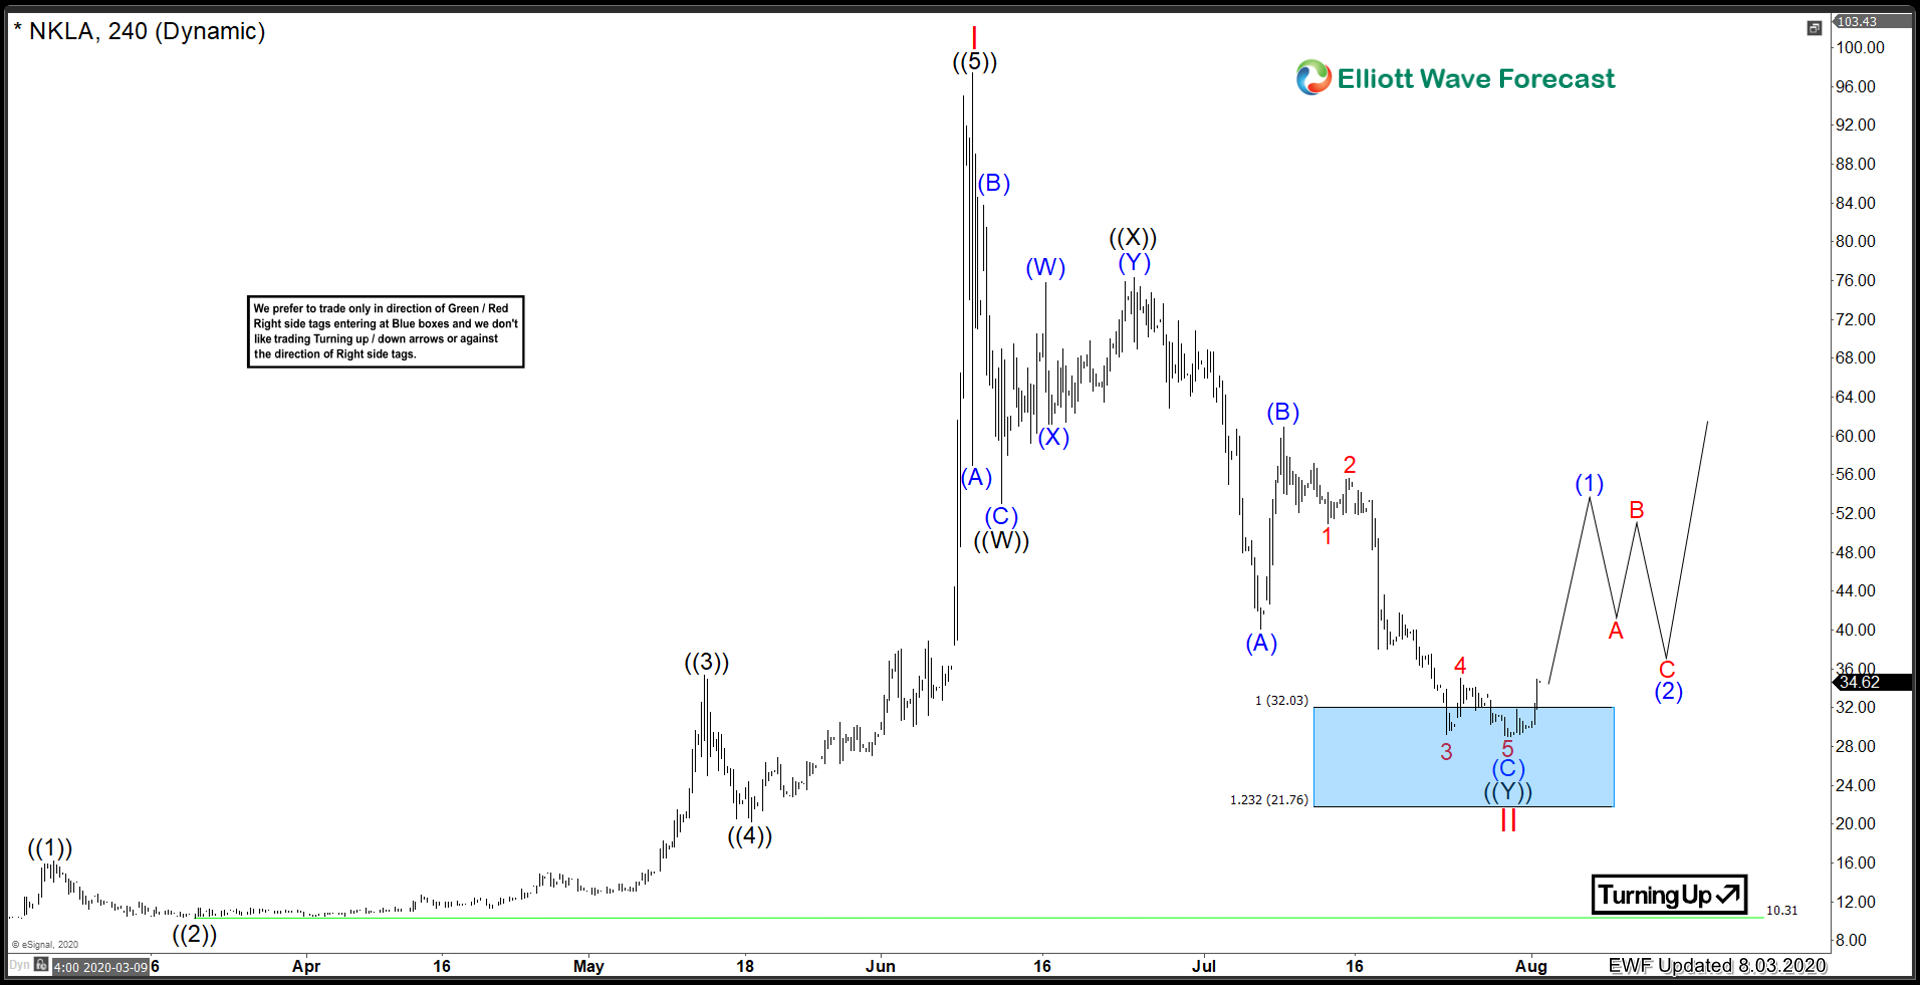
Nikola Corporation ($NKLA) Looking For The Next Leg Up
Read MoreNikola has had quite a stellar 2020. With the stock price running from 10.31 to a high of 97.41 within the span of a few months, there is a lot of eyes on Nikola. They are a zero emissions vehicle manufacturer, using hydrogen cell technology. Lets take a look at the company profile below: “Nikola […]
-

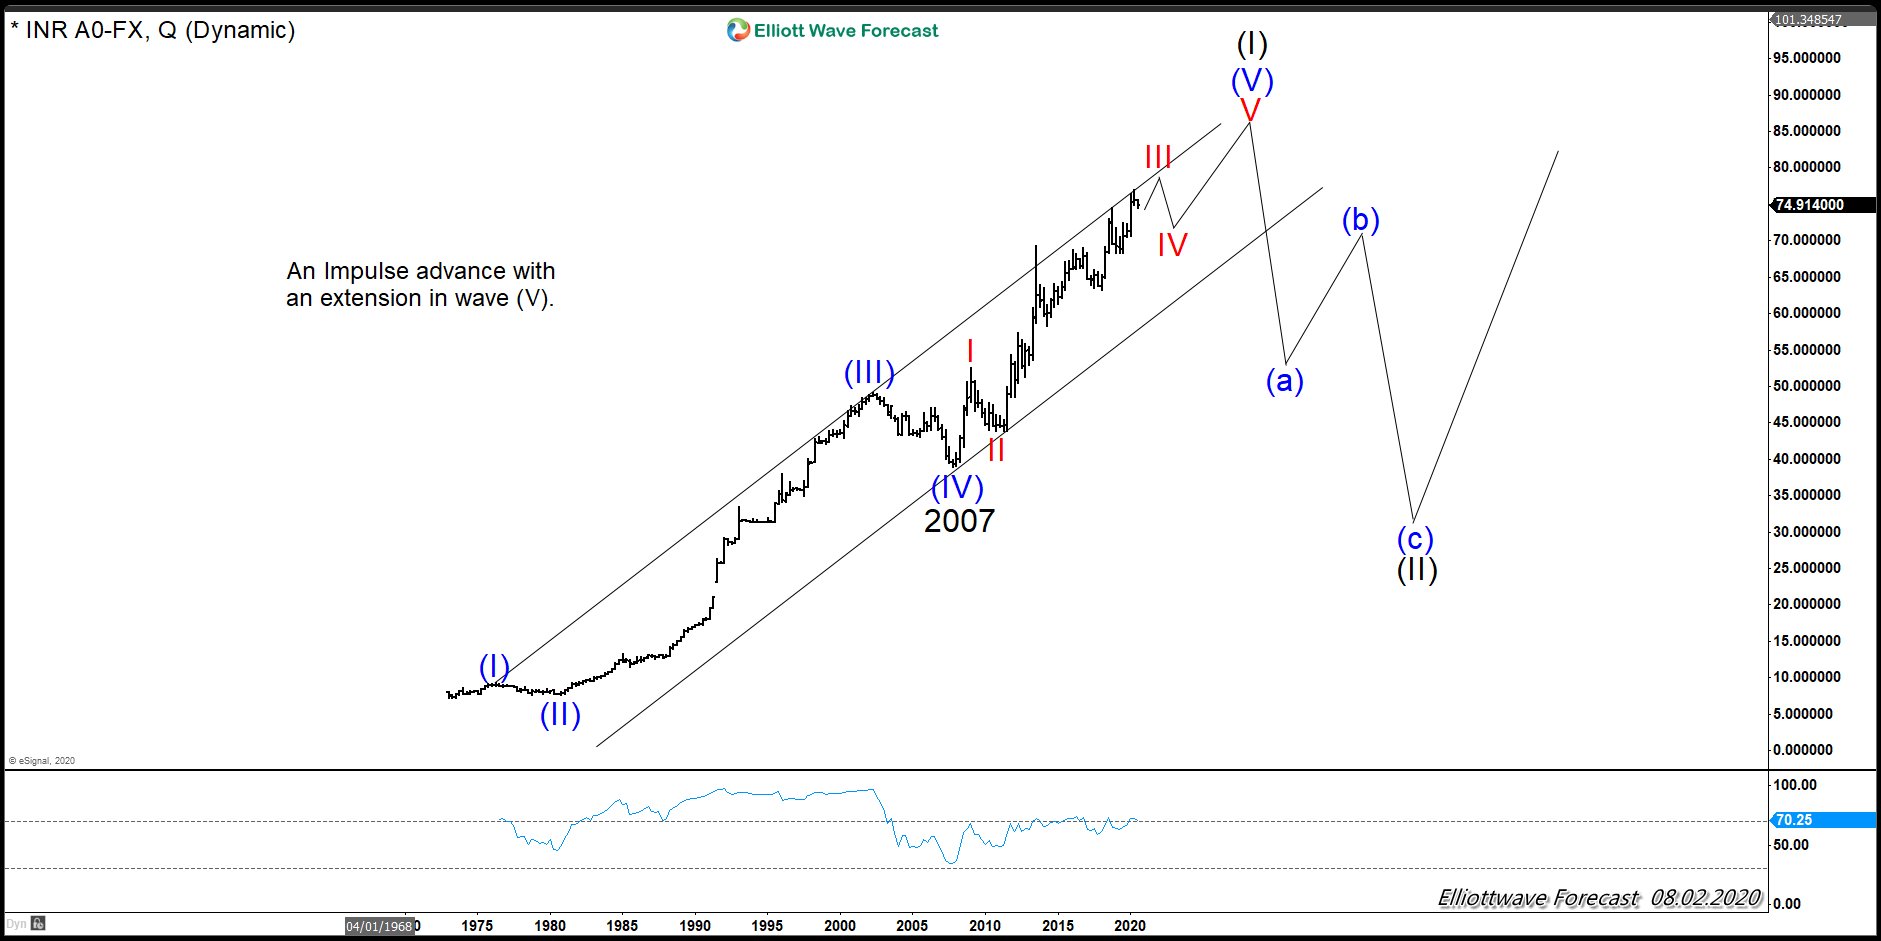
USDINR: The Pair Is Sending A Warning to $USDX
Read MoreThe USDX has been trending higher since the lows in 2008. However, in trading, nothing lasts forever. New traders generally do not last very long in this field, thus most traders only know a strong $USDX due to recency bias. However, in reality, nothing lasts forever, so we at EWF track many different instrument to be able […]
-

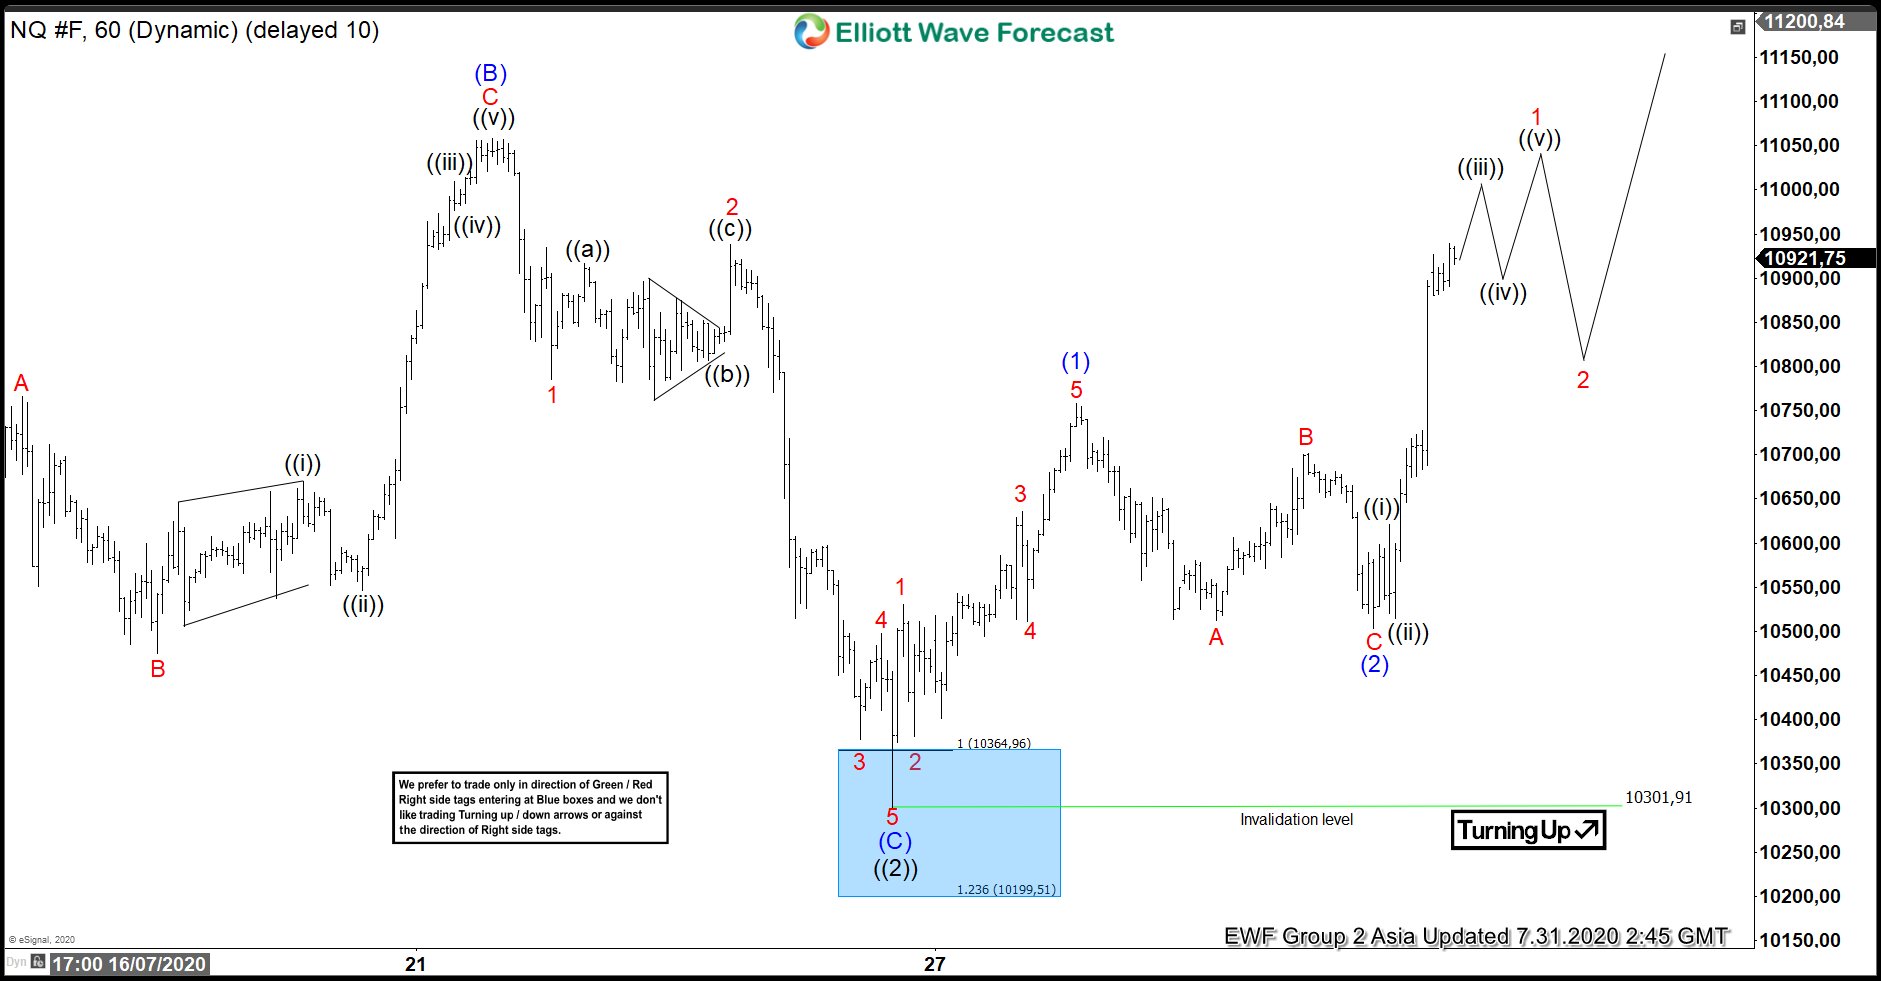
Elliott Wave View: Nasdaq Attempting for New Record
Read MoreNASDAQ ended pullback from July 13 peak as a flat correction at blue box. While above July 24 low, expect dips in 3,7 or 11 swing to be supported.
-

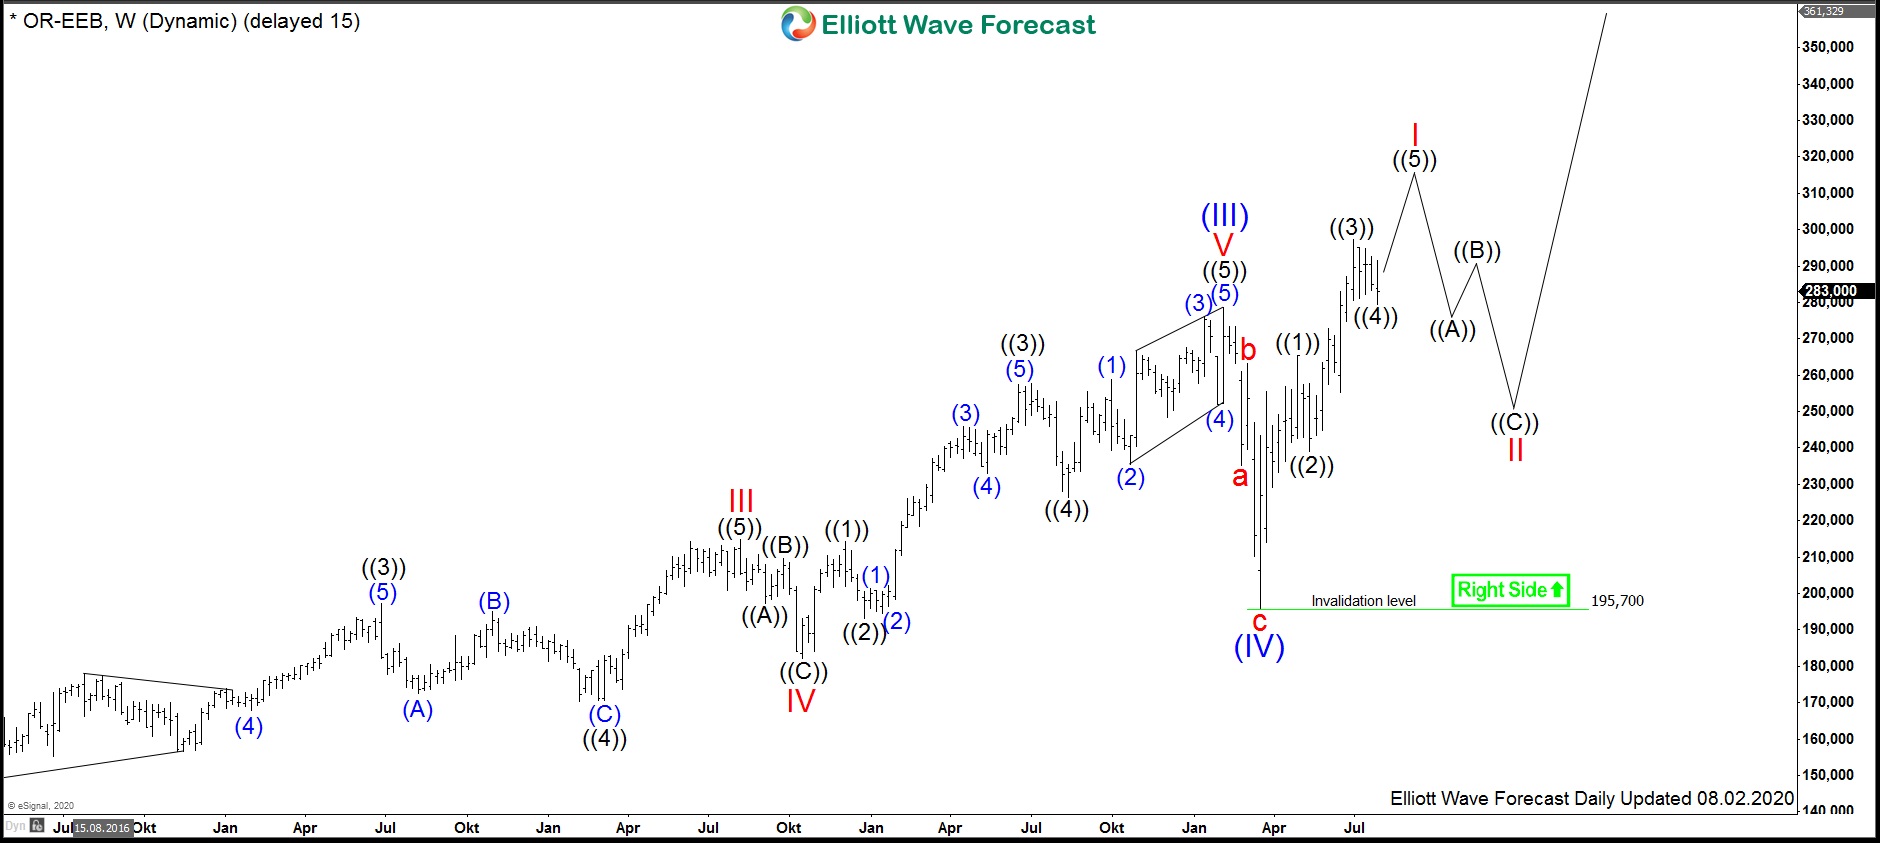
$OR: Giant of Cosmetics l’Oréal Remains Strong During Lockdown
Read MoreL’Oréal S.A. is the world largest cosmetics and beauty company. Headquartered in Clichy, France, the field of activities concentrates on skin care, hair color, perfume, make-up, hair care, sun protection etc. L’Oréal is a part of Euro Stoxx 50 (SX5E) and CAC40 indices. Investors can trade it under the ticker $OR at Euronext Paris. As […]