
-
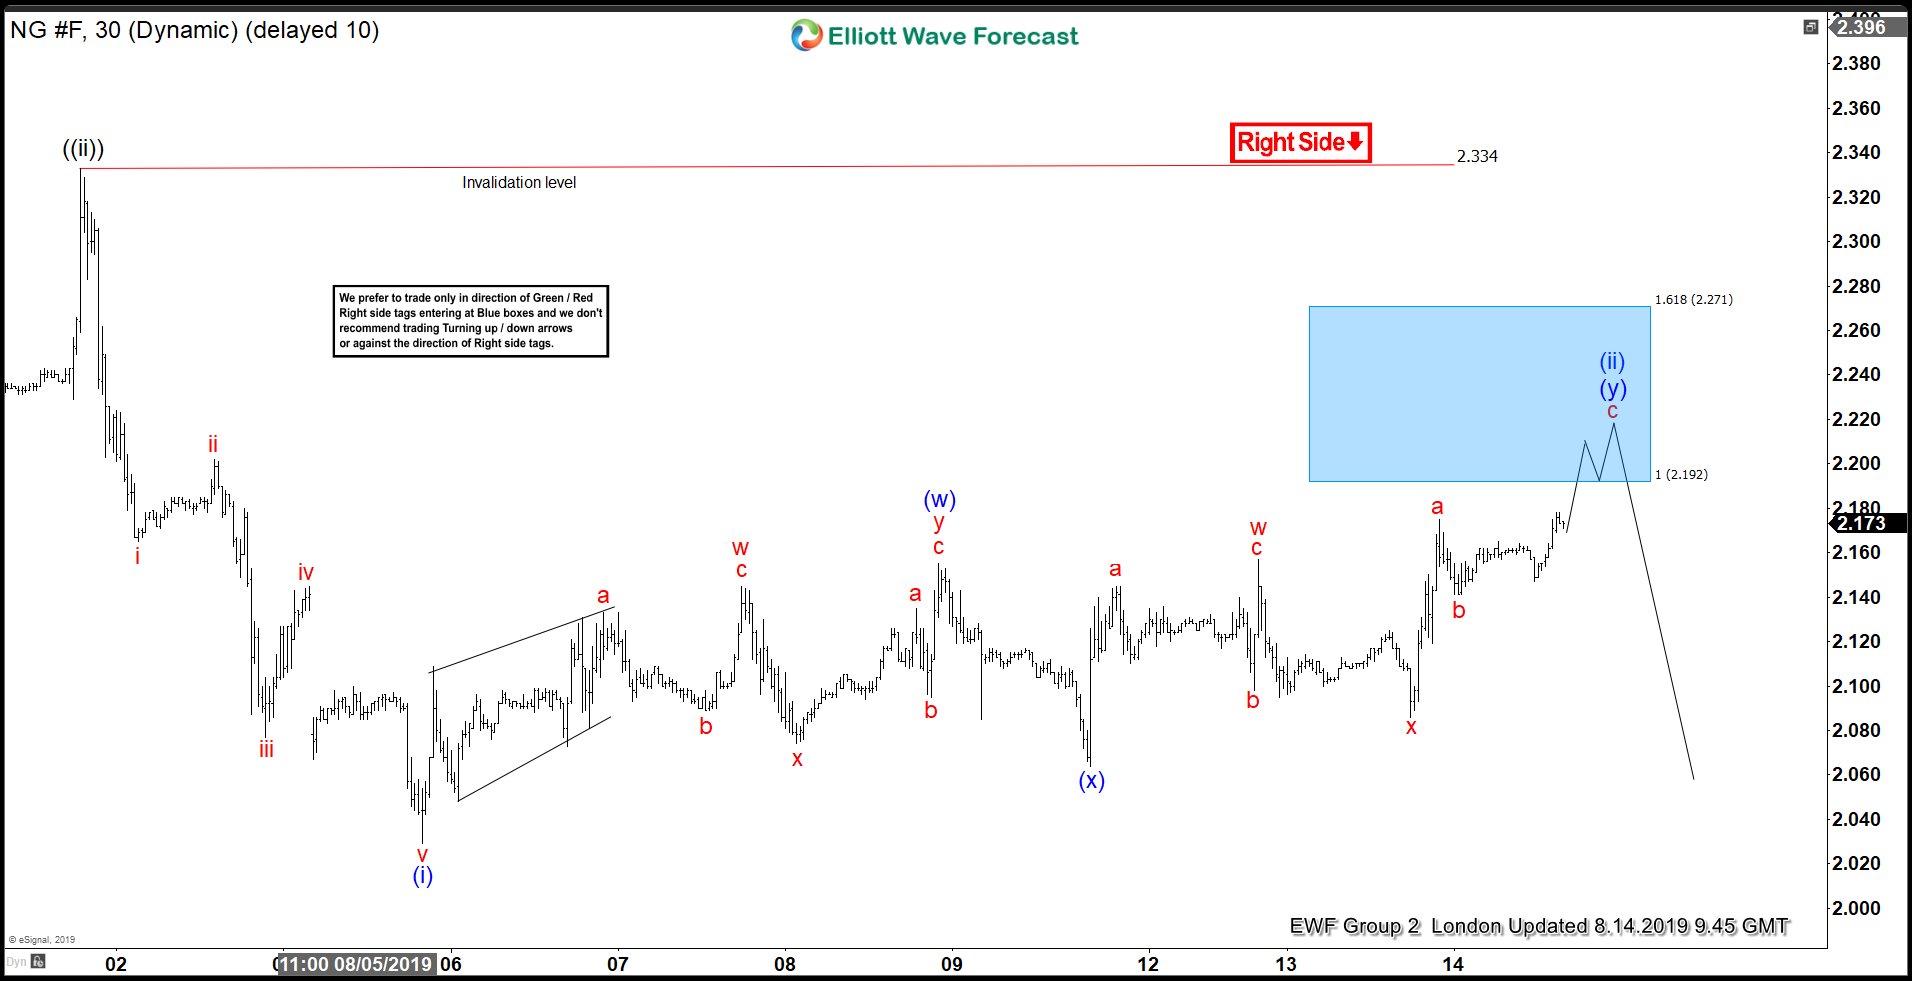
Natural Gas Found Sellers At The Blue Box
Read MoreIn this technical blog we’re going to take a quick look at the Elliott Wave charts of Natural Gas, published in members area of the website. As our members know, Natural Gas has incomplete bearish sequences in the cycle from the 2.493 (July 10th) peak. Consequently, we advised members to avoid buying the commodity and […]
-
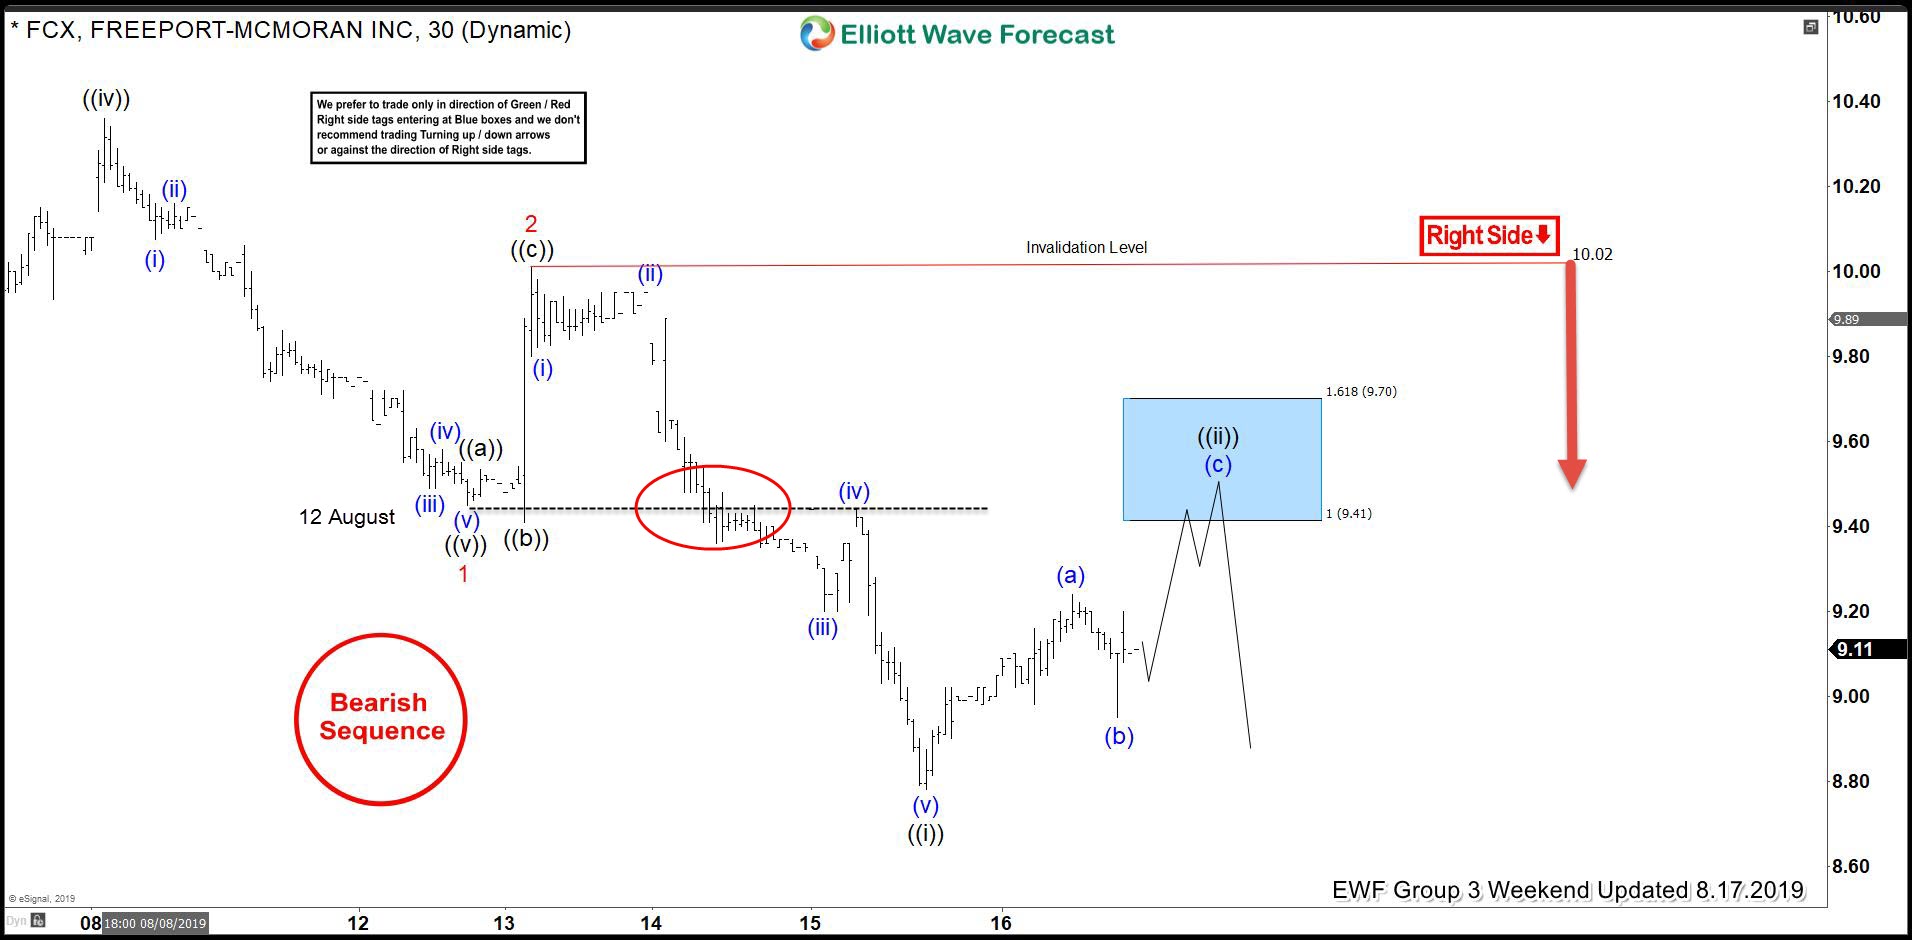
FCX Found Sellers In The Blue Box
Read MoreHello fellow traders. In this technical blog we’re going to take a quick look at the Elliott Wave charts of FCX, published in members area of the website. As our members know, FCX has incomplete bearish sequences in the cycle from the 12.16 ( July 24th) peak. Consequently, we advised members to avoid buying the […]
-
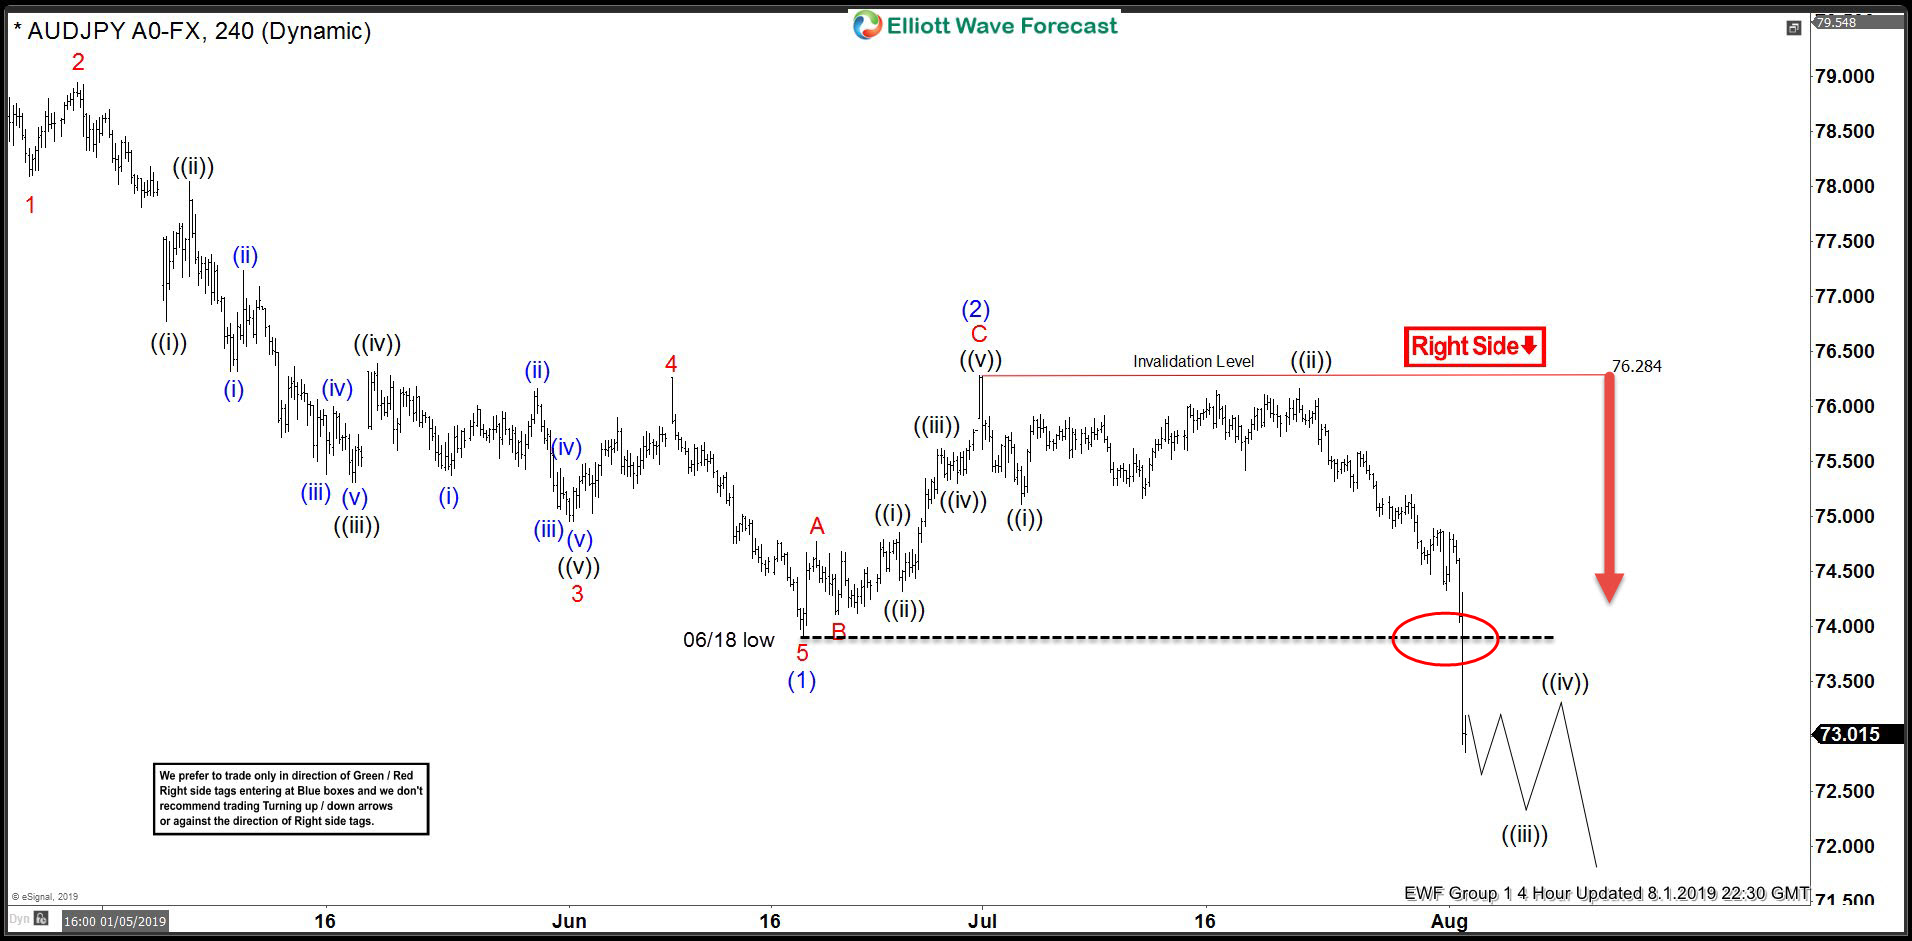
AUDJPY Selling The Rallies In The Blue Box
Read MoreHello fellow traders. Another instrument that we have been trading lately is AUDJPY. In this technical blog we’re going to take a quick look at the Elliott Wave charts of AUDJPY, published in members area of the website. As our members know, AUDJPY has incomplete bearish sequences in the cycle from the 04/17 peak. Consequently, […]
-
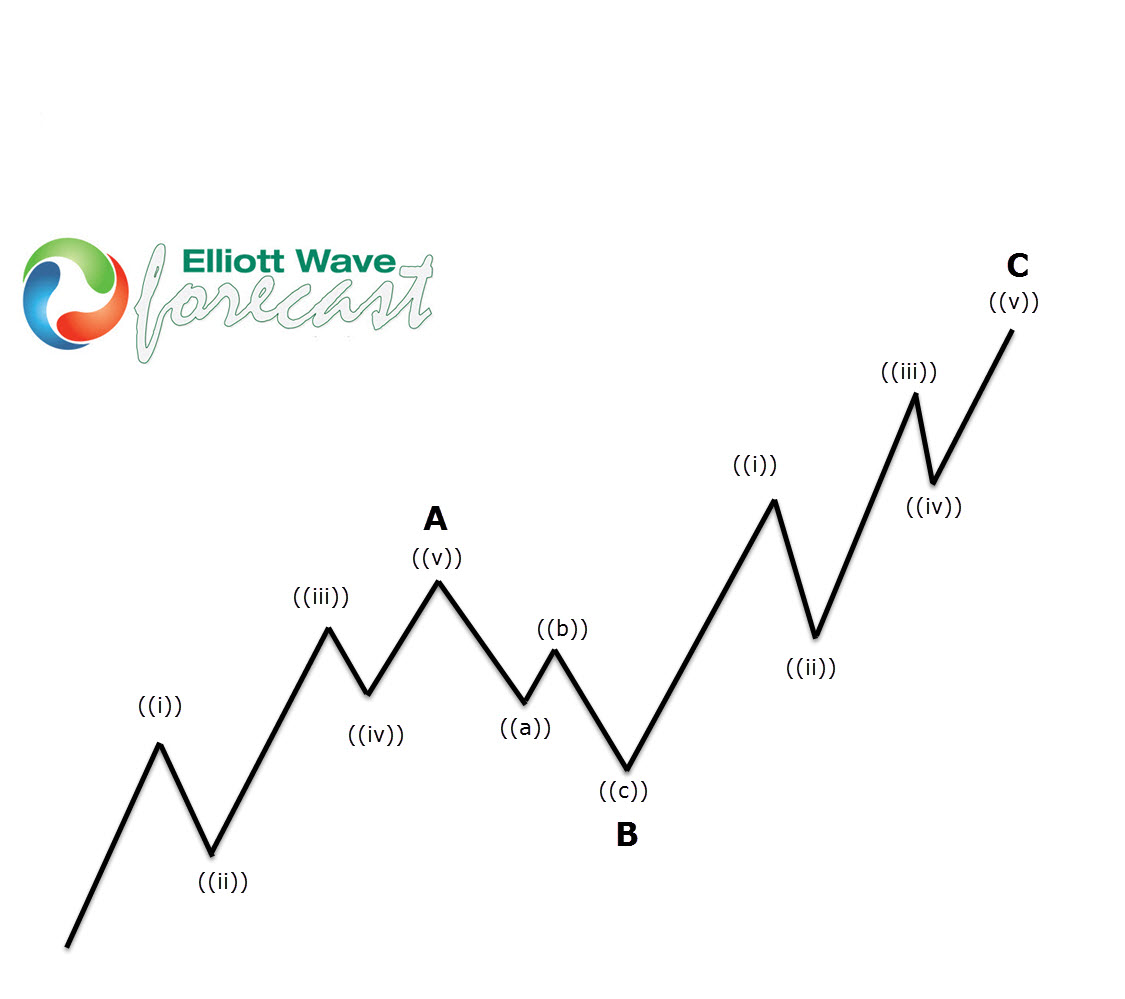
Copper Forecasting The Decline After Elliott Wave Zig Zag
Read MoreHello fellow traders. In this technical blog we’re going to take a quick look at the Elliott Wave charts of Copper. As our members know , we were calling for decline in Copper. Recently Copper corrected cycle from the April 17th peak. Recovery unfolded as Elliott Wave Zig Zag pattern (A)(B)(C). Once the price reached […]
-
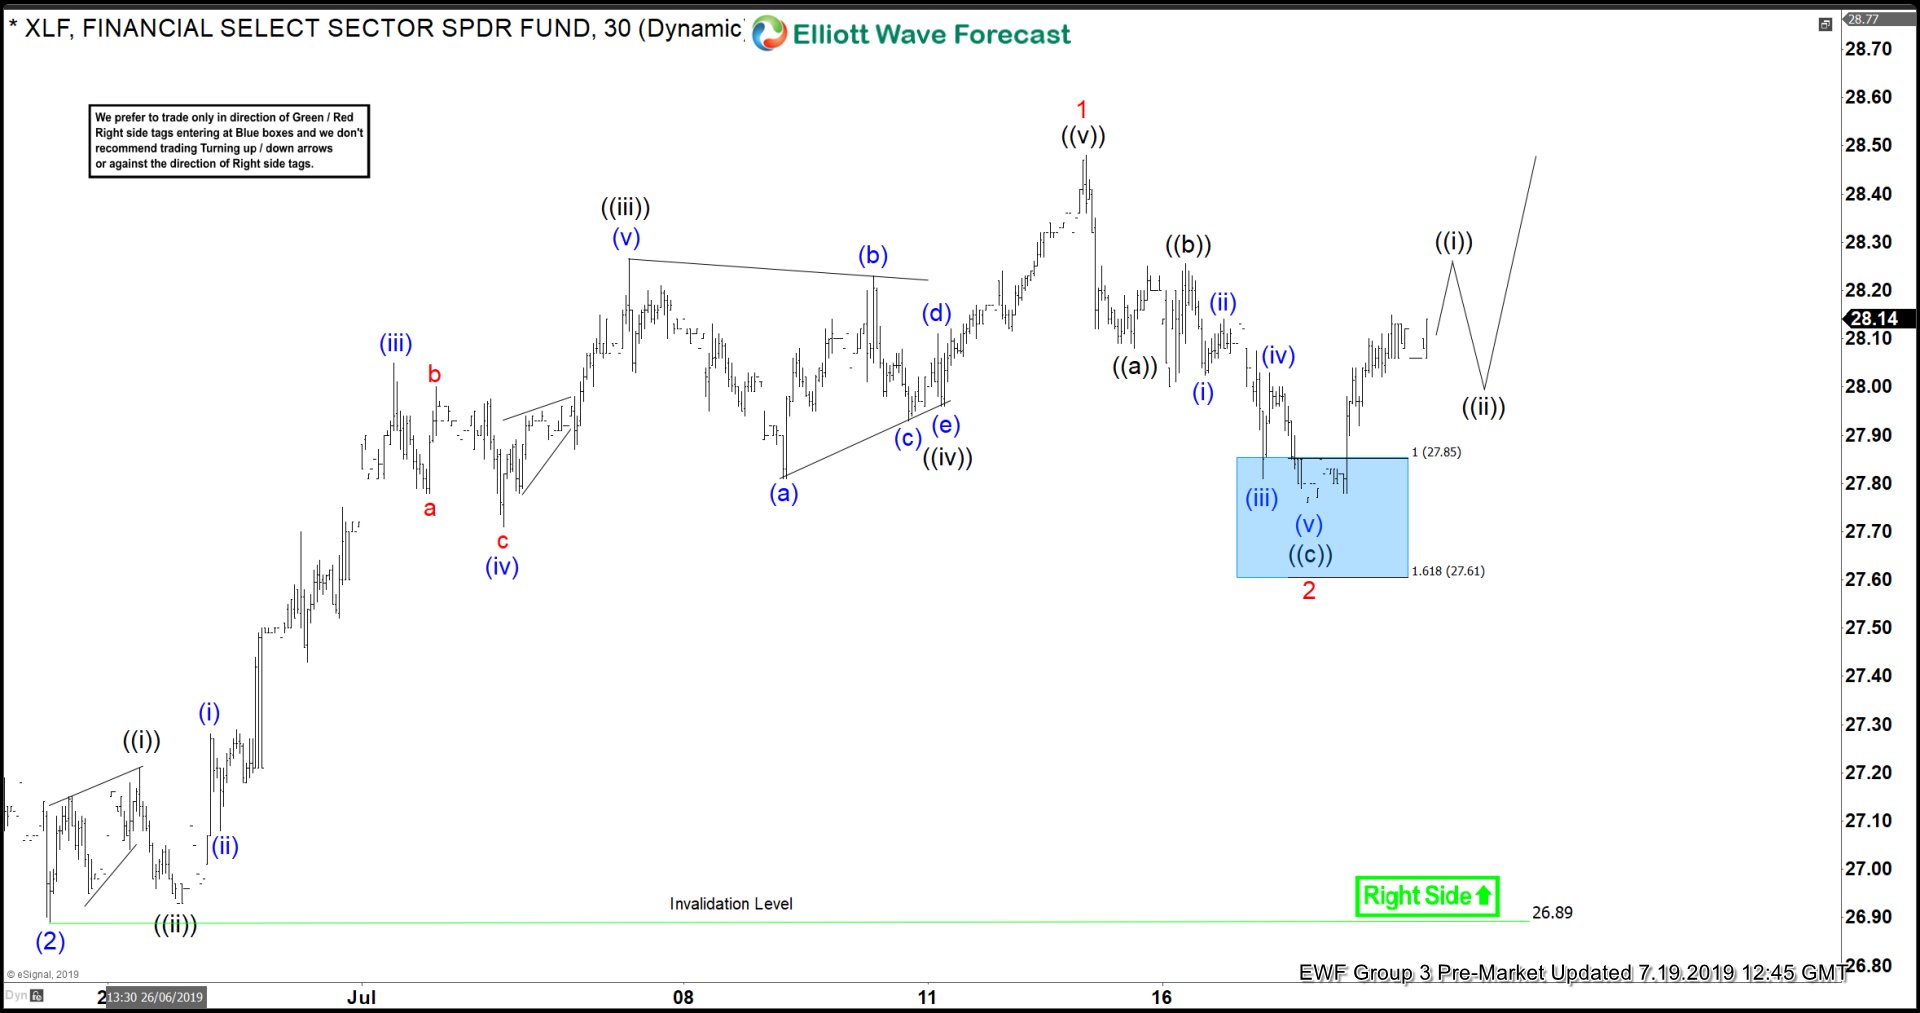
XLF Buying The Dips At The Blue Box
Read MoreHello fellow traders. In this technical blog we’re going to take a quick look at the Elliott Wave charts of XLF ( Financial Select Sector), published in members area of the website. Break of April 26th peak made December 2018 Cycle incomplete to the upside .Consequently XLF is bullish against the 25.72 low. We advised […]
-
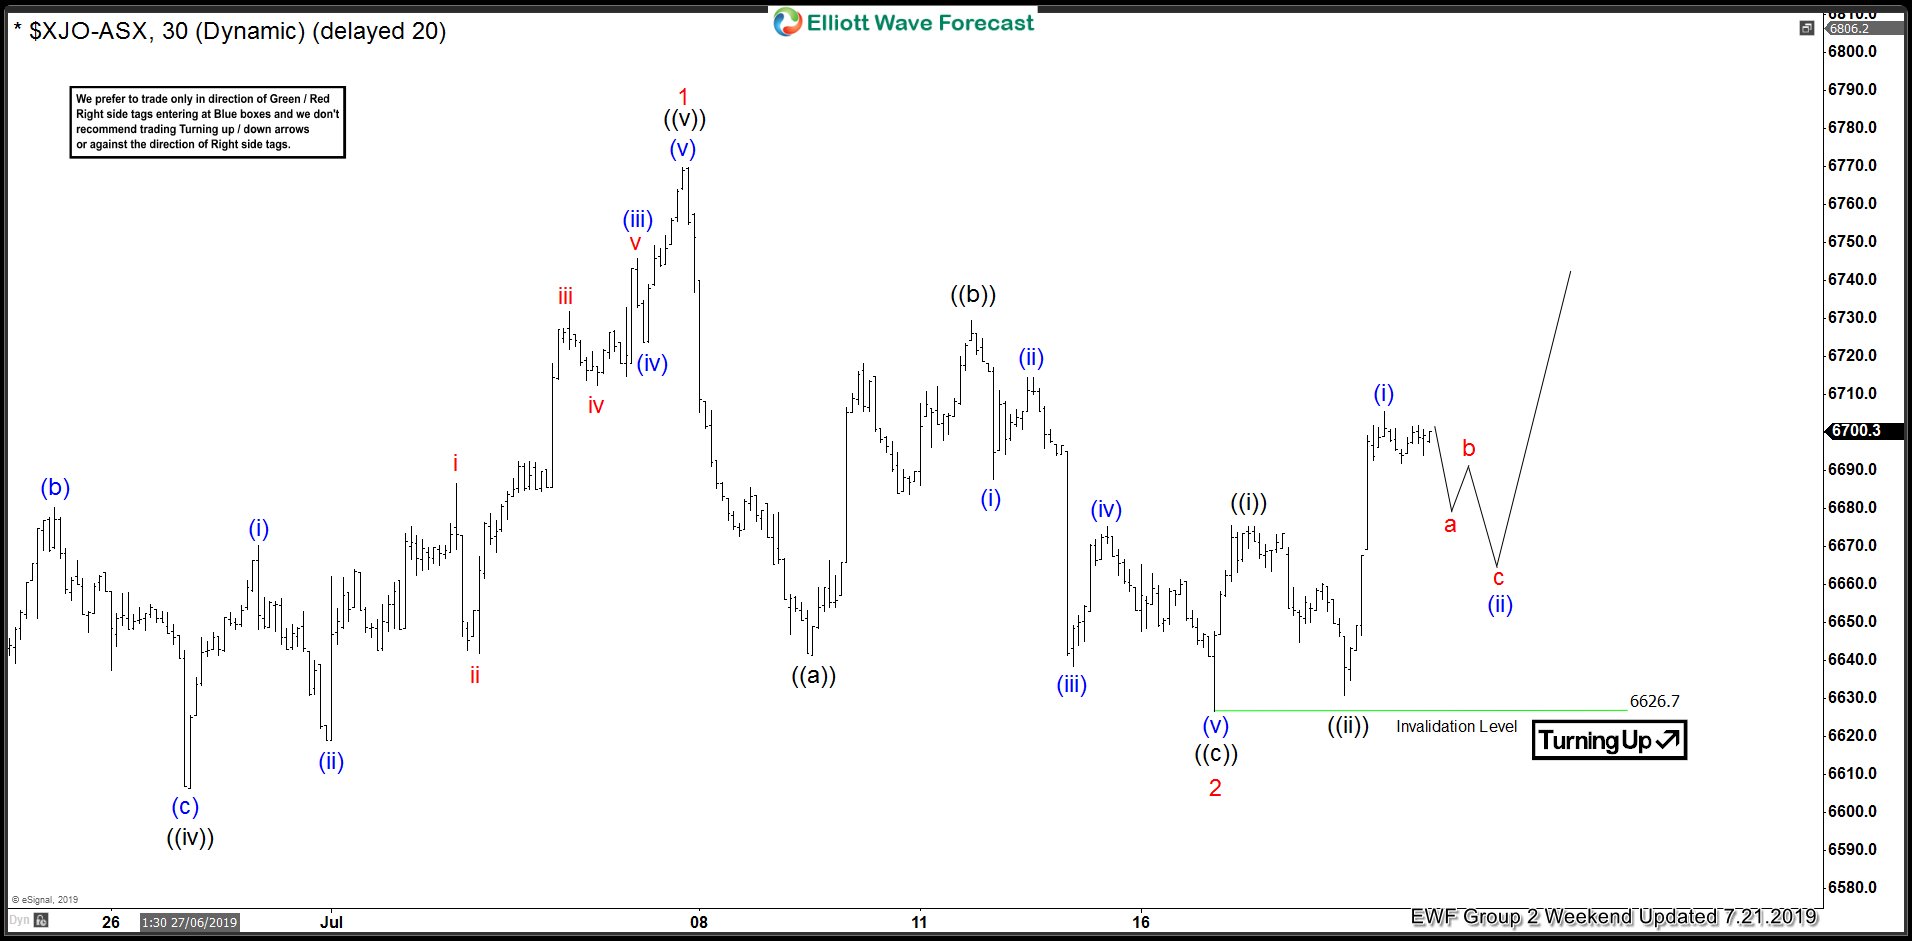
$ASX Forecasting The Rally After Elliott Wave Zig Zag Pattern
Read MoreHello fellow traders. In this technical blog we’re going to take a quick look at the Elliott Wave charts of ASX. As our members know ASX is another Index that is showing incomplete bullish sequences in the cycle from the December 2018 low. Rally from the 5413.6 low is showing incomplete impulsive structure, calling for […]