-

S&P 500 E-Mini (ES_F) Elliott Wave: Forecasting the Rally From Equal Legs Zone
Read MoreHello traders ! In this technical article, we’re going to take a quick look at the Elliott Wave charts of the S&P 500 E-Mini (ES_F Futures) , published in the members area of the website. As our members know, $ES_F recently pulled back and found buyers at the equal legs area. The main outlook remains […]
-

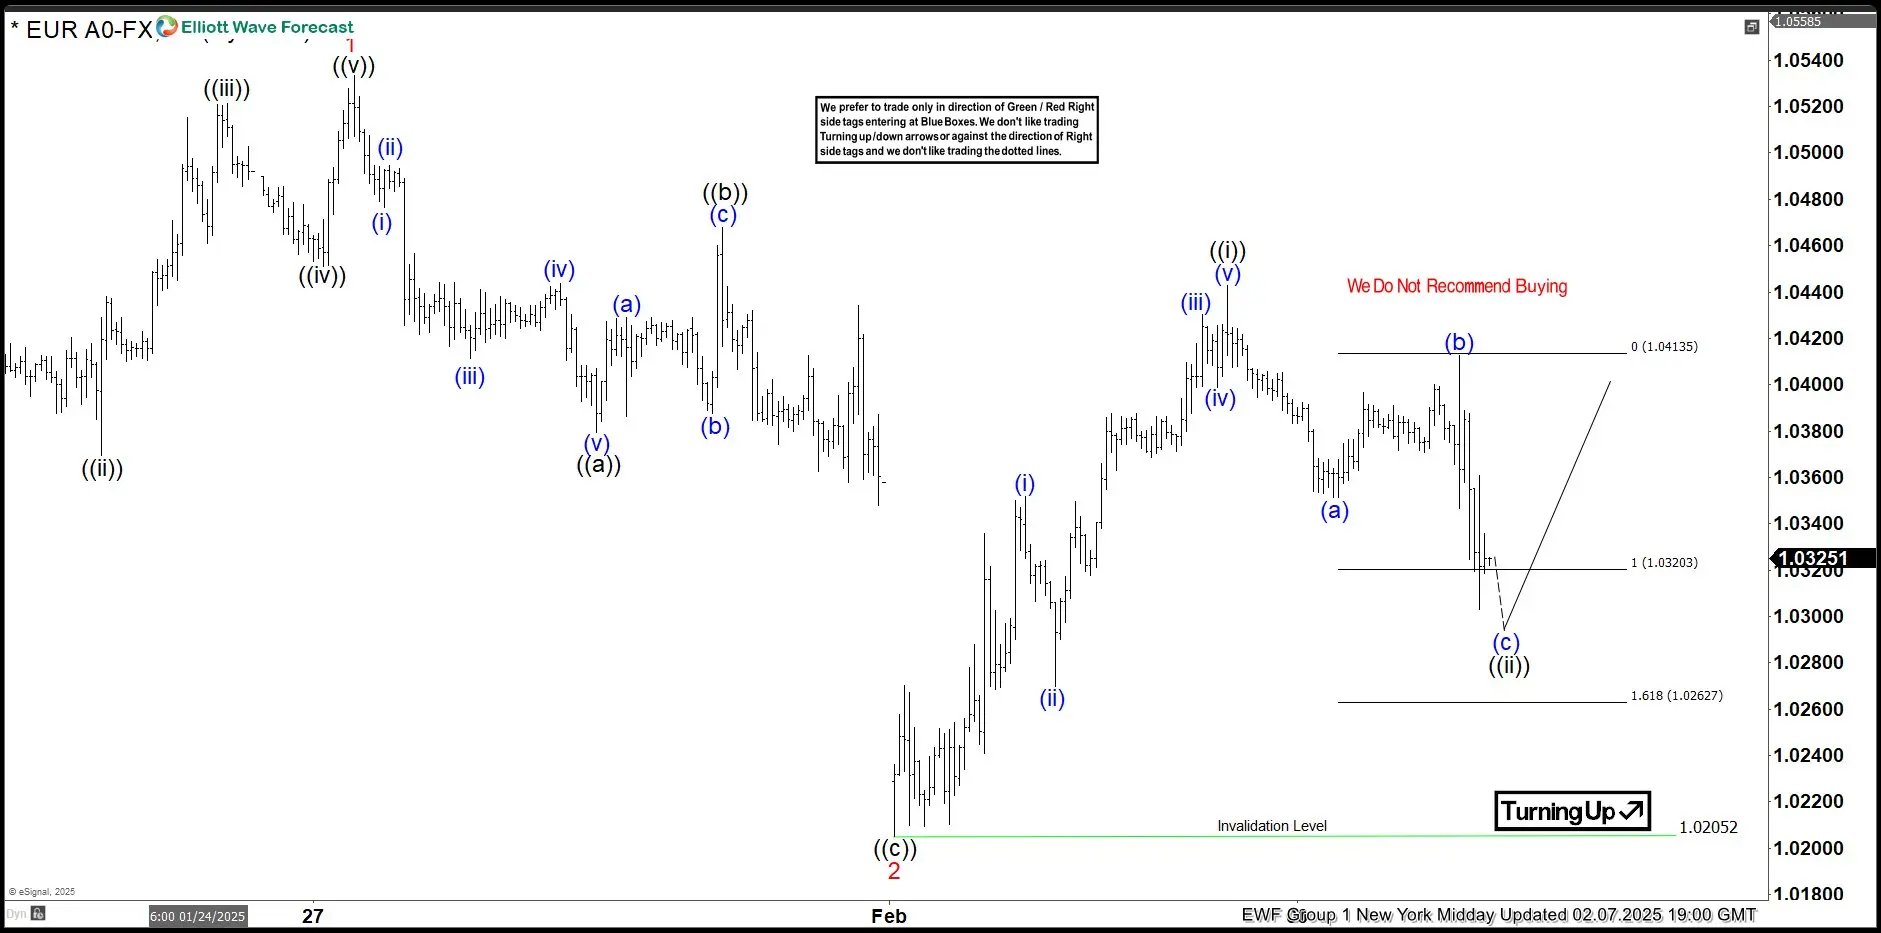
EURUSD Found Buyers After 3 Waves Pull Back
Read MoreHello fellow traders, In this technical article we’re going to take a look at the Elliott Wave charts charts of EURUSD forex pair published in members area of the website. As our members know, recently EURUSD made a 3-wave pullback that completed right at the equal legs level. In the following sections, we will analyze […]
-

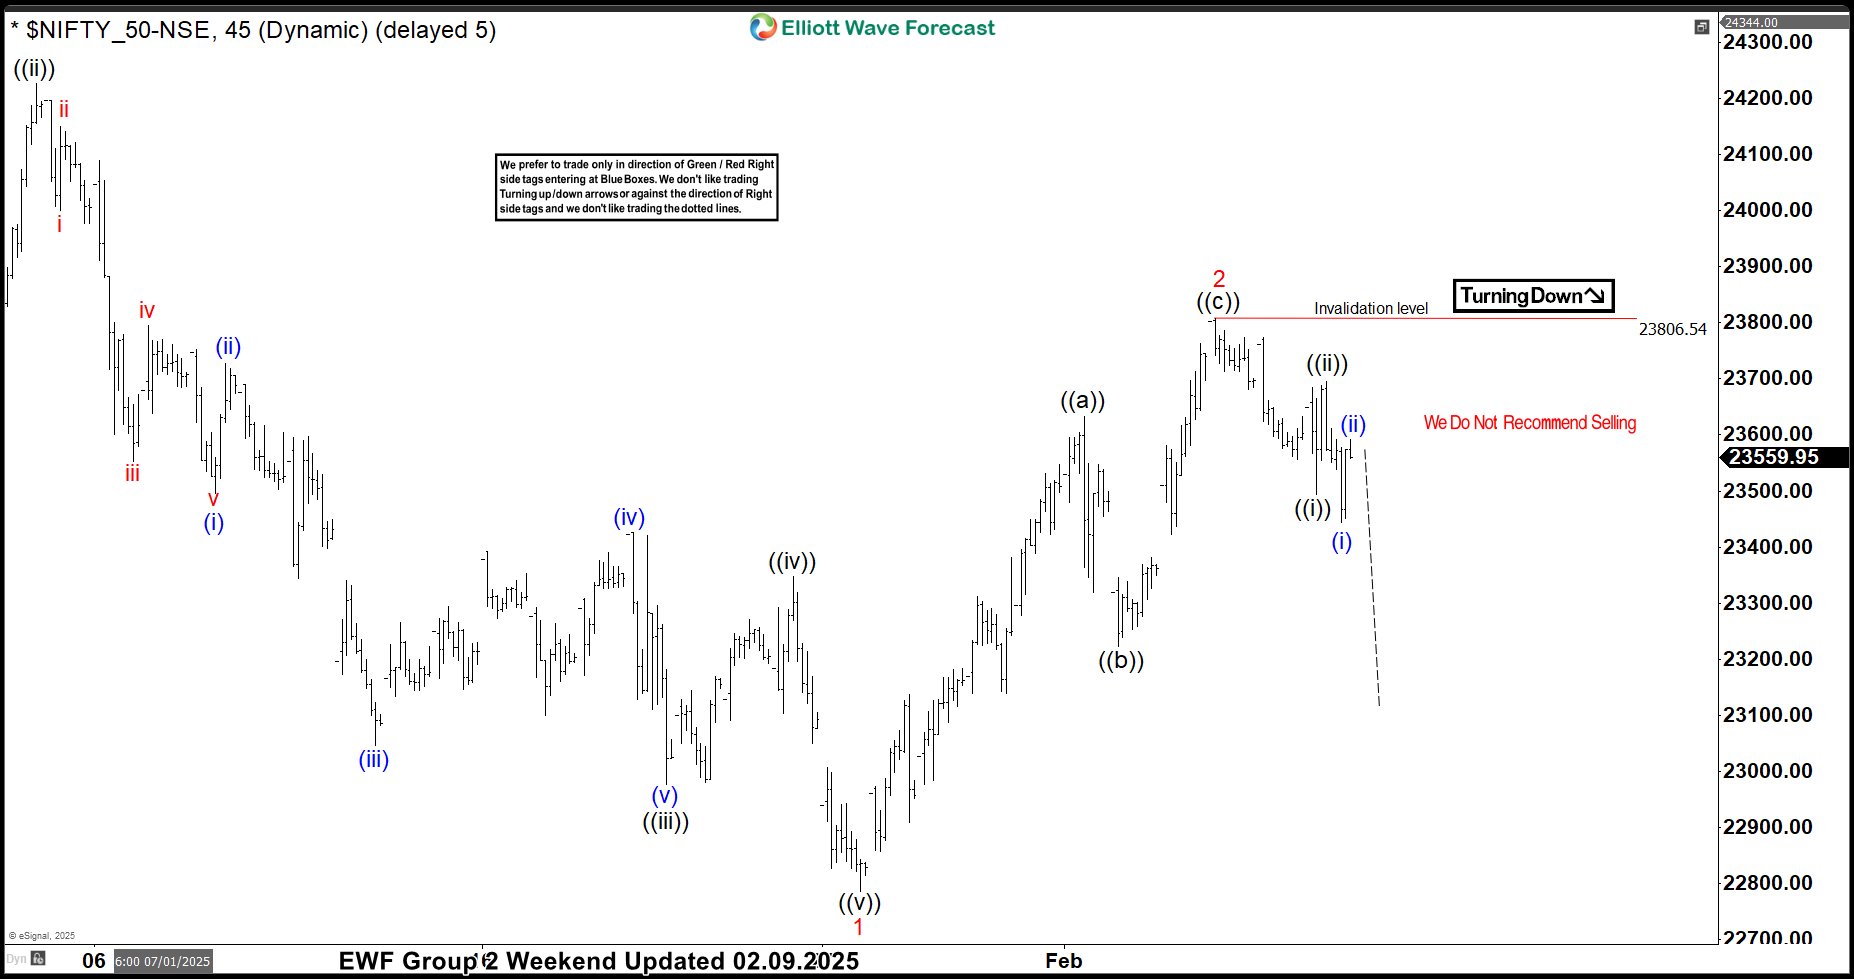
NIFTY Elliott Wave: Incomplete Sequences Forecasting the Future Path
Read MoreHello fellow traders. In this technical article we’re going to look at the Elliott Wave charts of NIFTY Index published in members area of the website. As our members know , the Index shows incomplete sequences in the cycle from the 26281.55 peak. The price structure calls for further weakness in NIFTY. The index is targeting 21836 […]
-

Tesla Stock (TSLA) Elliott Wave Forecasting the Decline
Read MoreHello fellow traders. In this technical article we’re going to look at the Elliott Wave charts of Tesla Stock ( TSLA ) published in members area of the website. As most traders probably know, the stock is in an overall bullish trend. However, in the short-term cycle from the 488.78 peak, the price has formed a […]
-

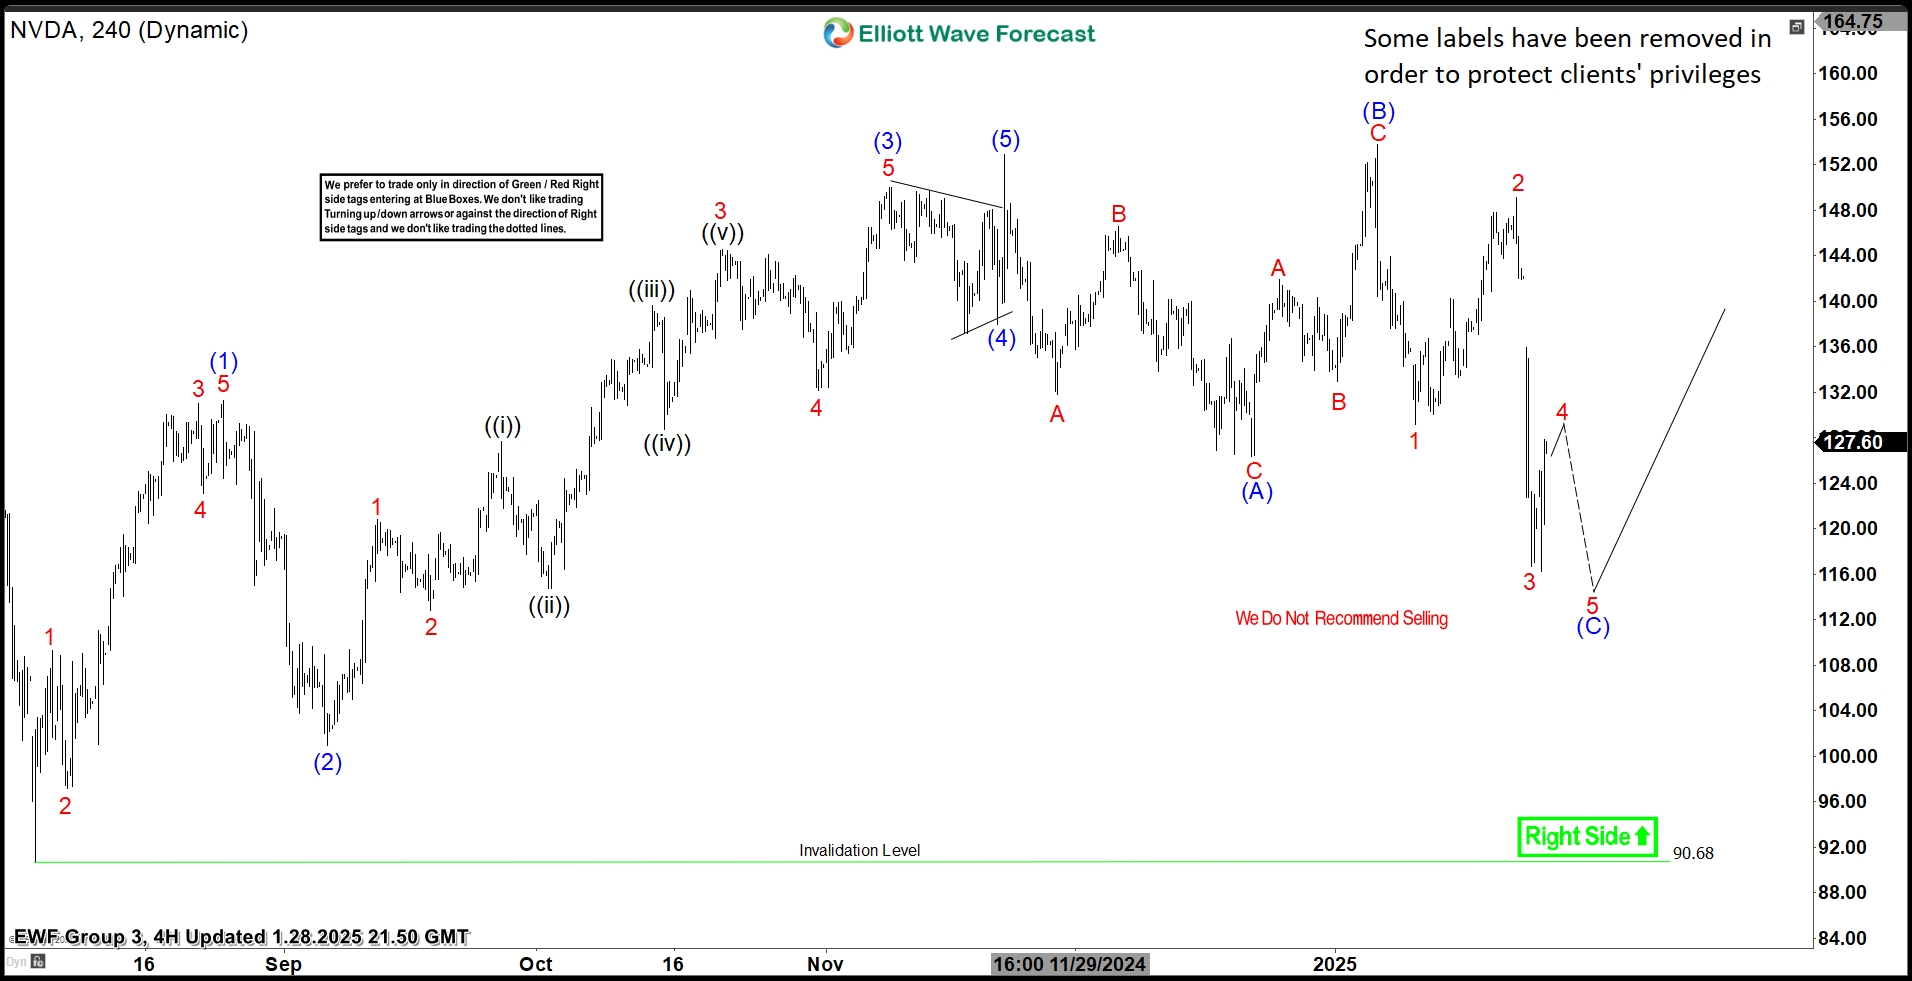
Nvidia Stock (NVDA): Elliott Wave Irregular Flat Pattern Analysis
Read MoreIn this technical article we’re going to take a look at the Elliott Wave charts charts of Nvidia Stock (NVDA) published in members area of the website. As our members know, we generally favor the long side in NVDA, due to impulsive bullish sequences. Recently, the stock has corrected the cycle from the August 90.68 […]
-

S&P 500 E-Mini (ES_F) Elliott Wave:Forecasting the Future Path
Read MoreHello traders ! In this technical article, we’re going to take a quick look at the Elliott Wave charts of the S&P 500 E-Mini (ES_F Futures) , published in the members area of the website. As our members know, $ES_F recently provided a solid trading setup. The main outlook remains bullish, with the market currently […]