
-
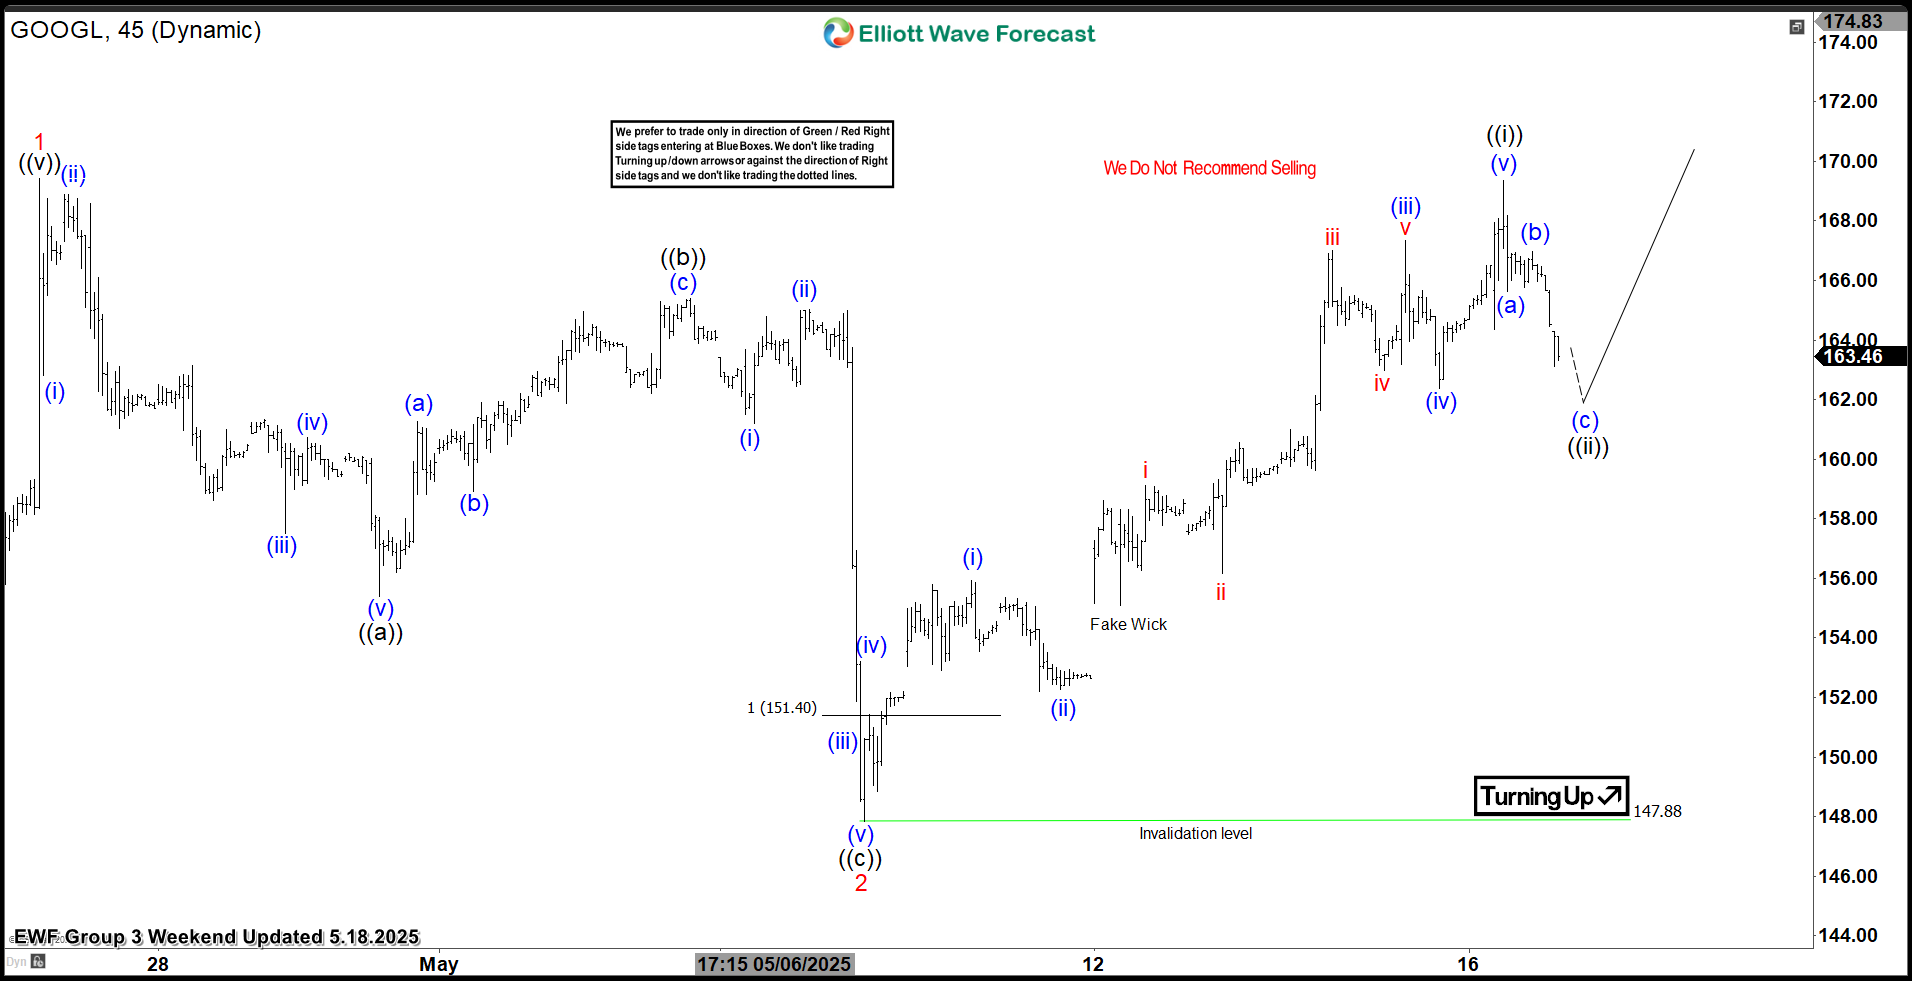
Alphabet Inc. $GOOGL Extreme Areas Offering Buying Opportunities
Read MoreHello everyone! In today’s article, we’ll examine the recent performance of Alphabet Inc. ($GOOGL) through the lens of Elliott Wave Theory. We’ll review how the rally from the May 7, 2025 low unfolded as a 5-wave impulse followed by a 3-swing correction (ABC) and discuss our forecast for the next move. Let’s dive into the structure and expectations for this stock. […]
-
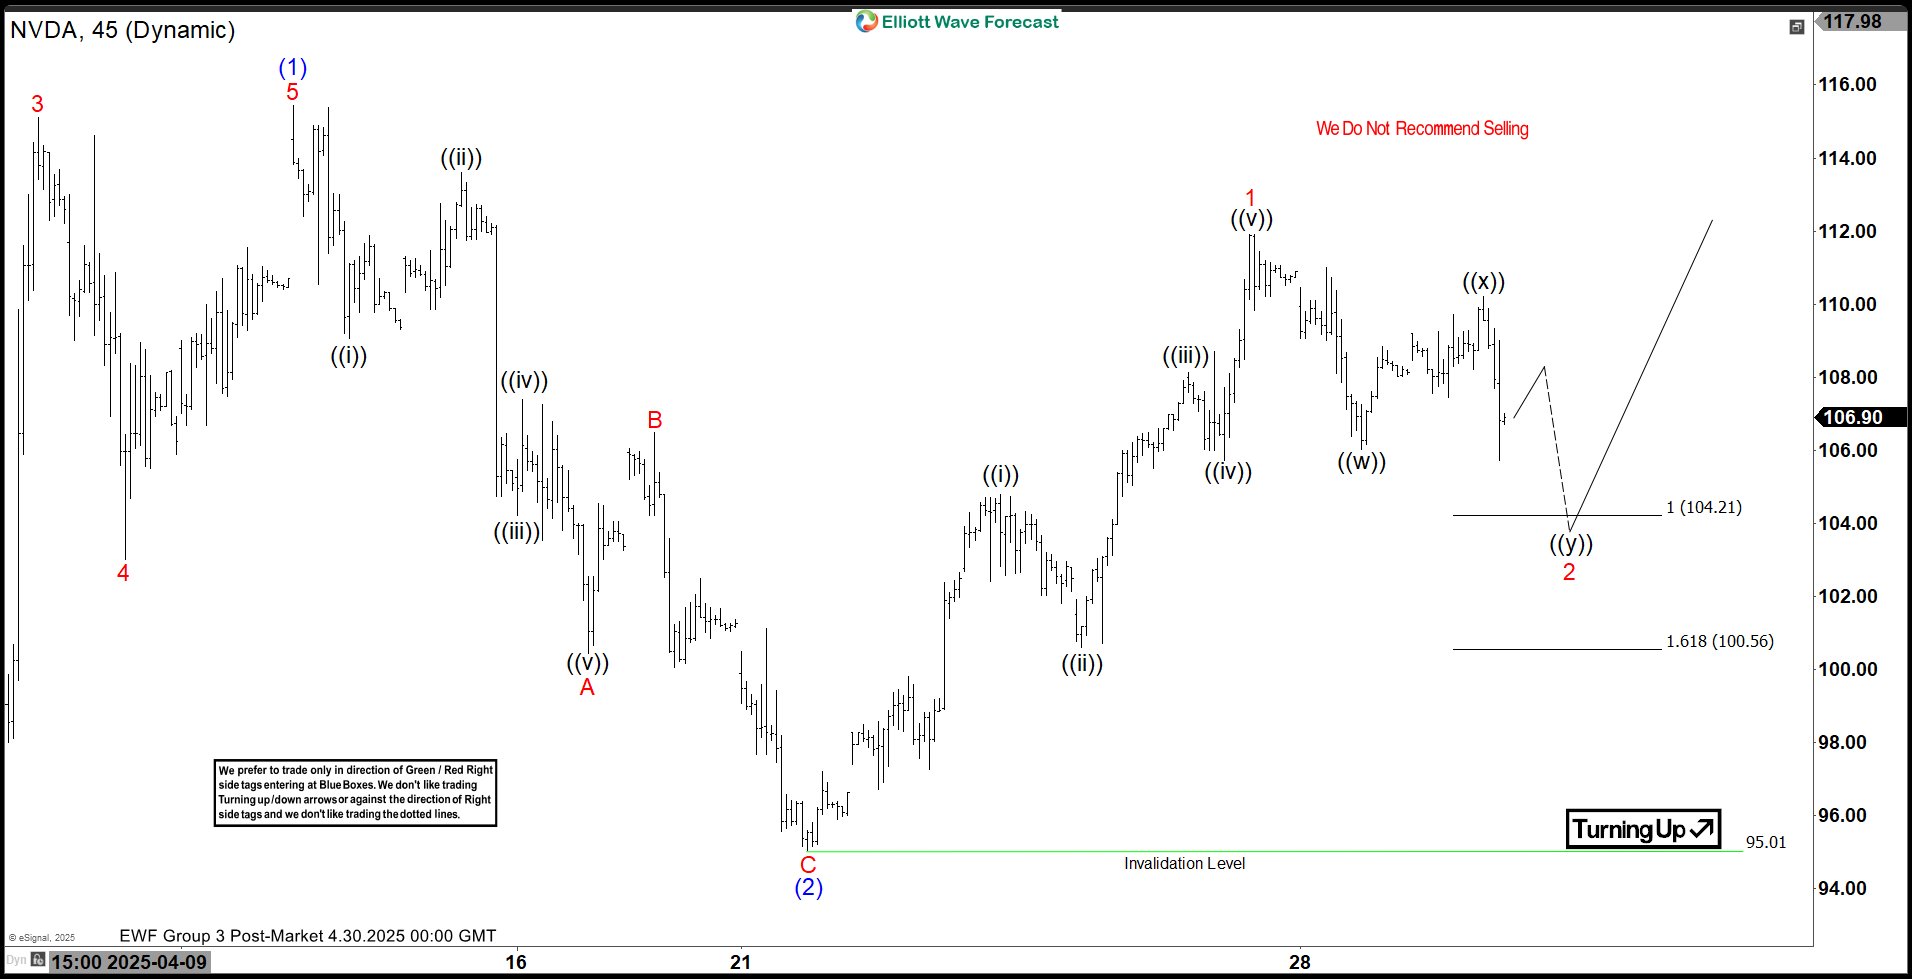
NVIDIA Corp. $NVDA Extreme Areas Offering Buying Opportunities
Read MoreHello everyone! In today’s article, we’ll examine the recent performance of NVIDIA Corp. ($NVDA) through the lens of Elliott Wave Theory. We’ll review how the rally from the April 21, 2025 low unfolded as a 5-wave impulse followed by a 7-swing correction (WXY) and discuss our forecast for the next move. Let’s dive into the structure and expectations for this stock. 5 Wave […]
-

SPDR S&P 500 ETF $SPY Can Rally 25% from the Blue Box Area
Read MoreHello everyone! In today’s article, we’ll examine the recent performance of SPDR S&P 500 ETF ($SPY) through the lens of Elliott Wave Theory. We’ll review how the decline from the February 19, 2025 high unfolded as a big 3-swing correction and discuss our forecast for the next move. Let’s dive into the structure and expectations for this ETF. $SPY […]
-
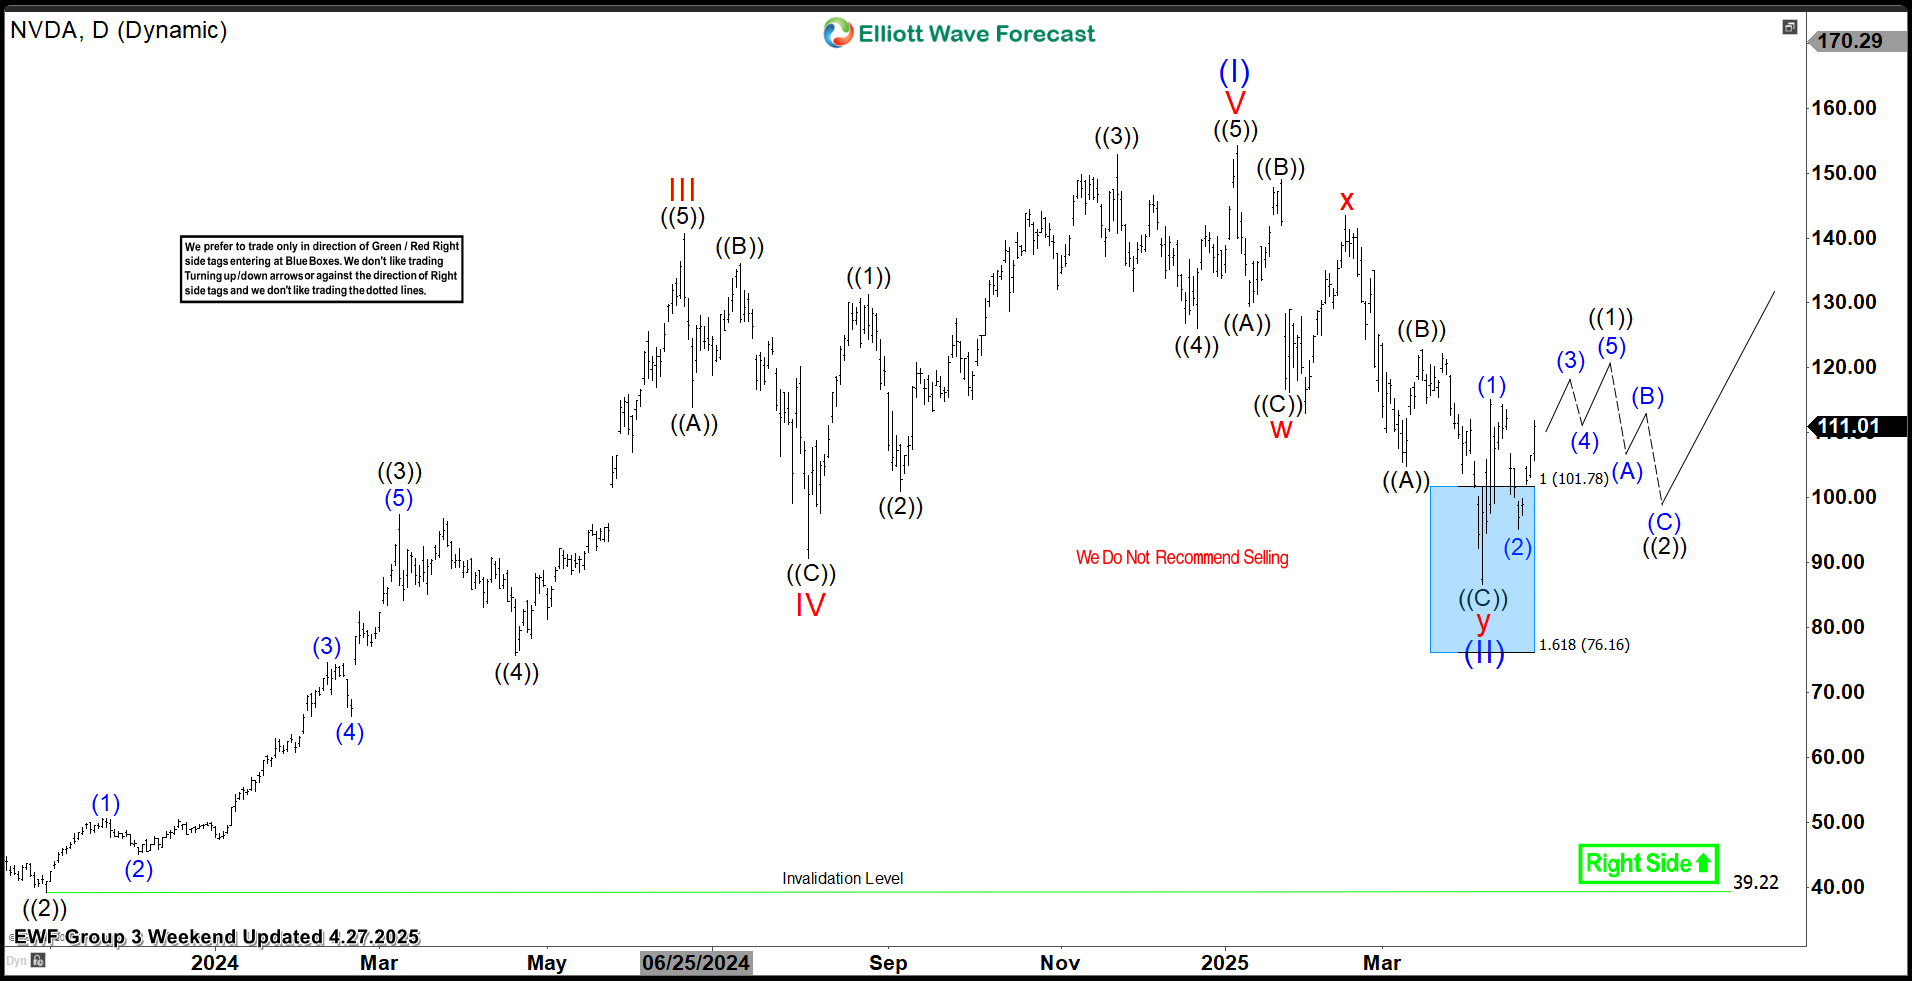
NVIDIA Corp. $NVDA Blue Box Area Offers A Buying Opportunity
Read MoreHello everyone! In today’s article, we’ll examine the recent performance of NVIDIA Corp. ($NVDA) through the lens of Elliott Wave Theory. We’ll review how the decline from the January 07, 2025, high unfolded as a 7-swing correction (WXY) and discuss our forecast for the next move. Let’s dive into the structure and expectations for this stock. 7 Swing WXY […]
-
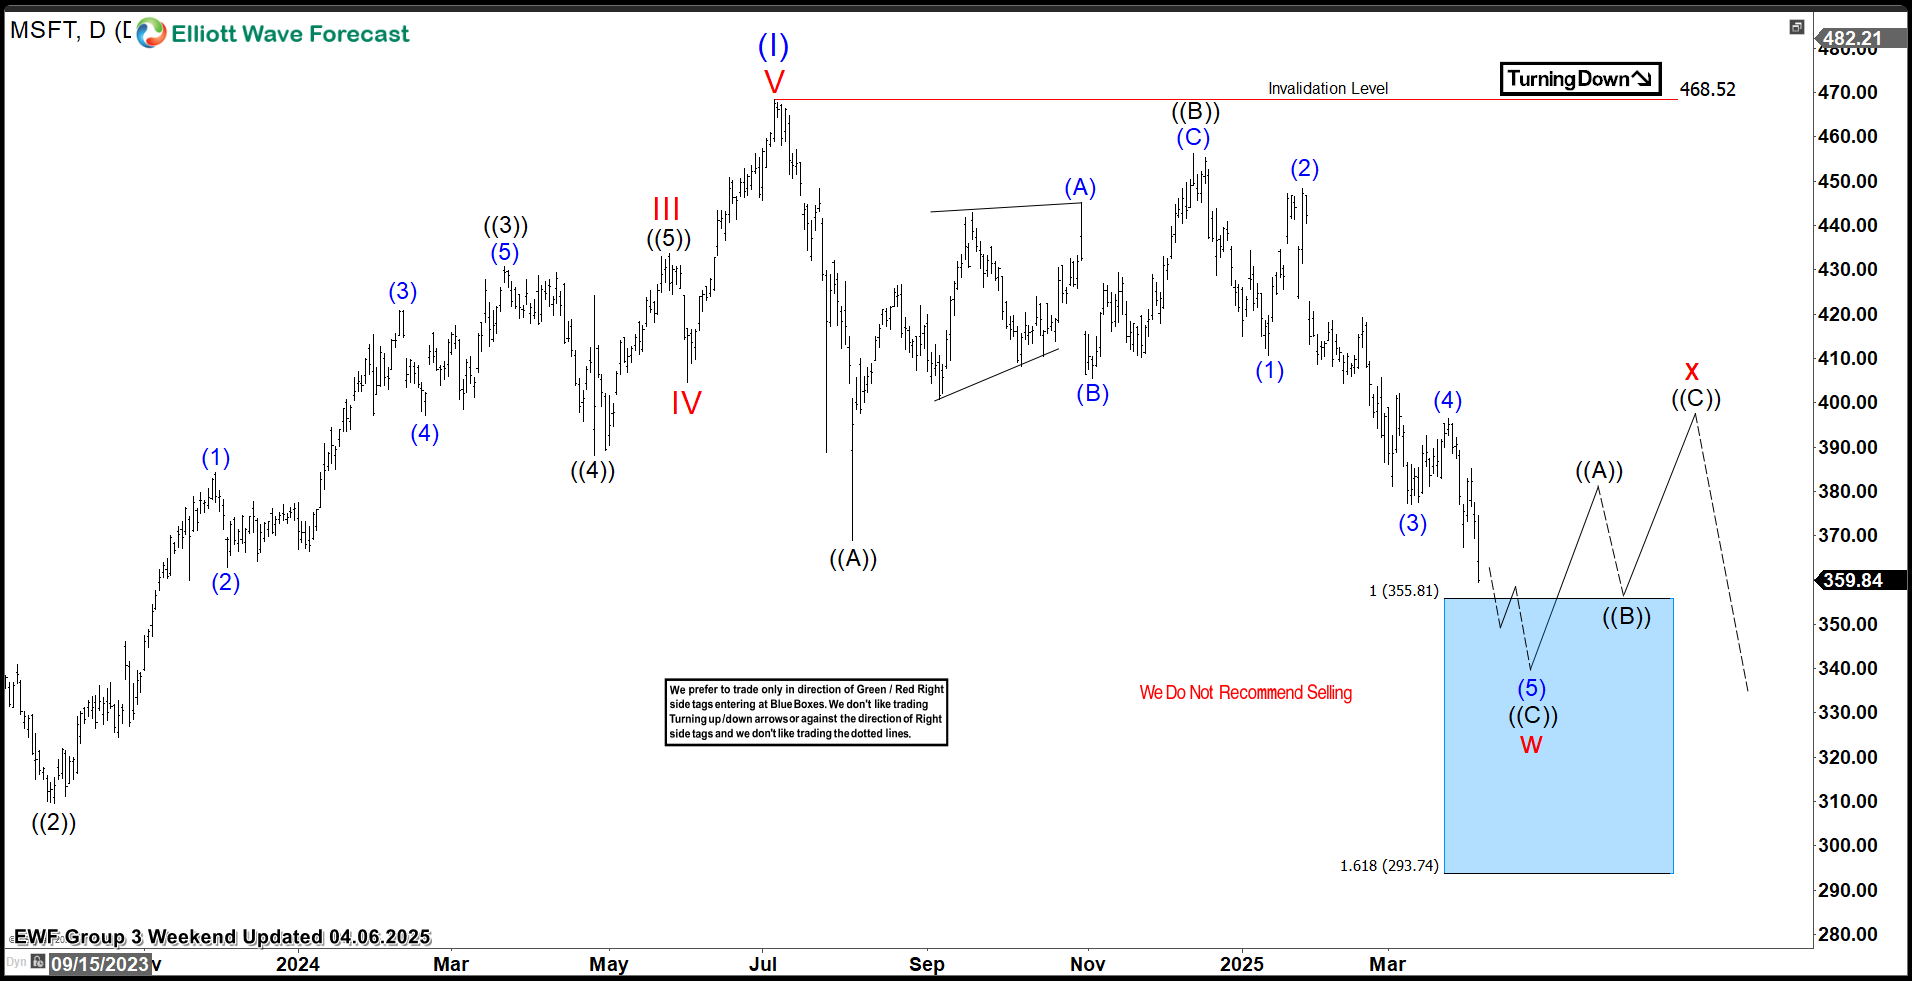
Microsoft Corp. $MSFT Blue Box Area Offers A Buying Opportunity
Read MoreHello everyone! In today’s article, we’ll examine the recent performance of Microsoft Corp. ($MSFT) through the lens of Elliott Wave Theory. We’ll review how the decline from the July 05, 2024, high unfolded as a big 3-swing correction and discuss our forecast for the next move. Let’s dive into the structure and expectations for this stock. $MSFT Daily Elliott […]
-
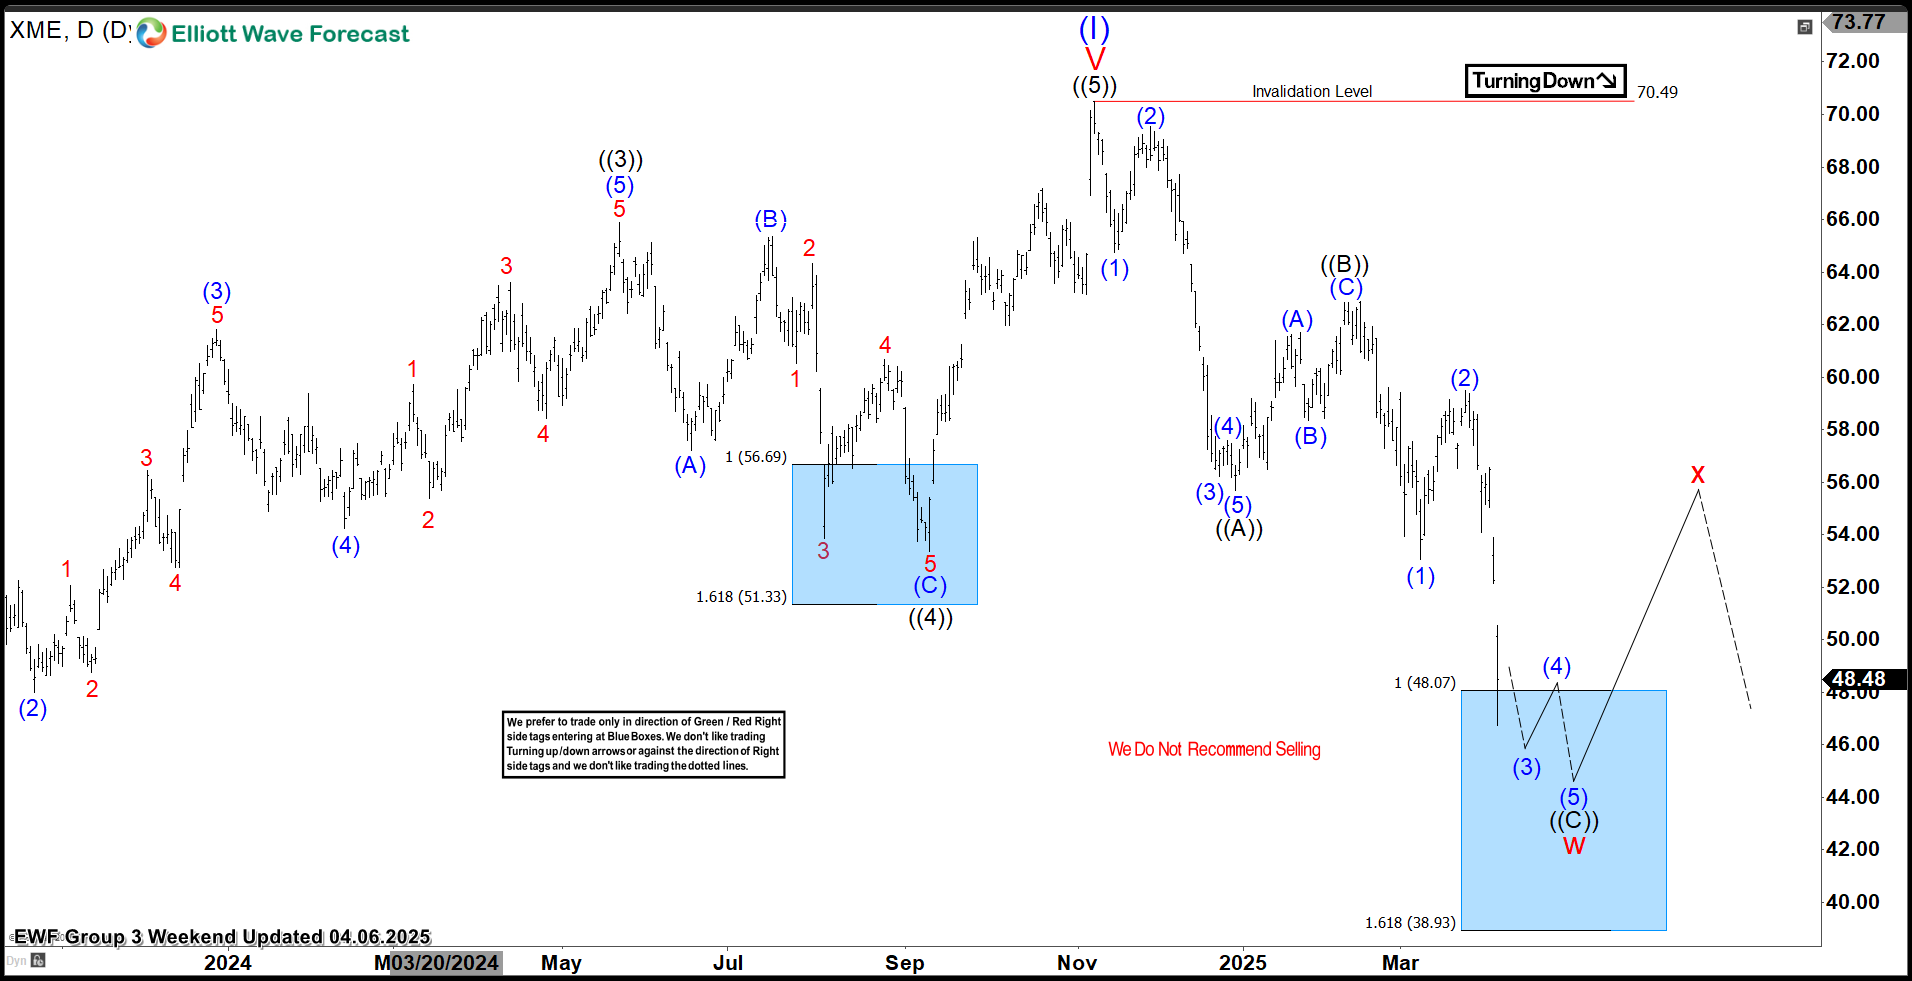
SPDR Metals & Mining ETF $XME Blue Box Area Offers A Buying Opportunity
Read MoreHello everyone! In today’s article, we’ll examine the recent performance of SPDR Metals & Mining ETF ($XME) through the lens of Elliott Wave Theory. We’ll review how the decline from the November 07, 2024, high unfolded as a big 3-swing correction and discuss our forecast for the next move. Let’s dive into the structure and expectations for this ETF. […]