-

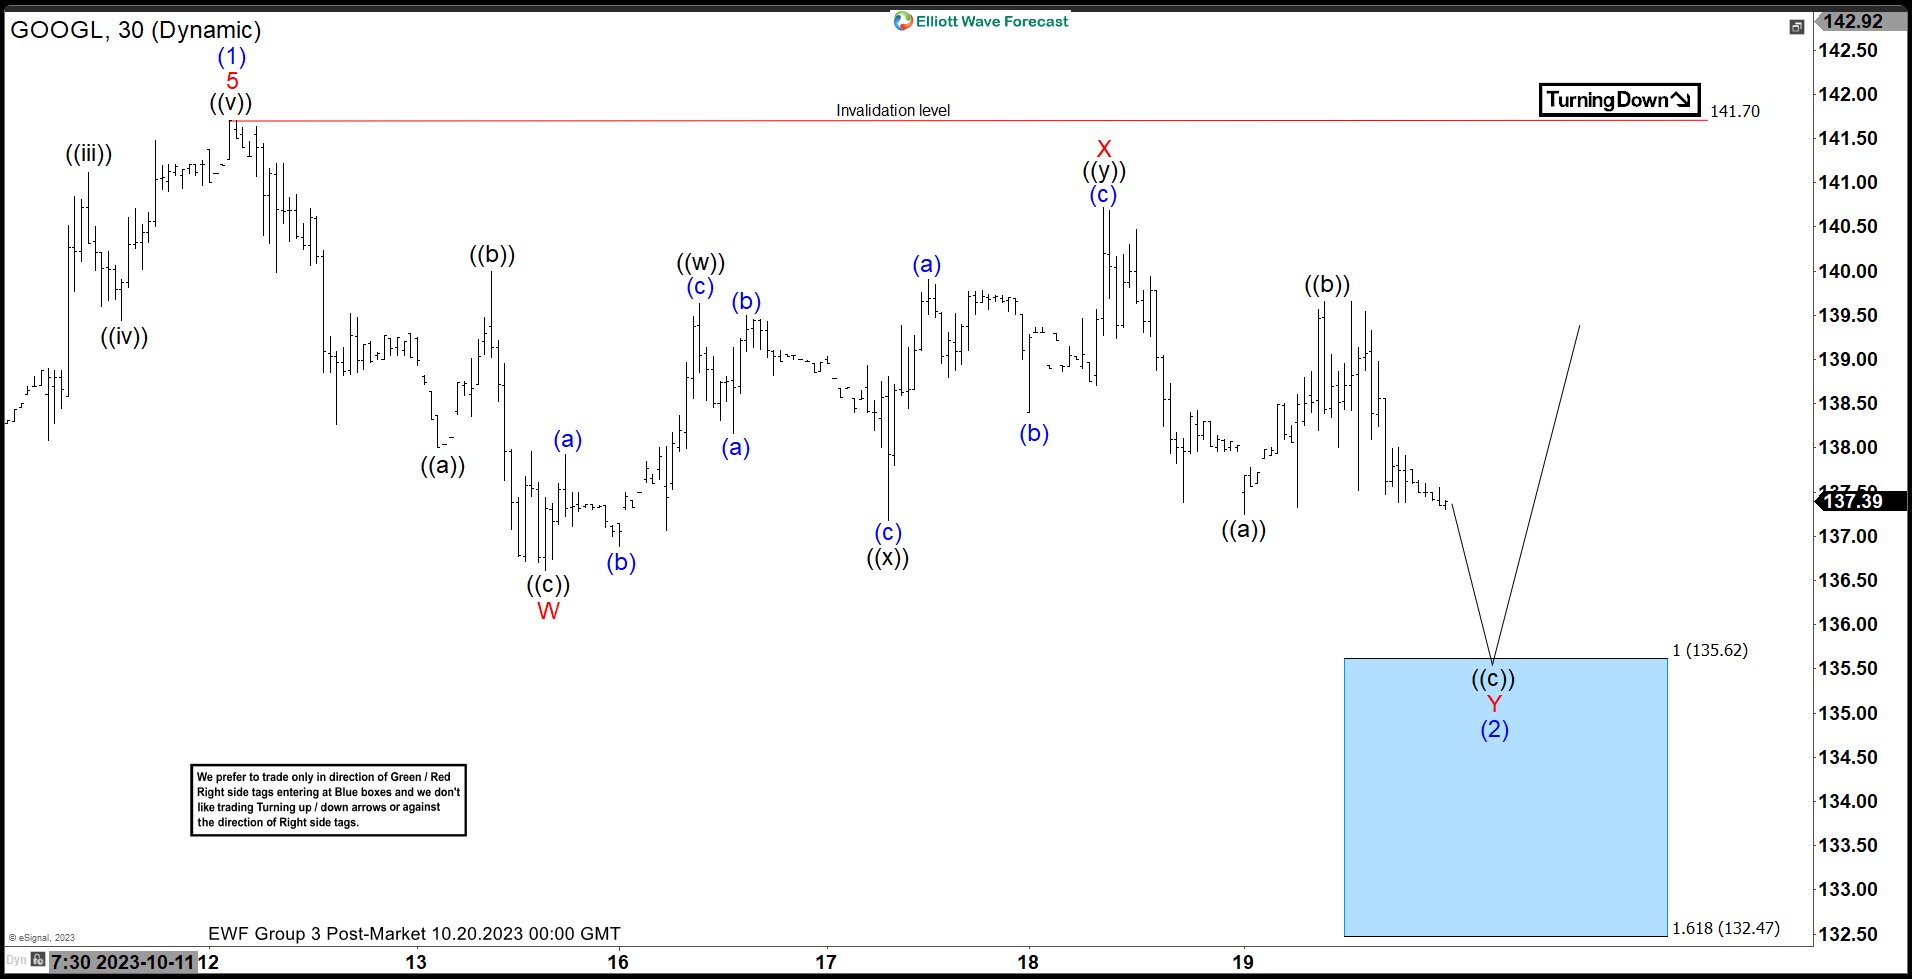
Alphabet Inc. ($GOOGL) Reacting Higher From Blue Box Area.
Read MoreHello everyone. In today’s article, we will look at the past performance of the 1 Hour Elliott Wave chart of Alphabet Inc. ($GOOGL). The rally from 9.26.2022 low unfolded as a 5 wave impulse. So, we expected the pullback to unfold in 7 swings and find buyers again at the blue box area. We will […]
-

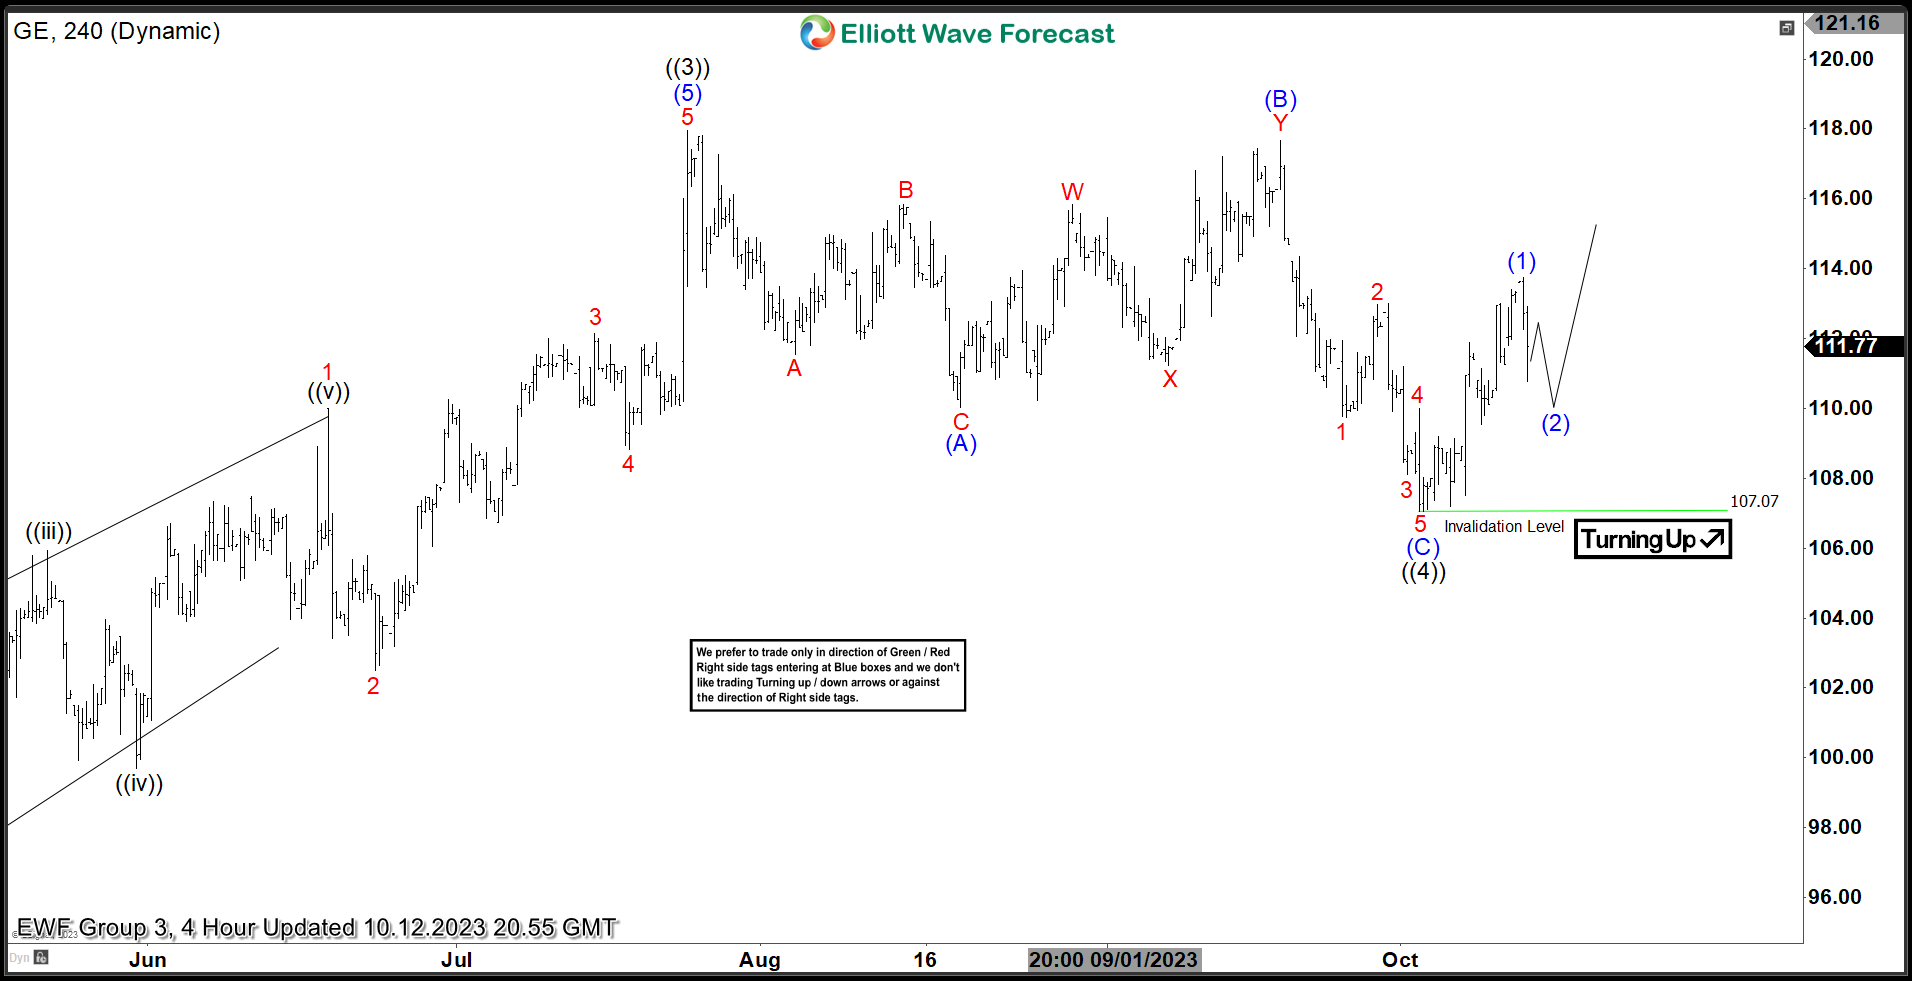
General Electric Co. ($GE) Reacted Higher After a Corrective Pull Back.
Read MoreHello everyone. In today’s article, we will look at the past performance of the 8 Hour Elliott Wave chart of General Electric Co. ($GE). The rally from 12.16.2022 low unfolded as a 5 wave impulse. So, we expected the pullback to unfold in 7 swings and find buyers again. We will explain the structure & […]
-

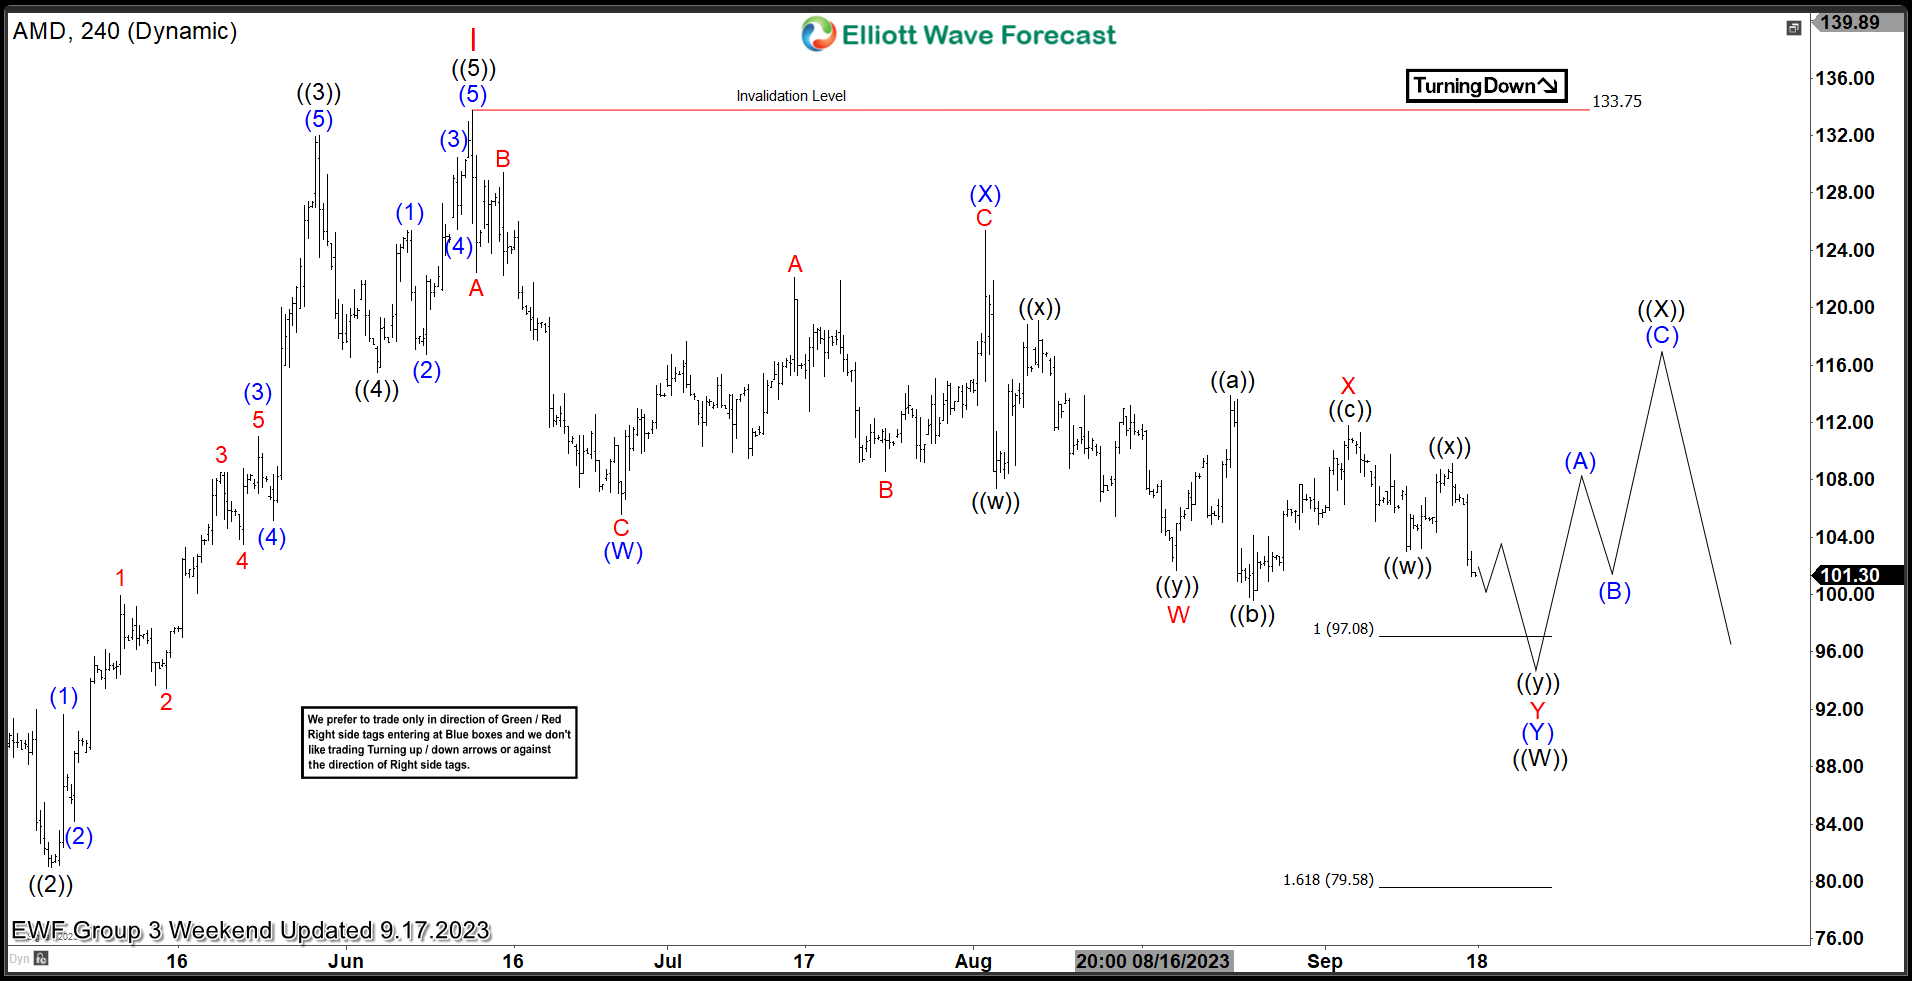
Advanced Micro Devices ($AMD) Found Buyers After a Corrective Pull Back.
Read MoreHello everyone. In today’s article, we will look at the past performance of the 4 Hour Elliott Wave chart of Advanced Micro Devices, Inc. ($AMD). The rally from 10.13.2022 low unfolded as a 5 wave impulse. So, we expected the pullback to unfold in 7 swings and find buyers again. We will explain the structure […]
-

SPDR Utilities Select Sector ($XLU) Is Poised To Rally Soon From a Blue Box Area
Read MoreHello Traders! Today, we will look at the Elliott Wave structure of SPDR Utilities Select Sector ($XLU) and explain why the stock is bound to end a cycle and bounce soon. The Utilities Select Sector SPDR® Fund seeks to provide investment results that correspond generally to the price and yield performance of the Utilities Select Sector […]
-

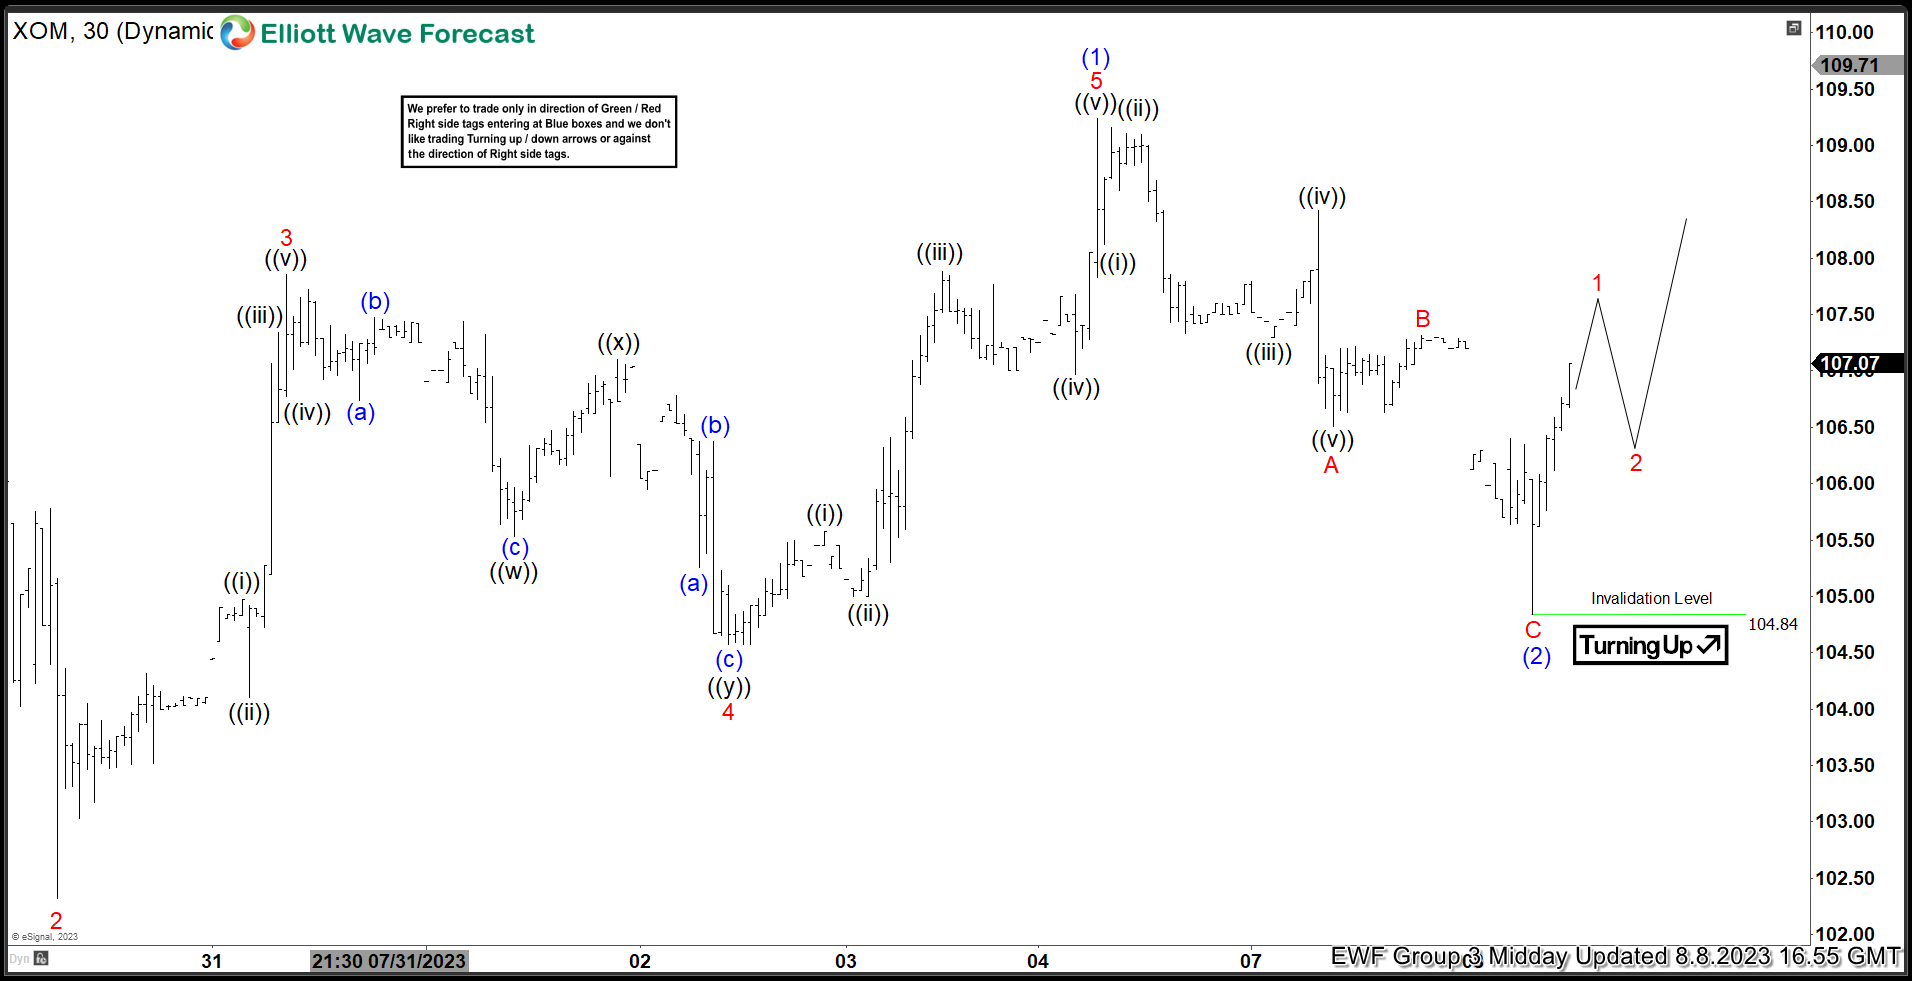
Exxon Mobil Corp ($XOM) Found Buyers After a Corrective Pull Back.
Read MoreHello everyone. In today’s article, we will look at the past performance of the 1 Hour Elliott Wave chart of Exxon Mobil Corp ($XOM). The rally from 7.17.2022 low unfolded as a 5 wave impulse. So, we expected the pullback to unfold in 3 swings and find buyers again. We will explain the structure & […]
-

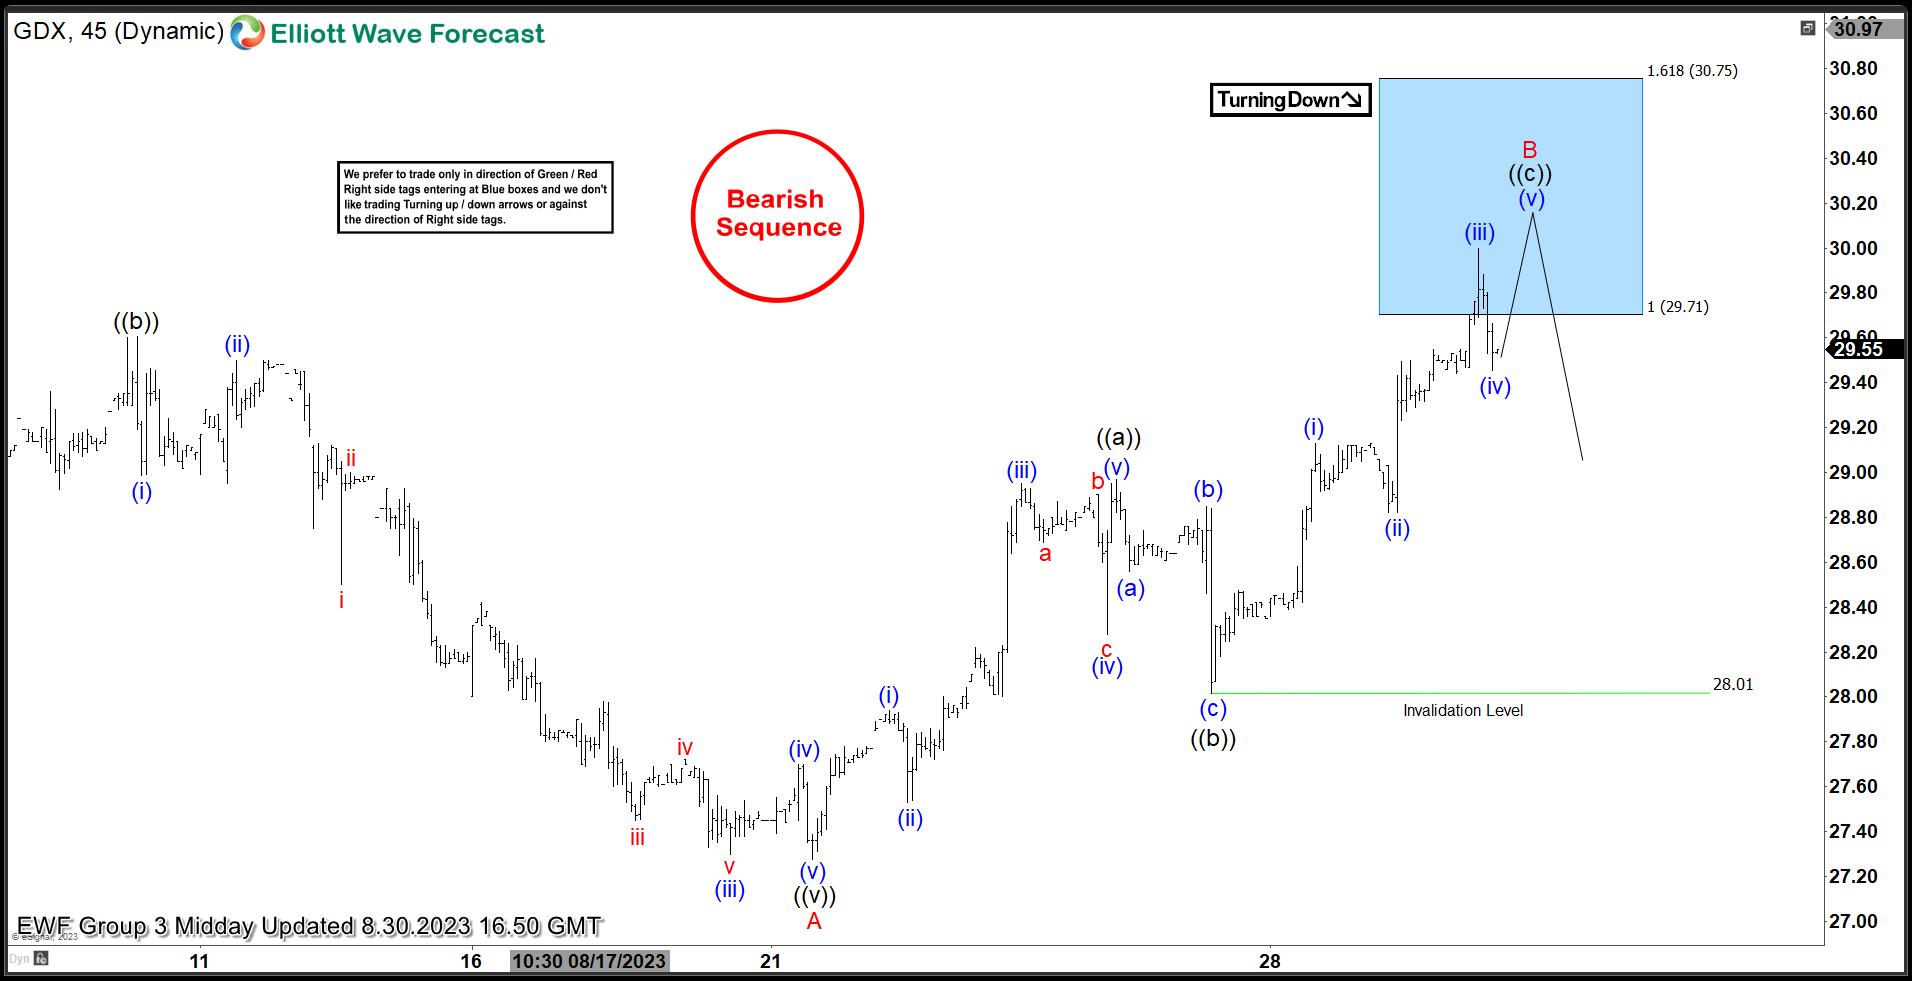
VanEck Gold Miners ETF ($GDX) Reacts Lower From The Blue Box Area.
Read MoreHello everyone. In today’s article, we will look at the past performance of the 1 Hour Elliott Wave chart of VanEck Gold Miners ETF ($GDX). The pullback from 7.18.2023 high unfolded as a 5 wave impulse with an incomplete bearish sequence from 5.04.2023 high. So, we advised members to sell the bounce in 3 swings […]
