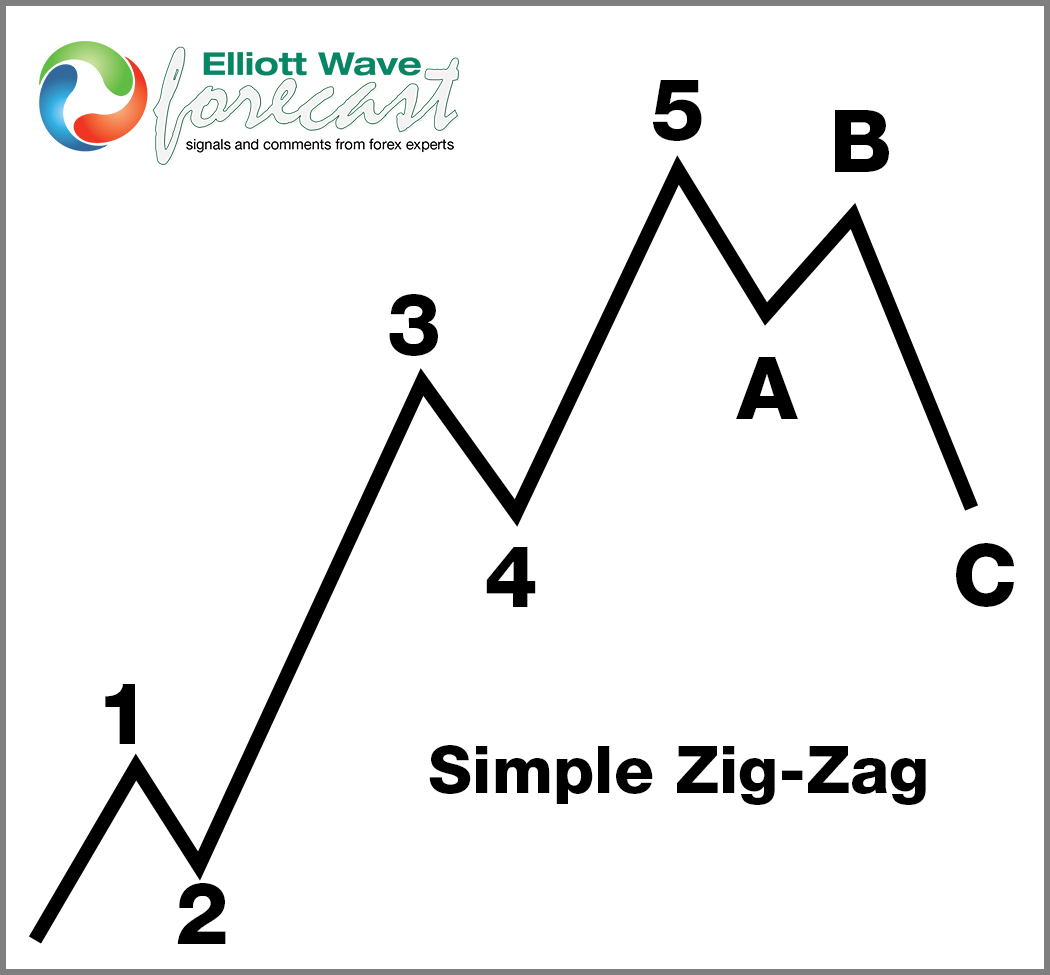
5 Wave Impulse Structure + ABC correction
$GOOGL 1H Elliott Wave Chart 5.18.2025:
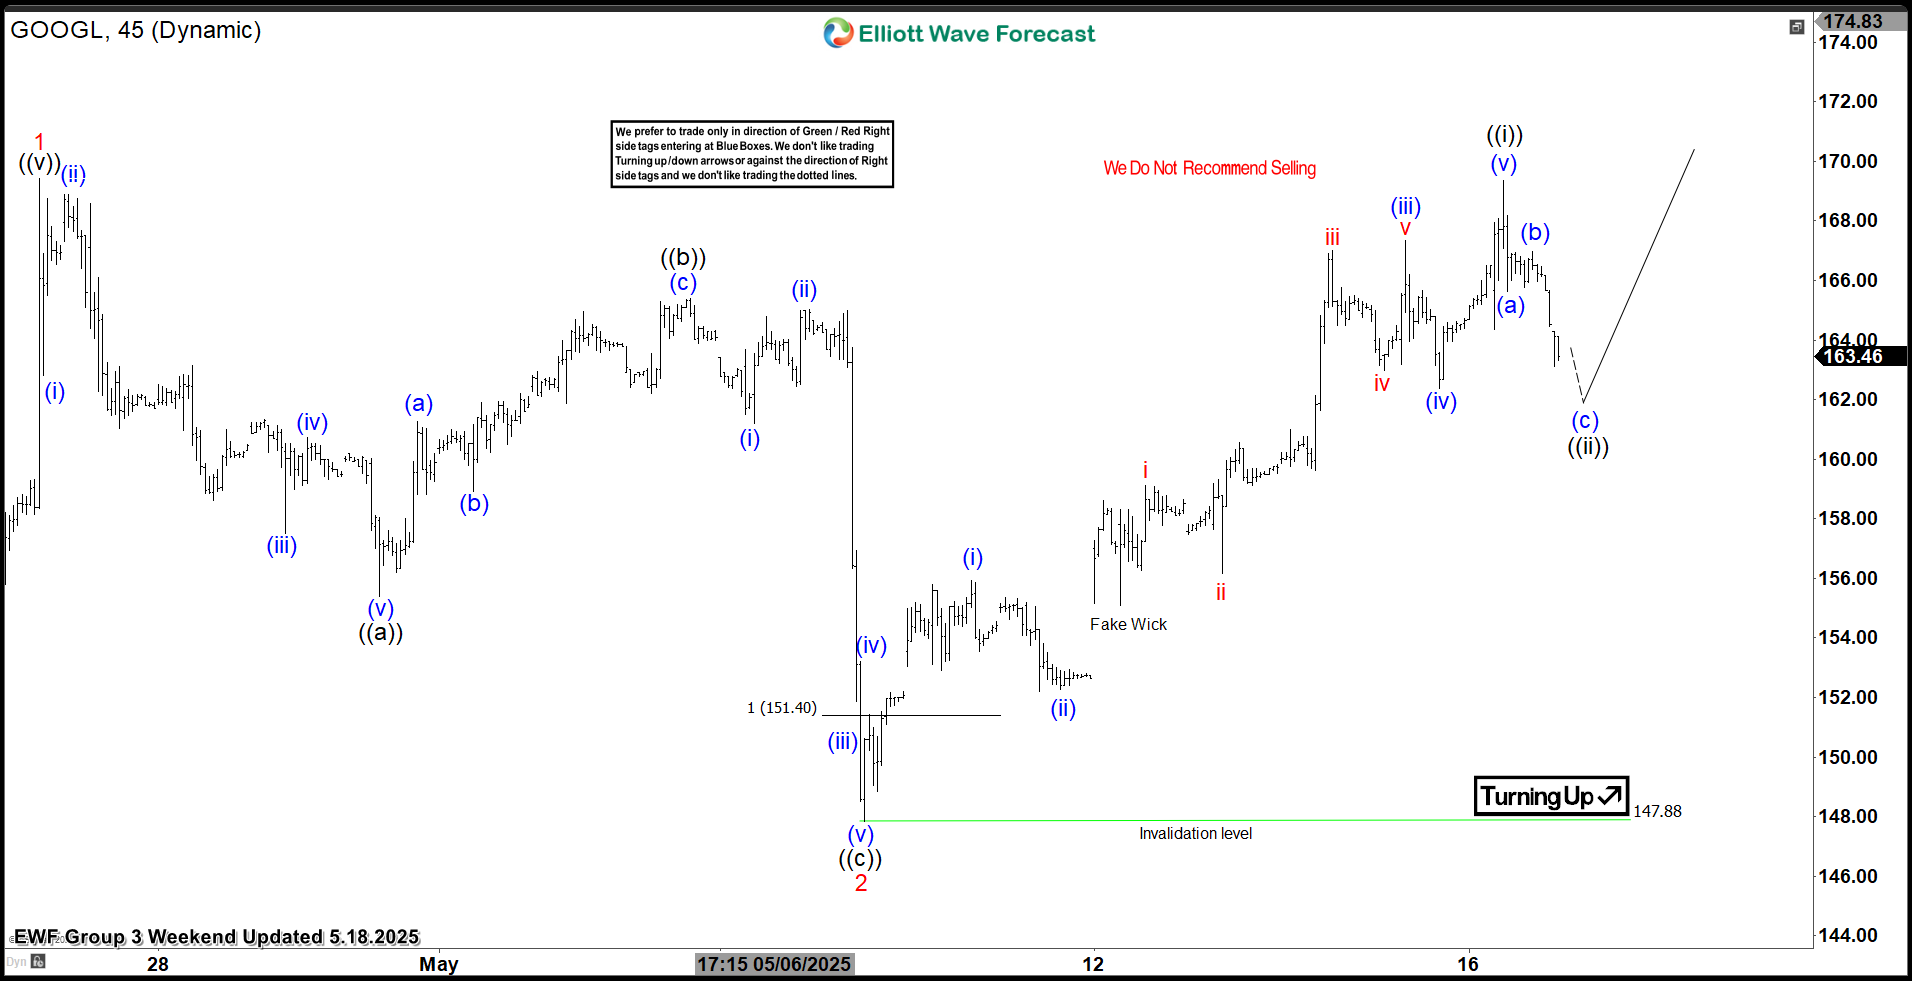 In the 1-hour Elliott Wave count from May 18, 2025, we saw that $GOOGL completed a 5-wave impulsive cycle at black ((i)). As expected, this initial wave prompted a pullback. We anticipated this pullback to unfold in 3 swings and find buyers.
This setup aligns with a typical Elliott Wave correction pattern (ABC), in which the market pauses briefly before resuming its primary trend.
$GOOGL 1H Elliott Wave Chart 5.19.2025:
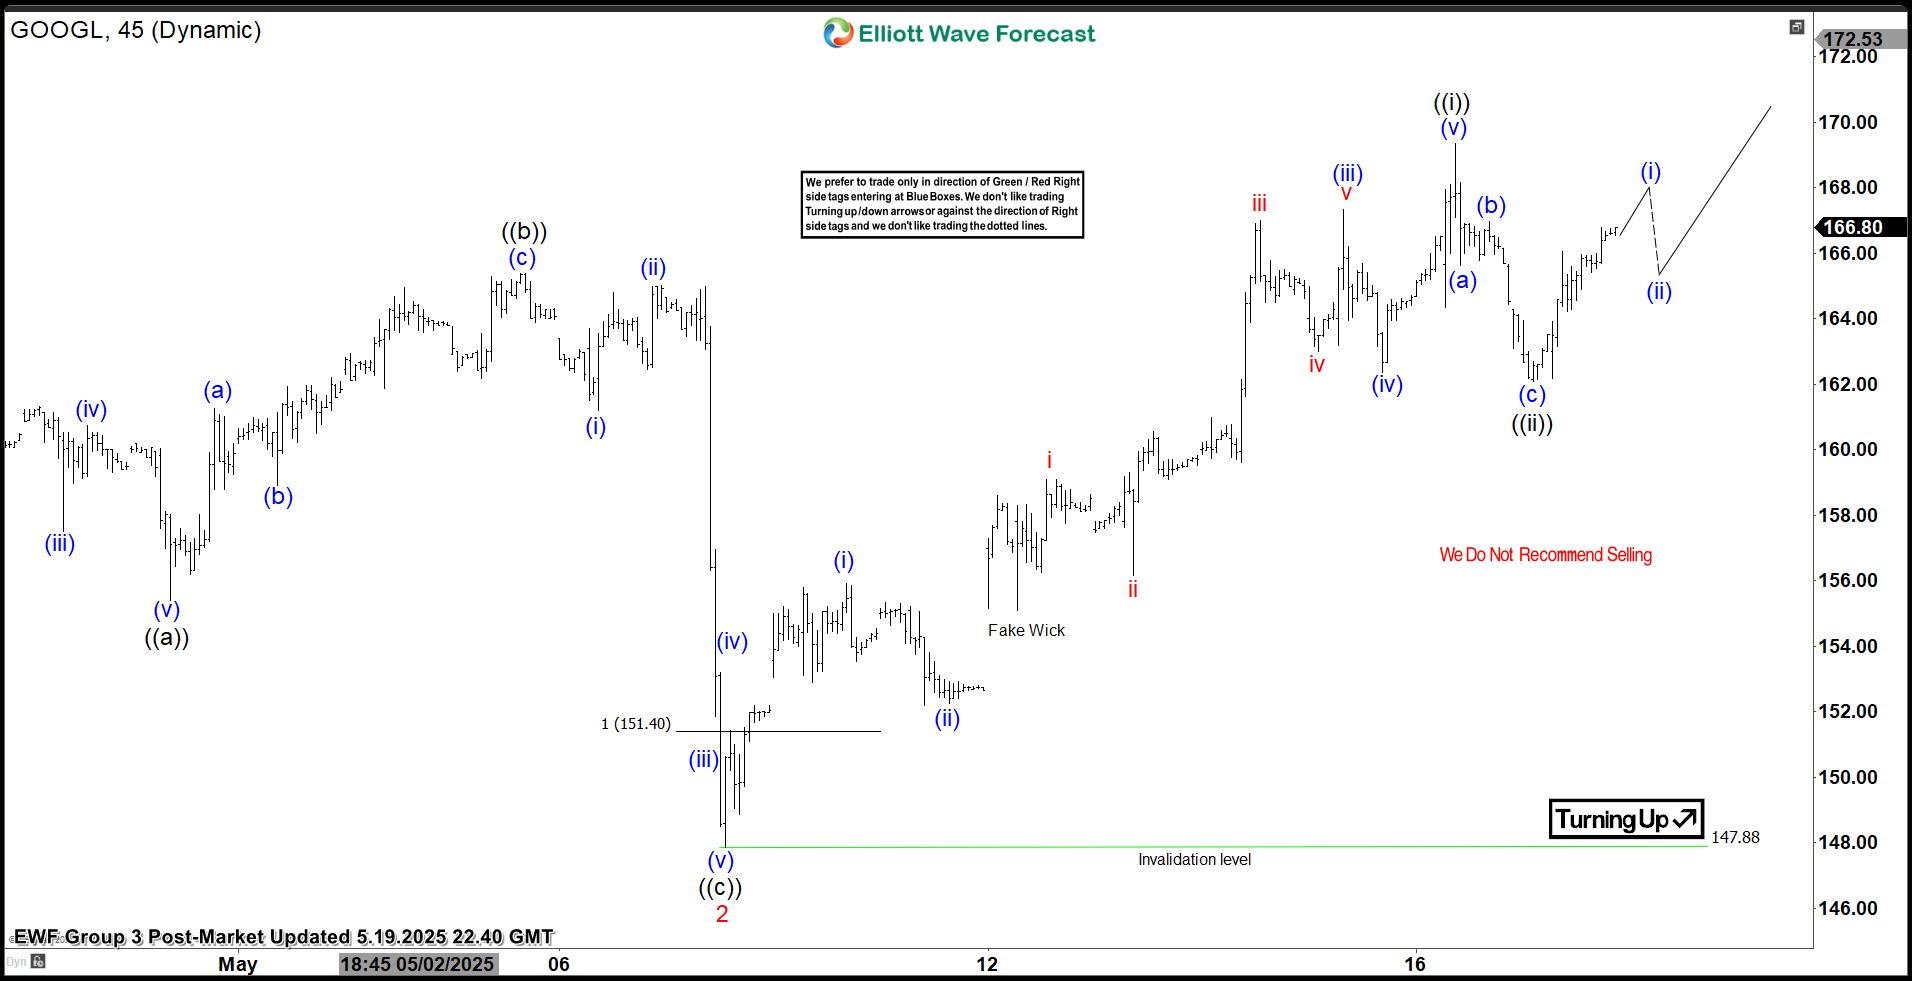
The recent update, from May 19, 2025, shows that the stock bounced as predicted. Currently, it is trading higher in wave ((iii)) looking for continuation higher towards 180–200 area before another pullback can happen.
Conclusion
In conclusion, our Elliott Wave analysis of Alphabet Inc. ($GOOGL) suggests that it remains supported against May 2025 lows. As a result, traders should buy the dips and monitor the $180–$200 zone as the next potential target. In the meantime, keep an eye out for any corrective pullbacks that may offer entry opportunities. By applying Elliott Wave Theory, traders can better anticipate the structure of upcoming moves and enhance risk management in volatile markets.
Elliott Wave Forecast
We cover 78 instruments, but not every chart is a trading recommendation. We present Official Trading Recommendations in the Live Trading Room. If not a member yet, Sign Up for 14 days Trial now and get access to new trading opportunities.
Welcome to Elliott Wave Forecast!


