$SPY Daily Elliott Wave Chart 4.06.2025: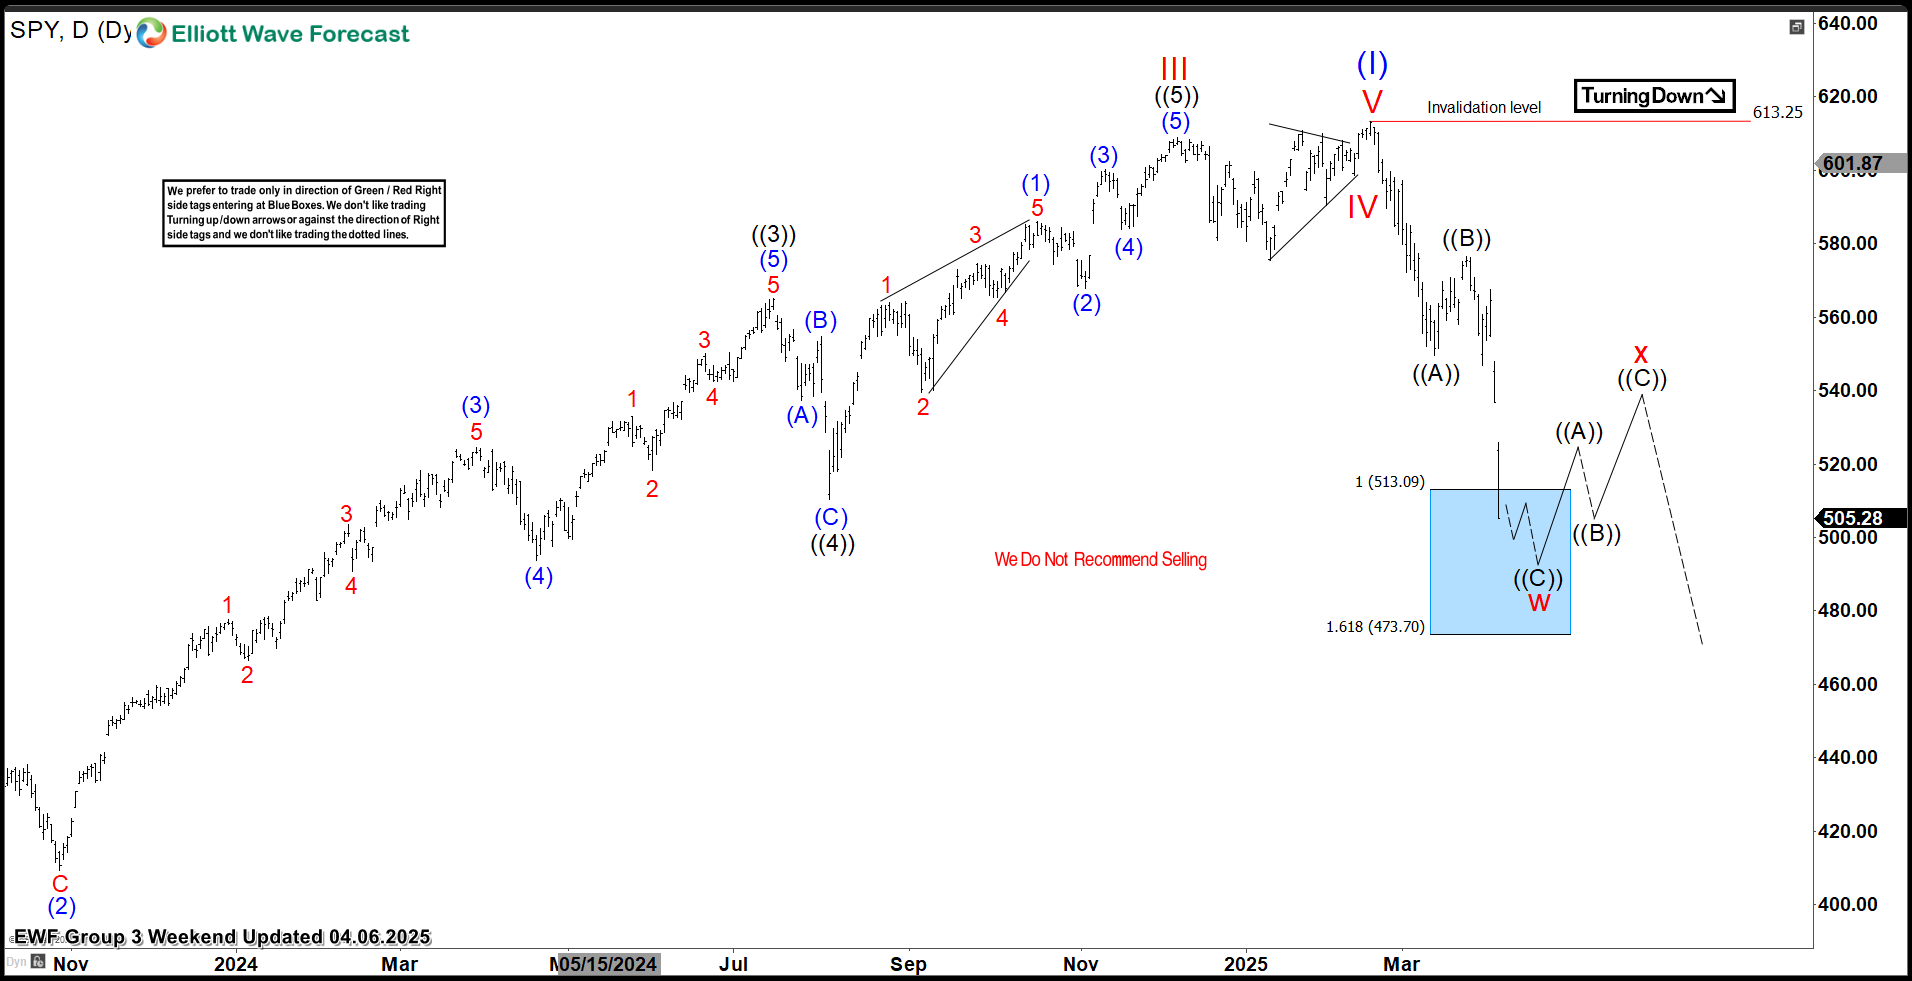
In the Daily Elliott Wave count from April 06, 2025, we see that $SPY completed a 5-wave impulsive cycle at blue ((I)). As expected, this initial wave prompted a pullback. We anticipated this pullback to unfold in 3 swings first, likely finding buyers in the equal legs area between $513.09 and $473.70.
This setup aligns with a typical Elliott Wave correction pattern (ABC), in which the market pauses briefly before resuming its primary trend.
5 Wave Impulse Structure + ABC correction

$SPY Daily Elliott Wave Chart 5.04.2025:
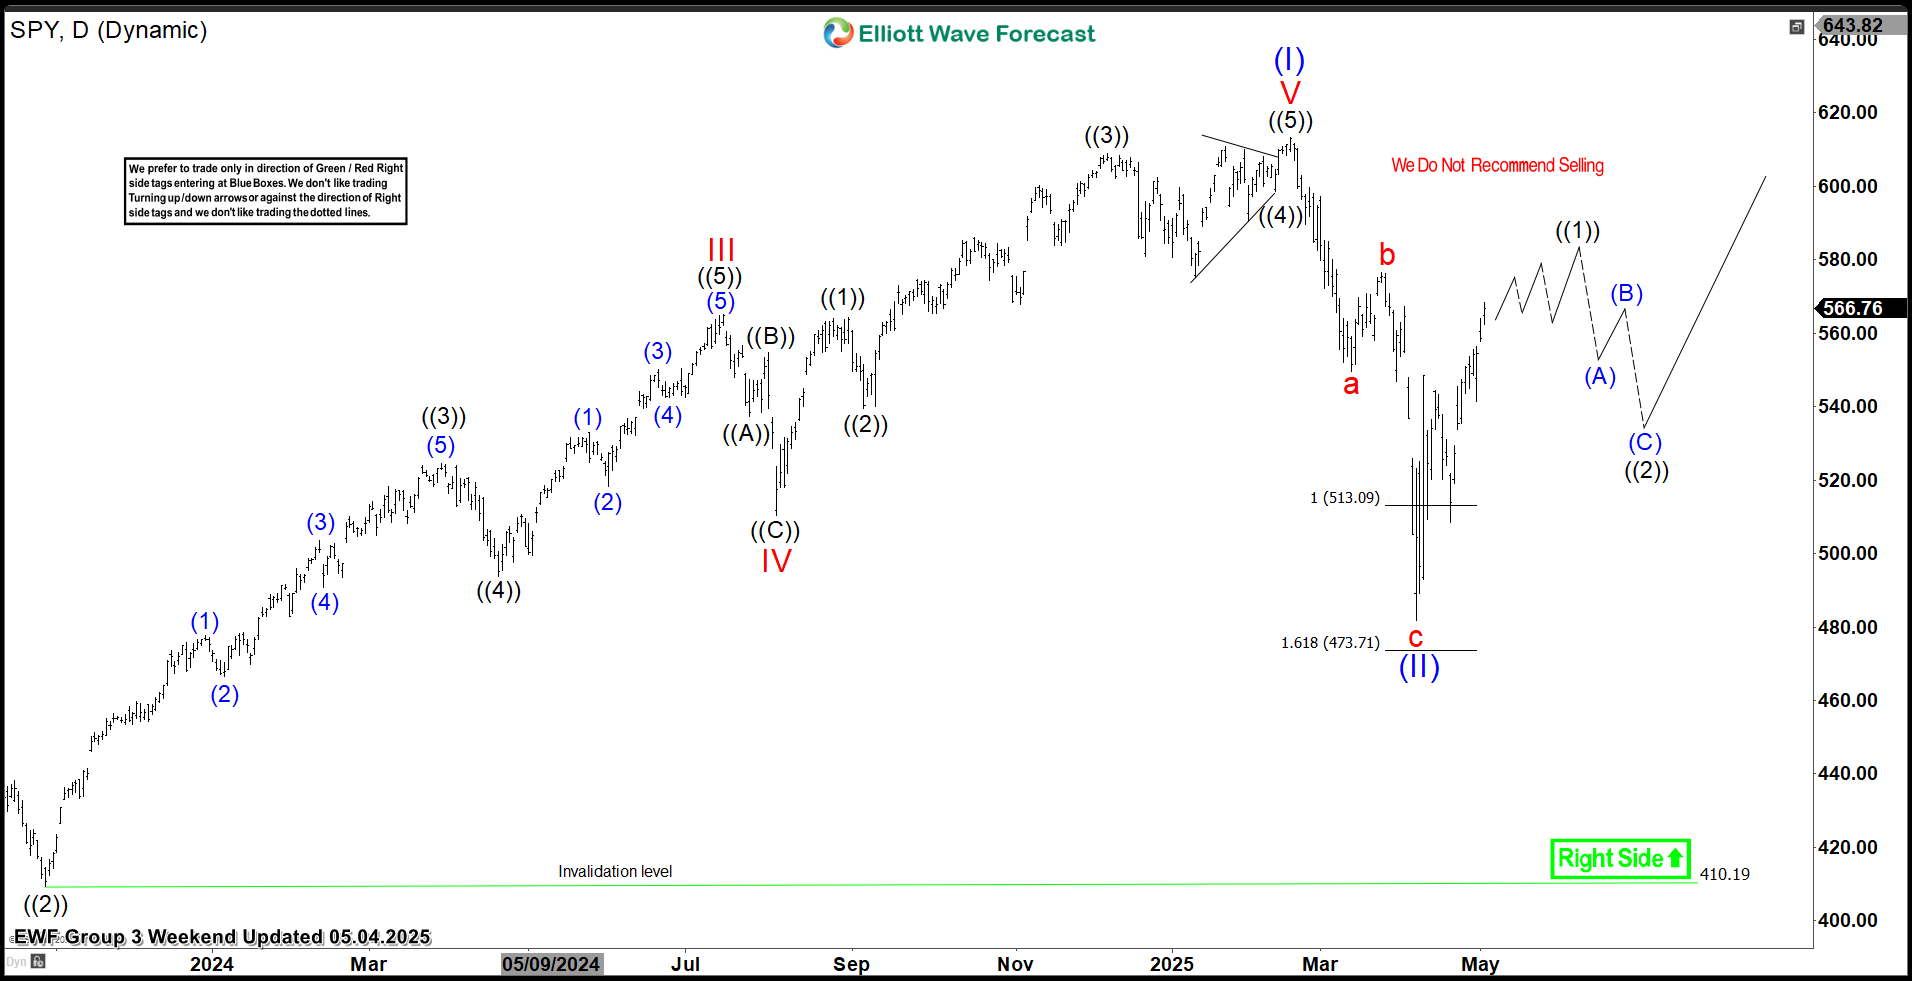
The most recent update, from May 04, 2025, shows that the ETF bounced as predicted allowing buyers to get risk-free. After the decline from the February peak, the ETF is now finding support in the equal legs area. Currently, it is building a 5-wave impulse in wave ((1)), which should be followed by a pullback in wave ((2)). After that, the market is expected to continue higher in a renewed bullish cycle.
Conclusion
In conclusion, our Elliott Wave analysis of SPDR S&P 500 ETF ($SPY) suggests that it can extend higher in the short term. As a result, traders should monitor the $575–$590 zone as the next potential target. In the meantime, keep an eye out for any corrective pullbacks that may offer entry opportunities. By applying Elliott Wave Theory, traders can better anticipate the structure of upcoming moves and enhance risk management in volatile markets.
$SPY Elliott Wave Video Analysis
Elliott Wave Forecast
We cover 78 instruments, but not every chart is a trading recommendation. We present Official Trading Recommendations in the Live Trading Room. If not a member yet, Sign Up for 14 days Trial now and get access to new trading opportunities.
Welcome to Elliott Wave Forecast!


