-

VanEck Gold Miners ETF ( $GDX ) Perfect Reaction From The Blue Box Area.
Read MoreHello everyone! In today’s article, we will look at the past performance of the 4H Hour Elliott Wave chart of VanEck Gold Miners ETF ( $GDX ) . The rally from 2.28.2024 low at $25.64 unfolded as a 5 waves impulse. So, we expected the pullback to unfold in 3 swings and find buyers again. […]
-

Riding the Wave: ($TSLA)’s Impressive Rally and What’s Coming Next
Read MoreHello everyone! In today’s article, we will look at the past performance of the 1H Hour Elliott Wave chart of Tesla Inc. ($TSLA). The rally from 6.11.2024 low at $167.40 unfolded as 5 waves impulse. So, we expected the pullback to unfold in 3 swings and find buyers again. We will explain the structure & […]
-

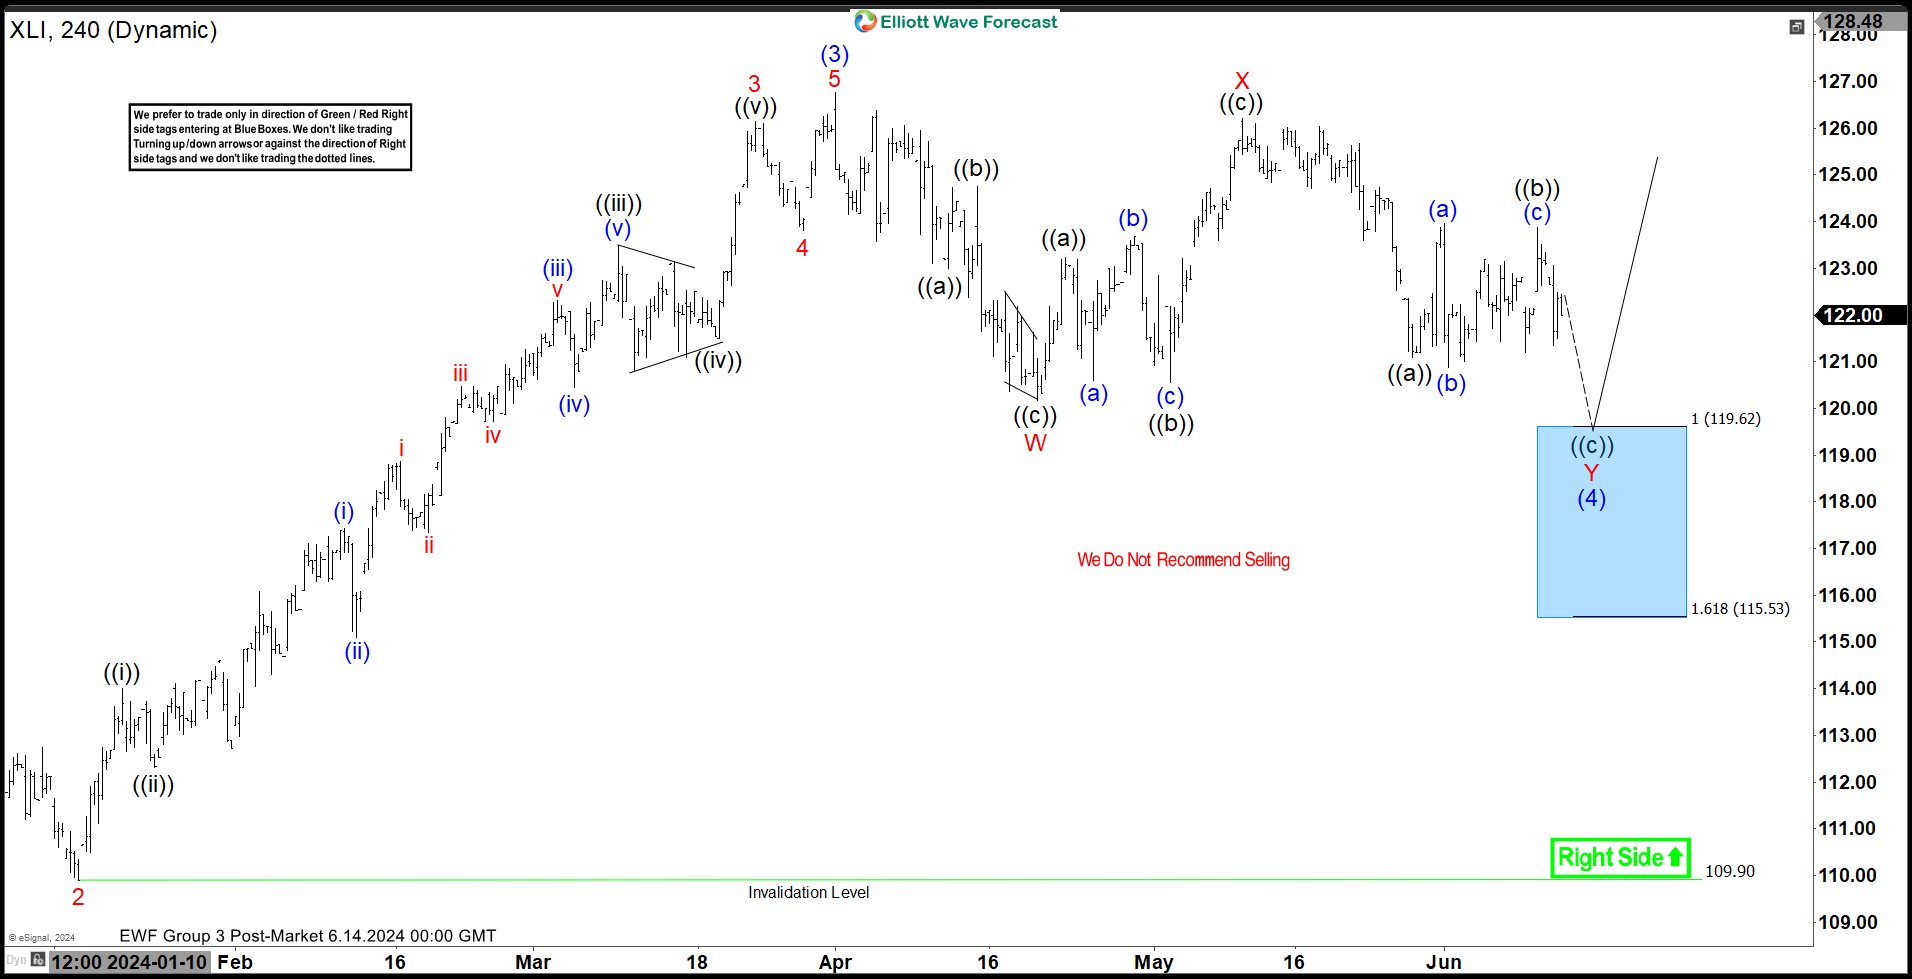
SPDR Industrial ETF ( $XLI) Found Buyers At The Blue Box Area As Expected.
Read MoreHello everyone. In today’s article, we will look at the past performance of the 4H Hour Elliott Wave chart of SPDR Industrial ETF ($XLI). The rally from 1.17.2024 low at $109.90 unfolded as 5 waves impulse. So, we expected the pullback to unfold in 7 swings and find buyers again. We will explain the structure […]
-

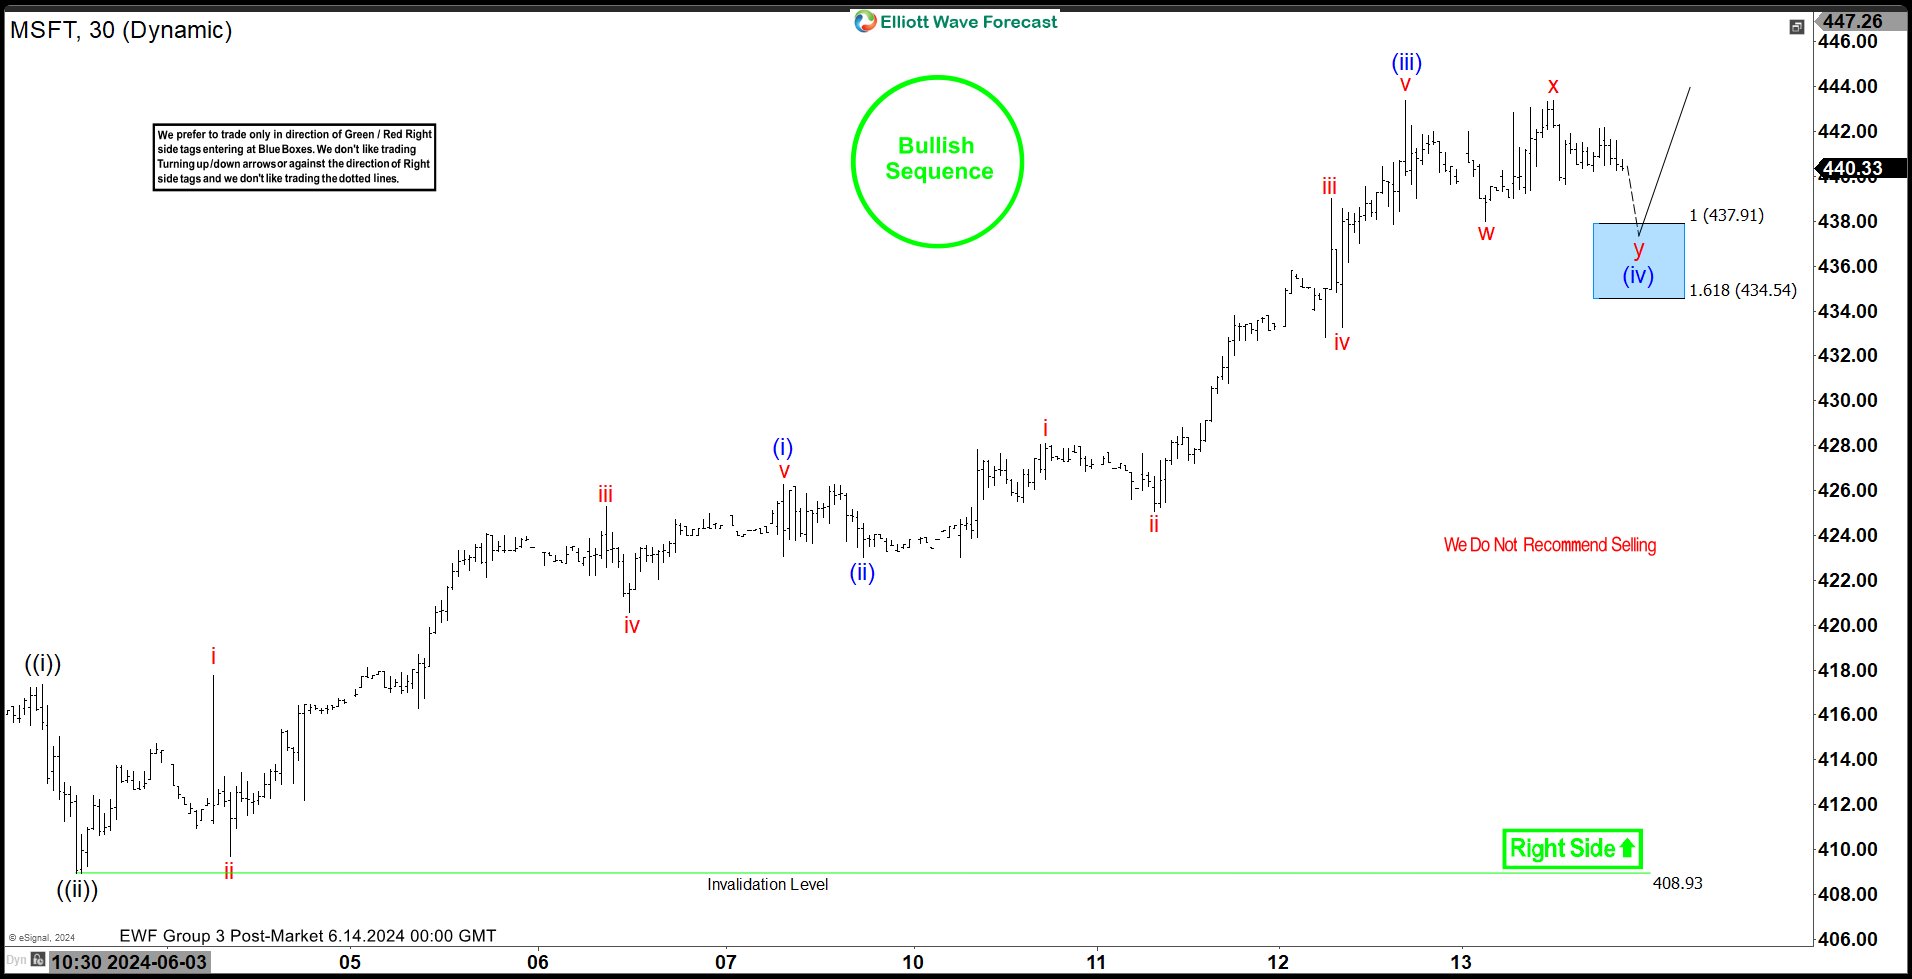
Microsoft Corp. ( $MSFT) React From the Blue Box Area as Expected.
Read MoreHello everyone. In today’s article, we will look at the past performance of the 1H Hour Elliott Wave chart of Microsoft Corp. ($MSFT). The rally from 6.03.2024 low at $408.93 unfolded as 5 waves impulse. So, we expected the pullback to unfold in 7 swings and find buyers again. We will explain the structure & […]
-

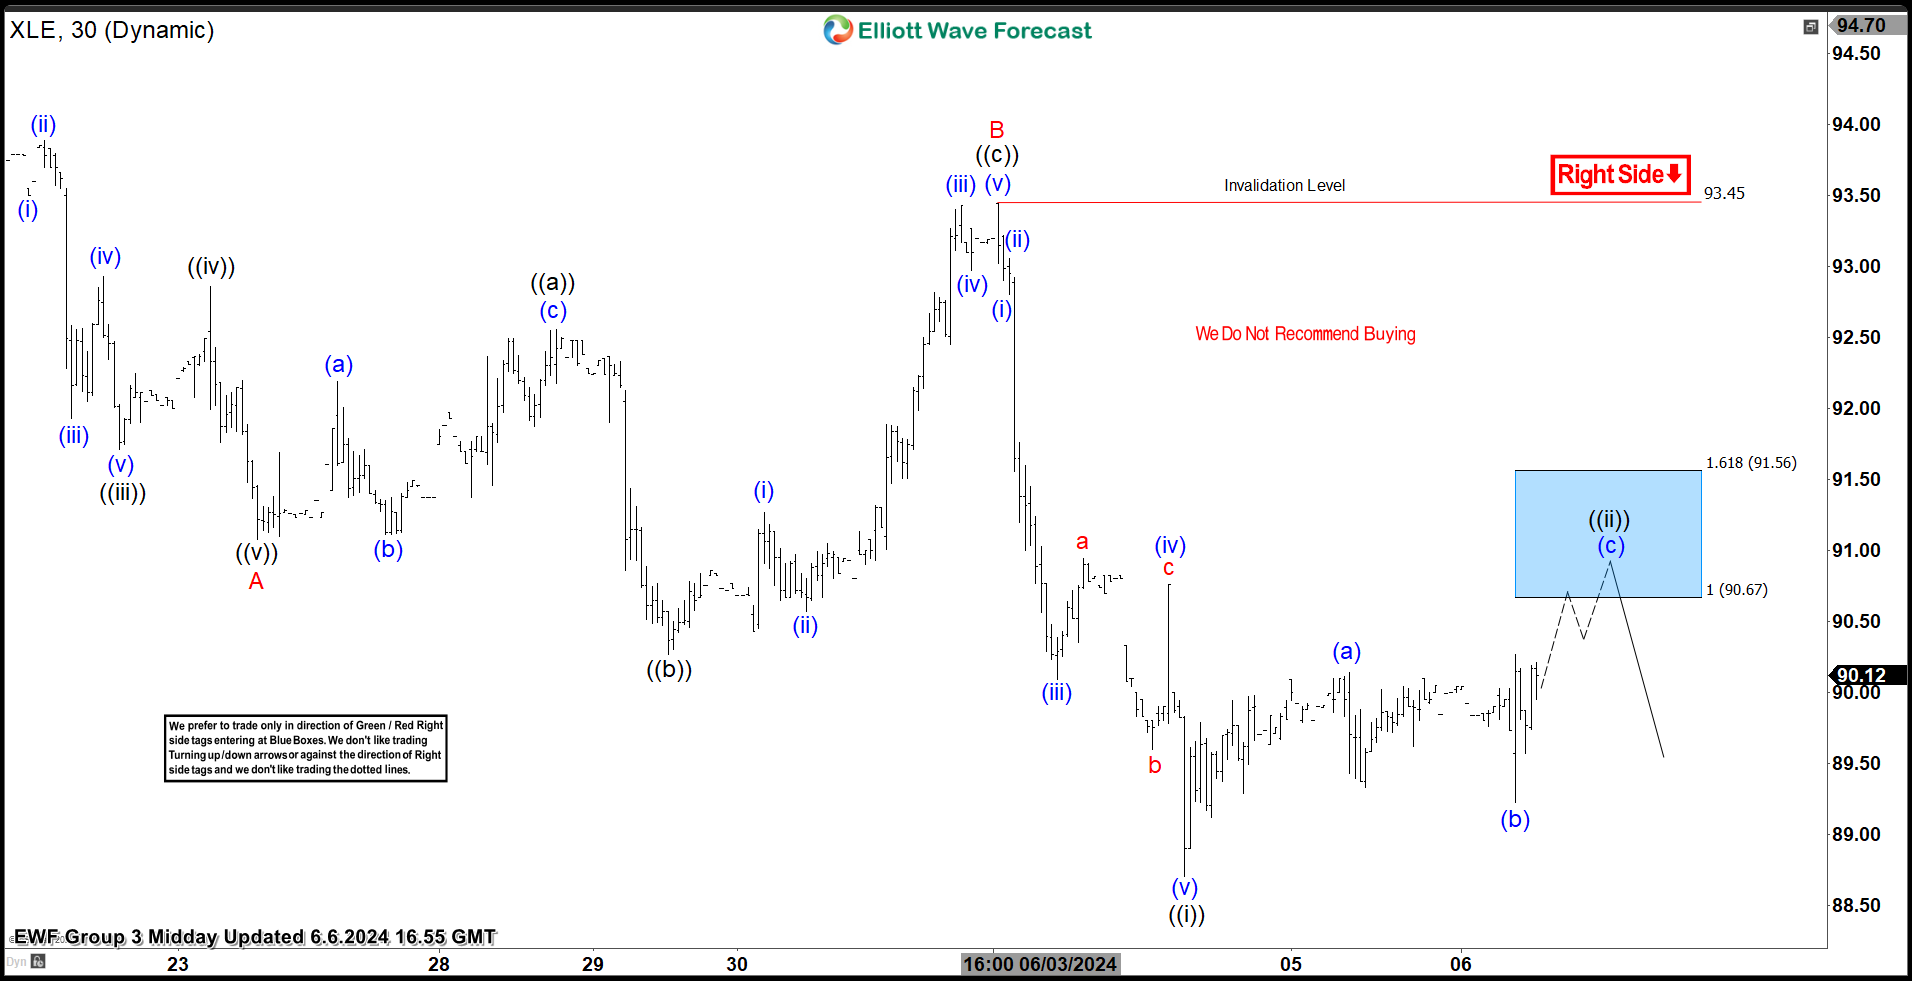
SPDR Energy ETF ( $XLE) Found Sellers at the Blue Box Area as Expected.
Read MoreHello everyone. In today’s article, we will look at the past performance of the 1H Hour Elliott Wave chart of SPDR Energy ETF ($XLE). The decline from 5.31.2024 high at $93.45 unfolded as 5 waves impulse. So, we expected the bounce to unfold in 3 swings and find sellers again. We will explain the structure […]
-

iShares 20+ Year Bond ETF ( $TLT) Bullish Structure Calling for More Upside Against Oct 2023.
Read MoreHello Traders! Today, we will look at the 4H Elliott Wave structure of iShares 20+ Year Bond ETF ($TLT) and explain why the ETF should see more upside after pulling back in a Zig-Zag correction and reaching the Blue Box area. 5 Wave Impulse Structure + ABC correction $TLT 4H Elliott Wave View – June […]