
-
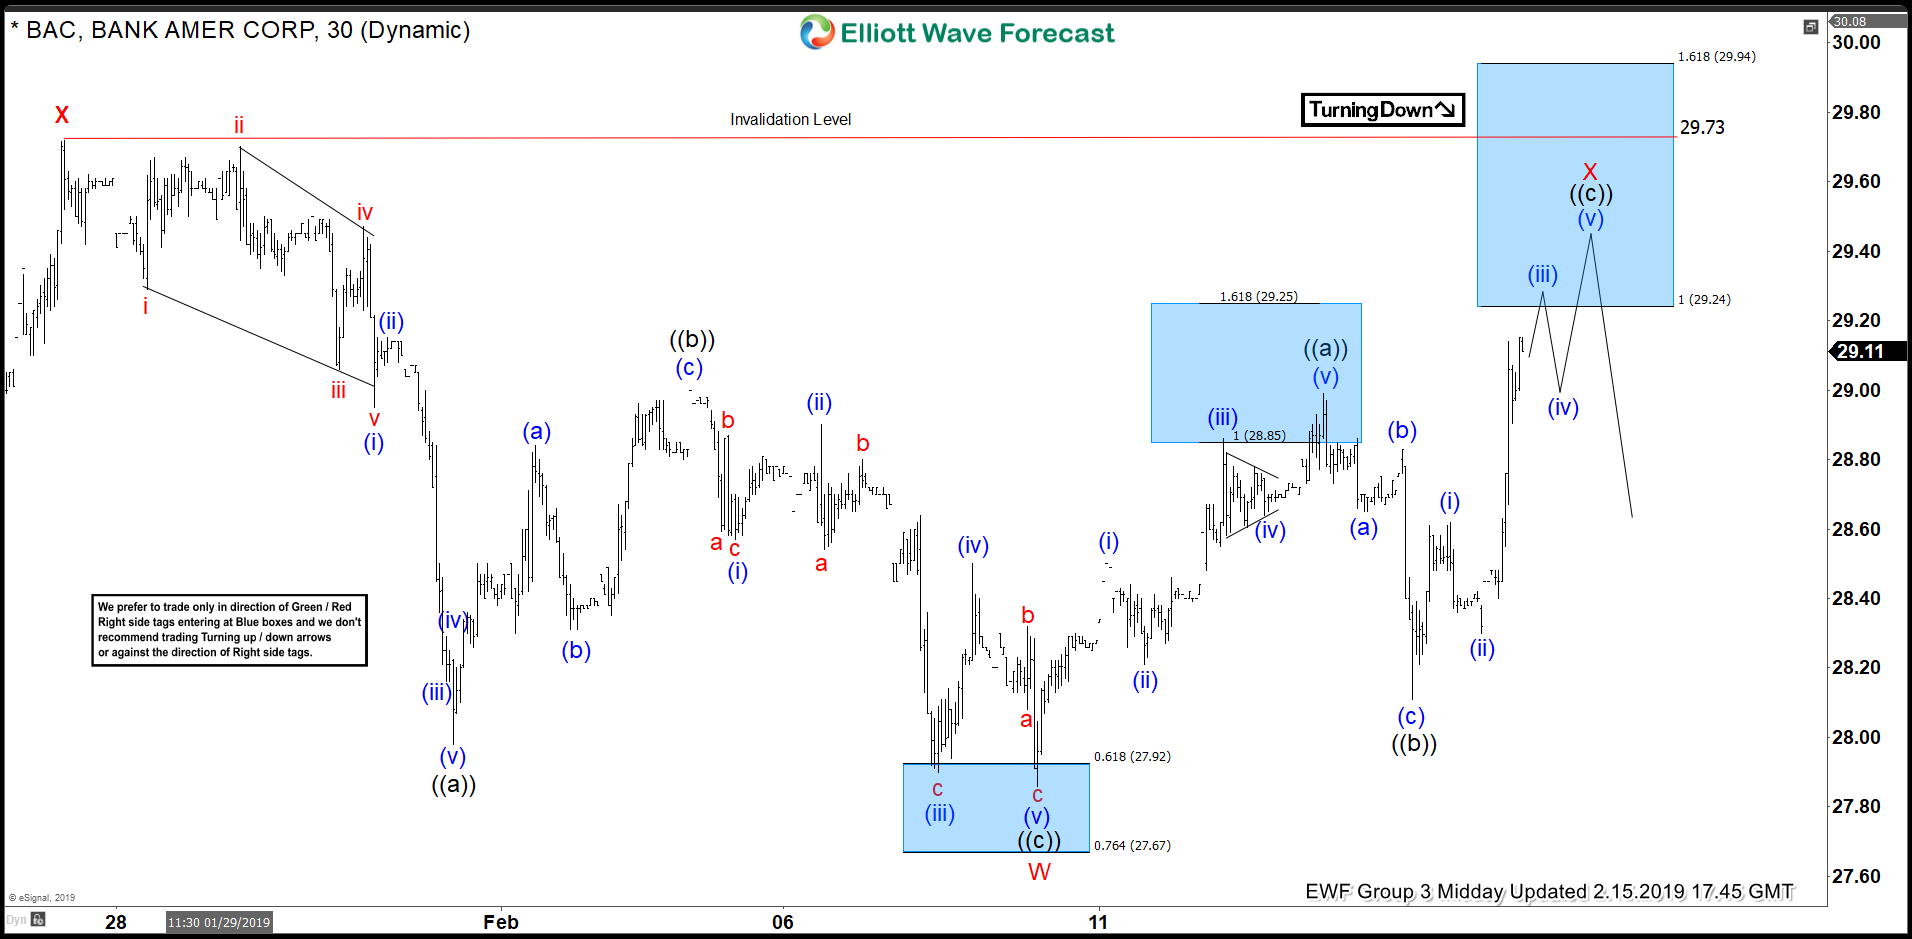
BAC Elliott Wave Analysis: Blue Boxes calling the reaction lower
Read MoreToday, I want to share with you some Elliott Wave charts of the Bank of America stock ( BAC ), which we presented to our members at Elliott Wave Forecast. You see the 1-hour updated chart presented to our clients on the 02/13/19 below. BAC ended the cycle from 01/25/19 peak at the low of 02/08/19 in red wave W. The […]
-
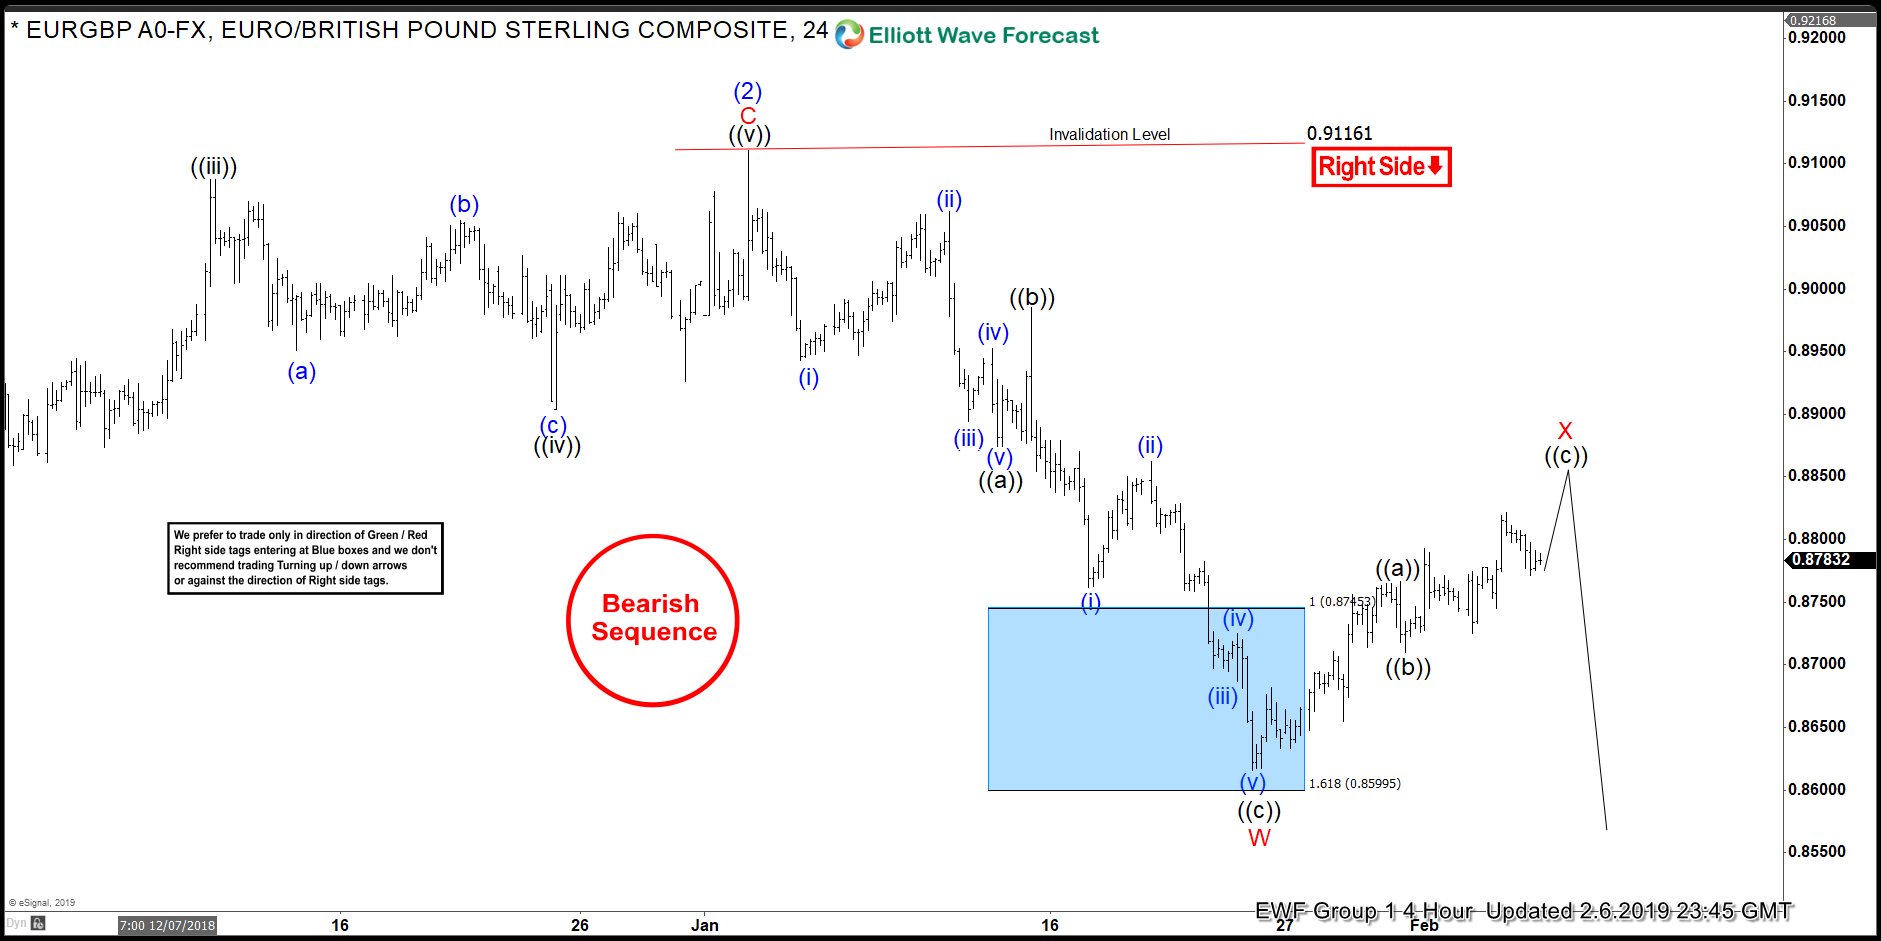
Elliott Wave Analysis: More Downside Expected in EURGBP
Read MoreHello fellow traders. I want to share with you some Elliott Wave charts of EURGBP which we presented to our members at Elliott Wave Forecast. You see the 4-hour updated chart presented to our clients on the 01/26/19 below EURGBP unfolded as an Elliott Wave Zig-Zag structure from 01/02/19 peak. Decline from there ended black wave ((a)) at 0.88768 and wave ((b)) […]
-
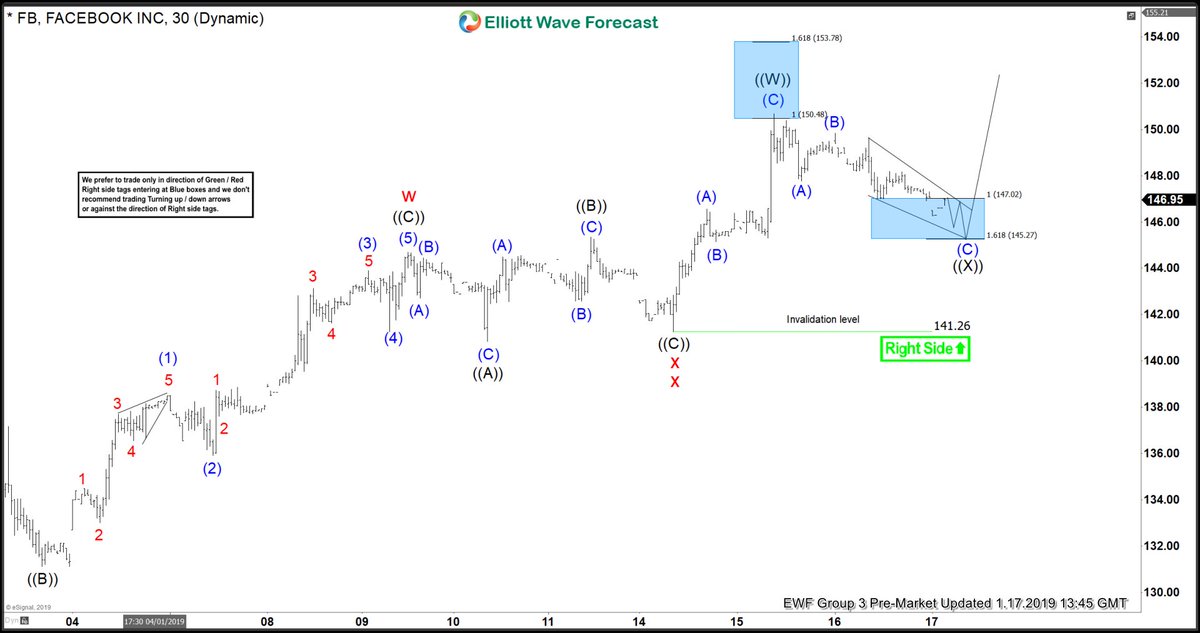
Facebook Elliott Wave View: Found Buyers in Blue Box and Rallied
Read MoreHello fellow traders. Today, I want to share some Elliott Wave charts of the Facebook stock which we presented to our members in the past. Below, you see the 1-hour updated chart presented to our clients on the 01/17/19. showing that FB has a 1H right side tag against 141.26 low. From 01/14/19 low (141.31) Facebook ended that […]
-
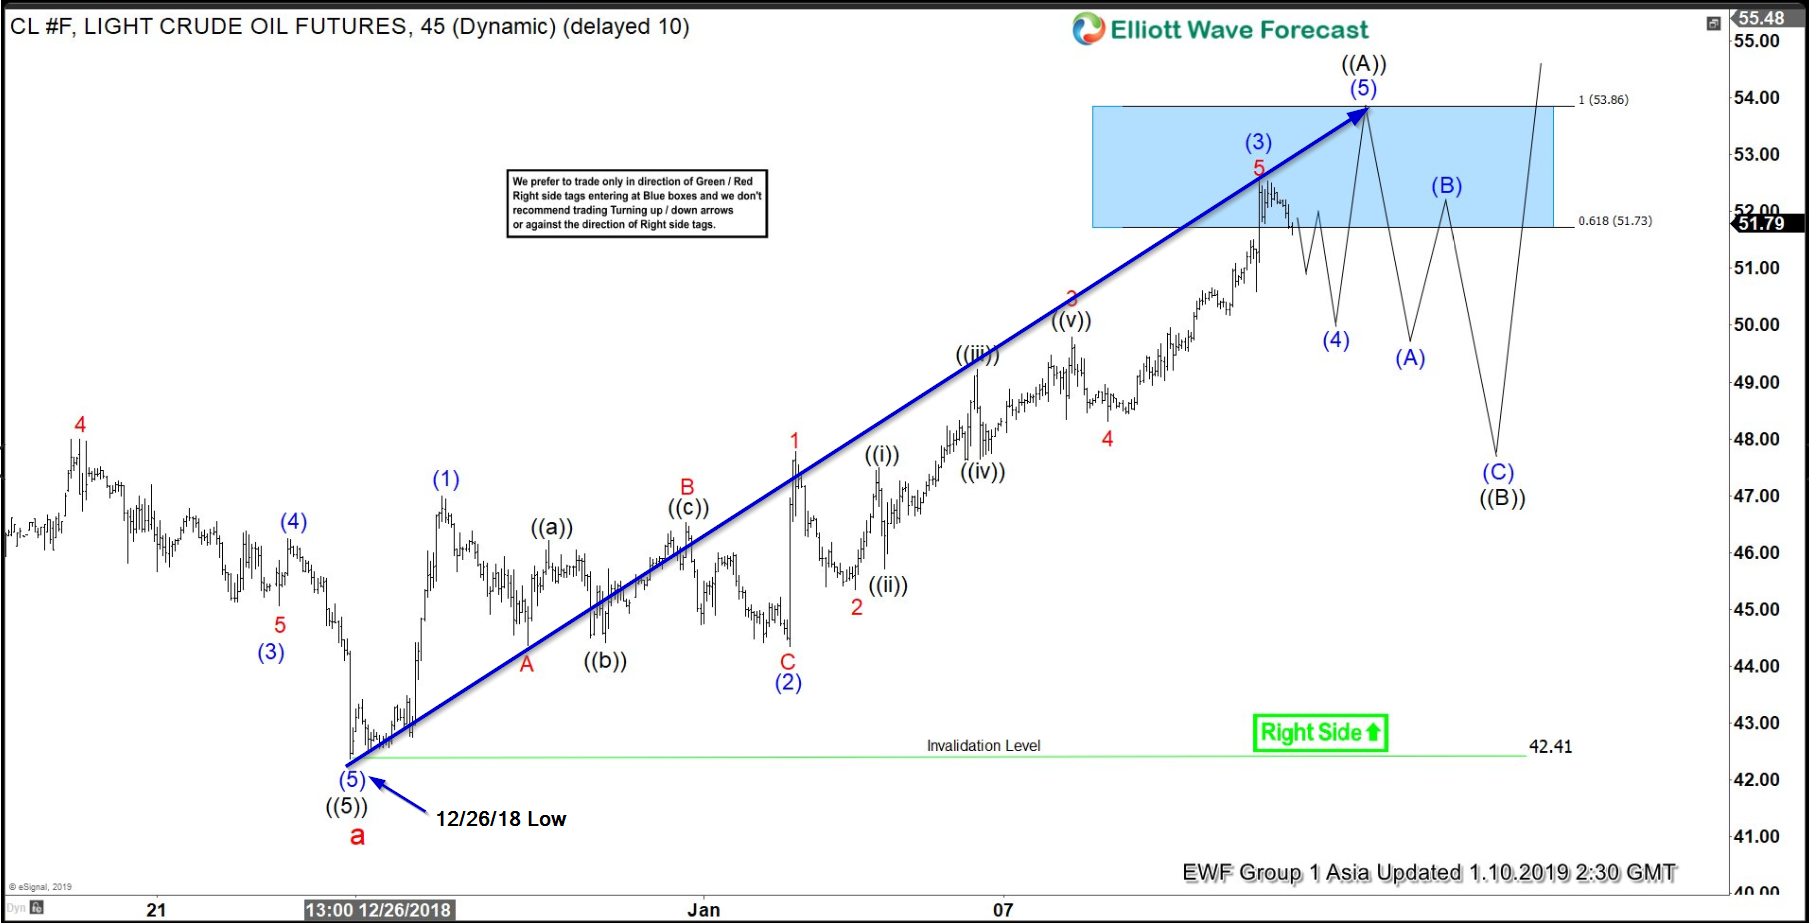
Elliott Wave Analysis: Further Strength Expected in Oil
Read MoreIn this blog, I want to share with you some Elliott Wave charts of Oil which we presented to our members at Elliott Wave Forecast. You see the 1-hour updated chart presented to our clients on the 01/10/19. Oil ended the cycle from 10/03/18 peak in red wave a at 12/26/18 low (42.41). Above from there, we expect […]
-
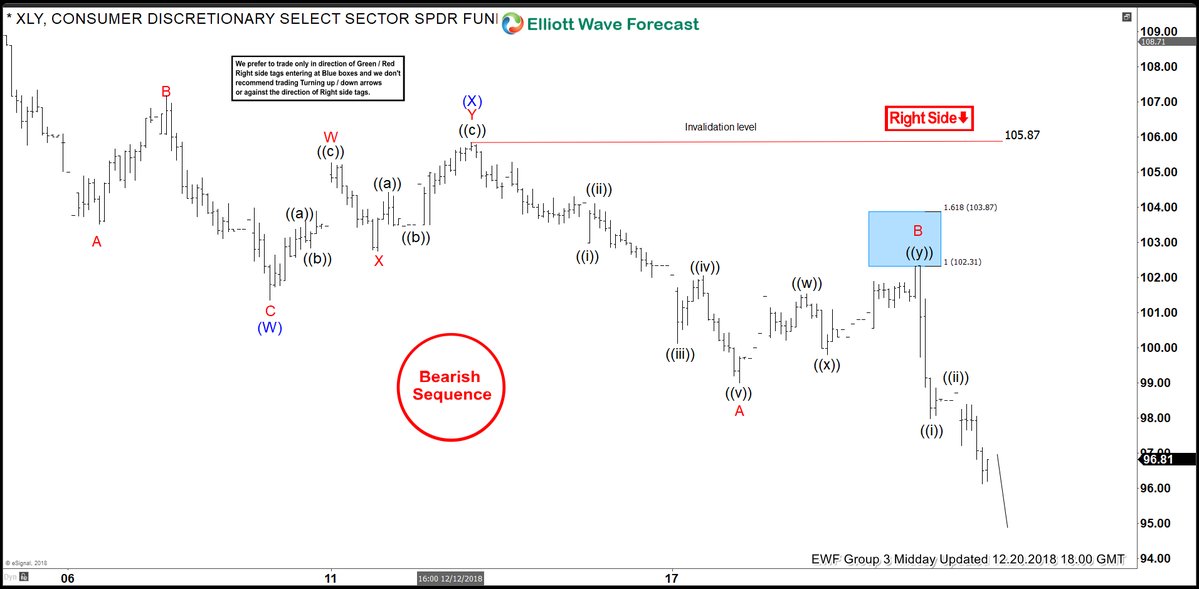
Elliott Wave Analysis: Forecasting And Selling the Decline In XLY
Read MoreIn this blog, I want to share with you some Elliott Wave charts of XLY ETF which we presented to our members last month. You see the 1-hour updated chart presented to our clients on the 12/18/18. XLY had a Bearish sequence suggesting more downside at that time. XLY ended the cycle from 12/12/18 peak in red wave […]
-
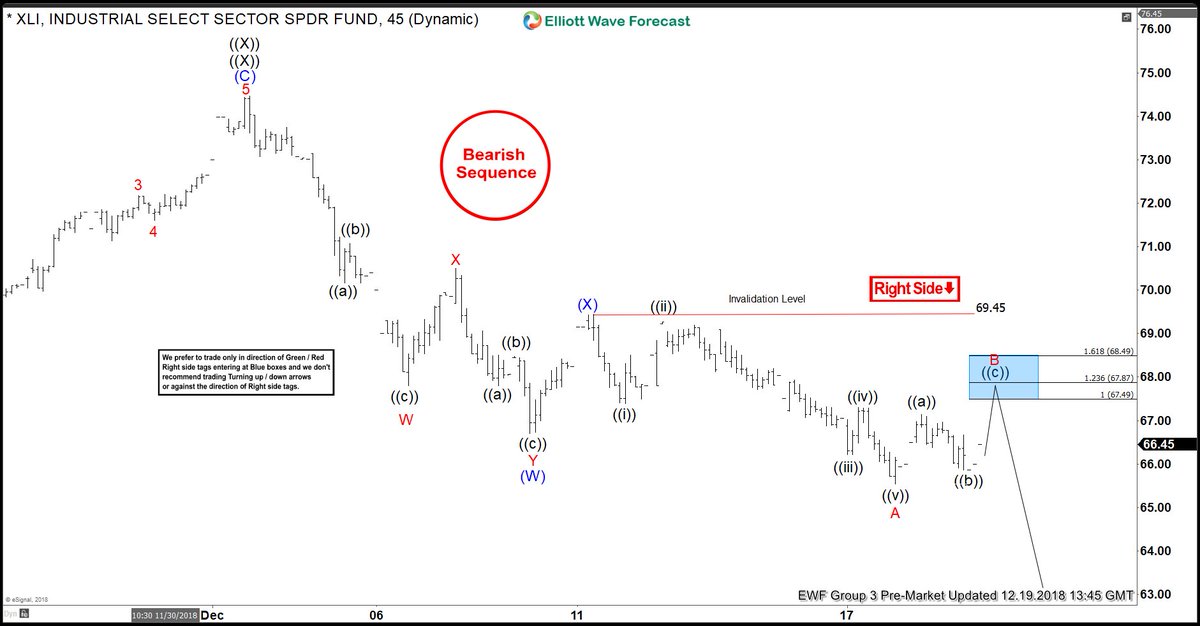
Elliott Wave View: High Frequency Box Suggested XLI Selloff
Read MoreToday, we will have a look at Elliott Wave charts of XLI which we presented to our members in the past. You see the 1-hour updated chart presented to our clients on the 12/19/18. XLI had a Bearish sequence suggesting more downside. XLI ended the cycle from 12/11/18 peak in red wave A at 12/17/18 low (65.51). Above […]