
-

EURJPY Elliott Wave Analysis: More Downside Expected
Read MoreEURJPY short-term Elliott wave analysis suggests that the decline to 129.13 low ended Minor wave A. The internals of that decline unfolded in 5 waves impulse structure in a lesser degree cycle. Thus suggests that the pair can be doing a Zigzag correction lower. Up from there, a bounce to 130.18 high ended Minor wave […]
-
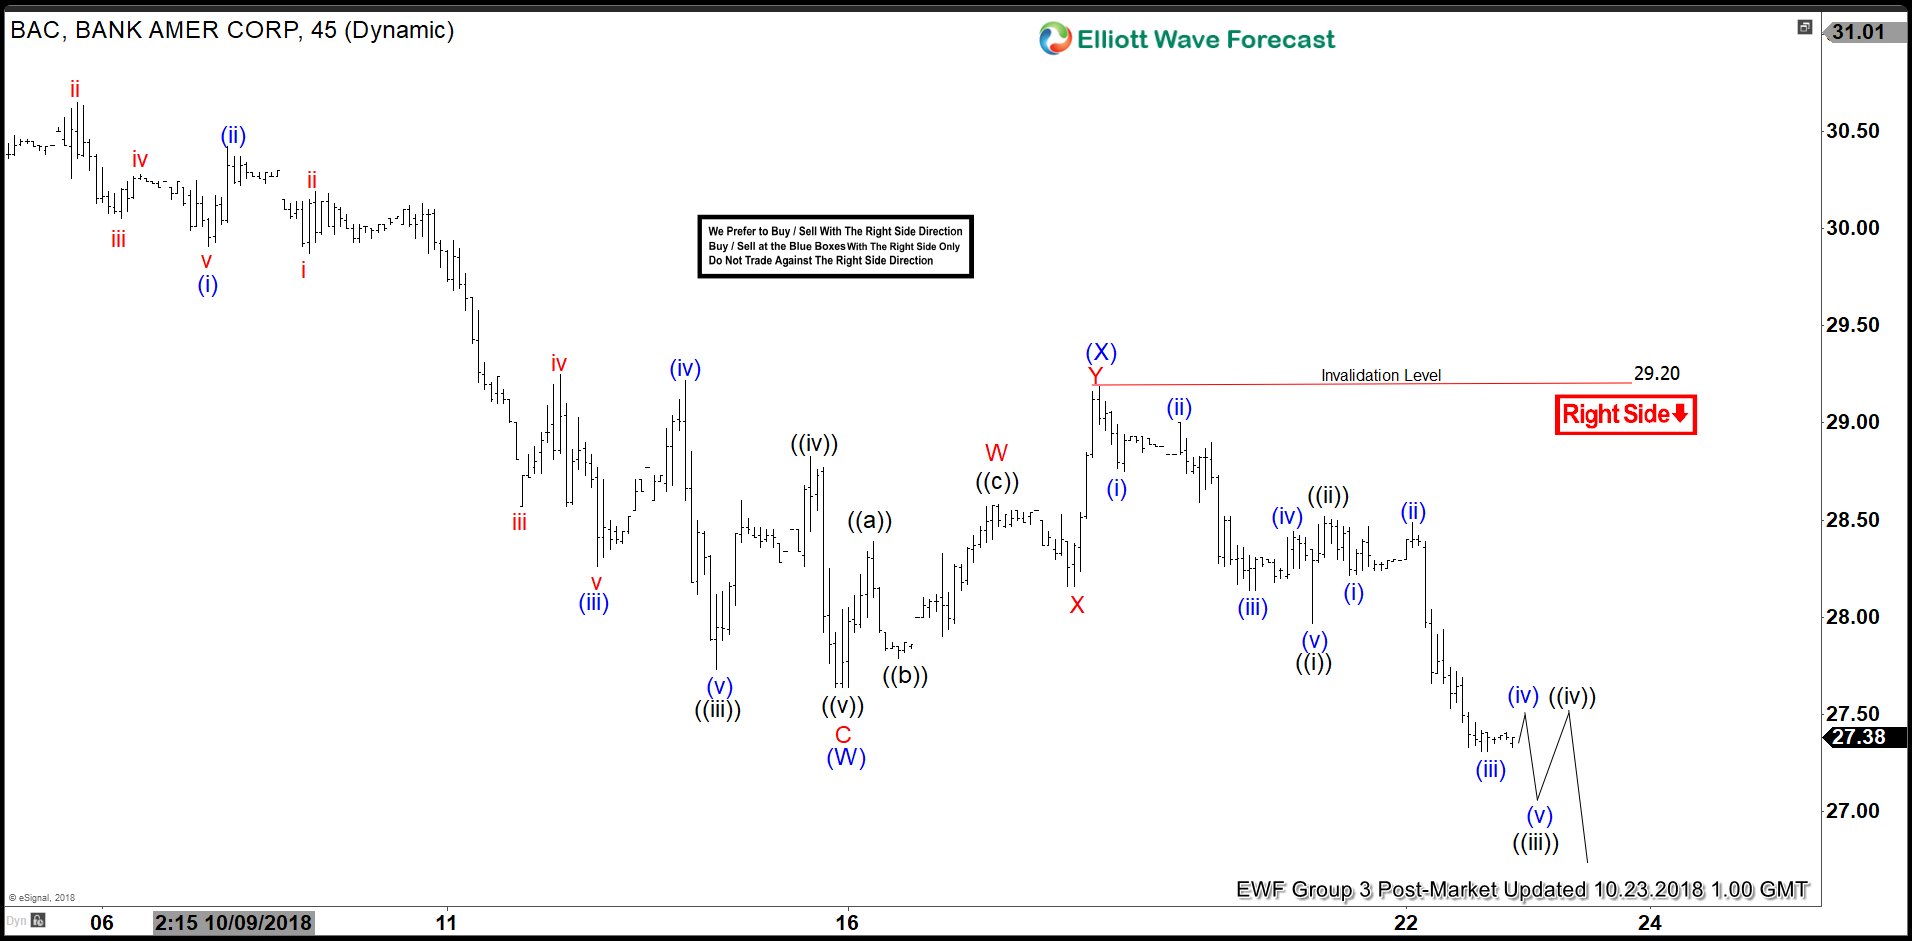
BAC Elliott Wave View: Started The Next Leg Lower
Read MoreBank of America Corporation ticker symbol: BAC short-term Elliott wave view suggests that a decline from 8/08/2018 high to $27.64 low ended intermediate wave (W). The internals of that decline unfolded in 3 swings with the distribution of 5-3-5 zigzag structure. Up from there, a bounce to $29.20 high ended the short-term correction against 8/08/2018 […]
-
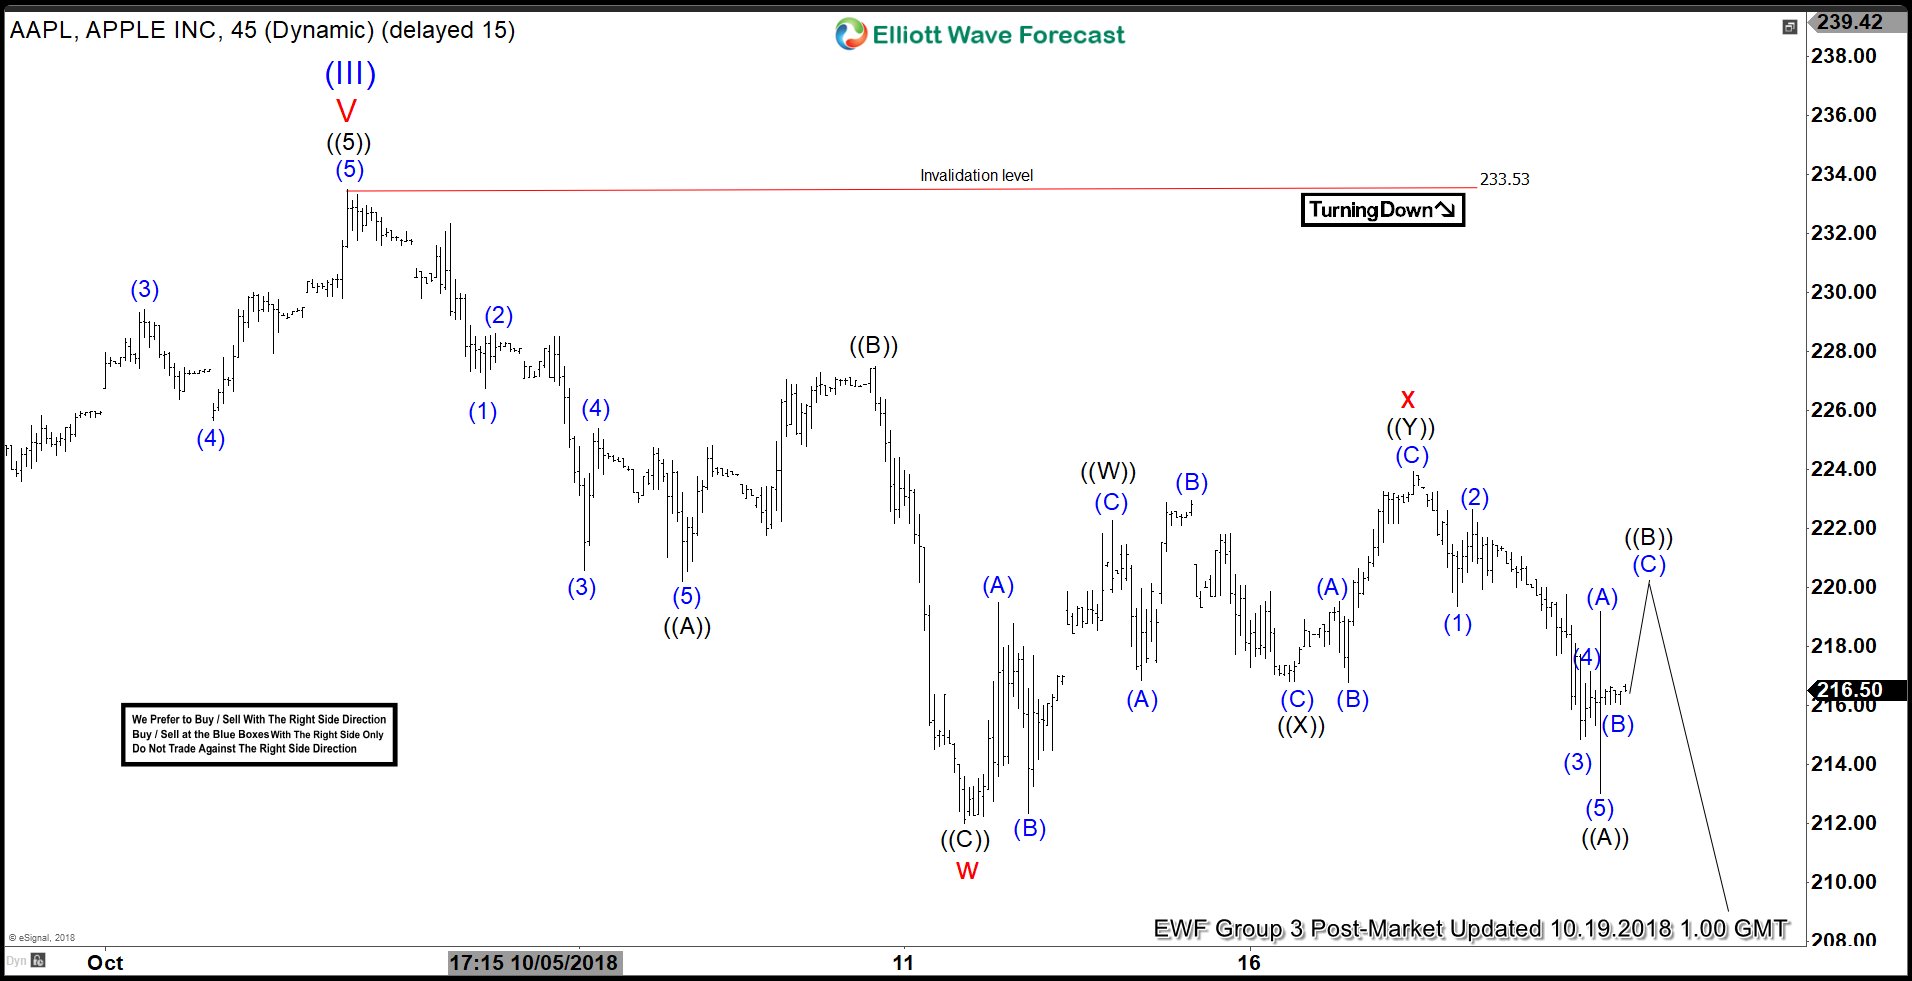
AAPL Elliott Wave View: Ready For Next Leg Lower
Read MoreAAPL short-term Elliott wave view suggests that a rally to $233.53 high ended supercycle degree wave (III) as an impulse. Down from there, supercycle degree wave (IV) remains in progress as double three structure. Where the initial decline to $212 low ended cycle degree wave w. The internals of that leg lower unfolded as a Zigzag […]
-
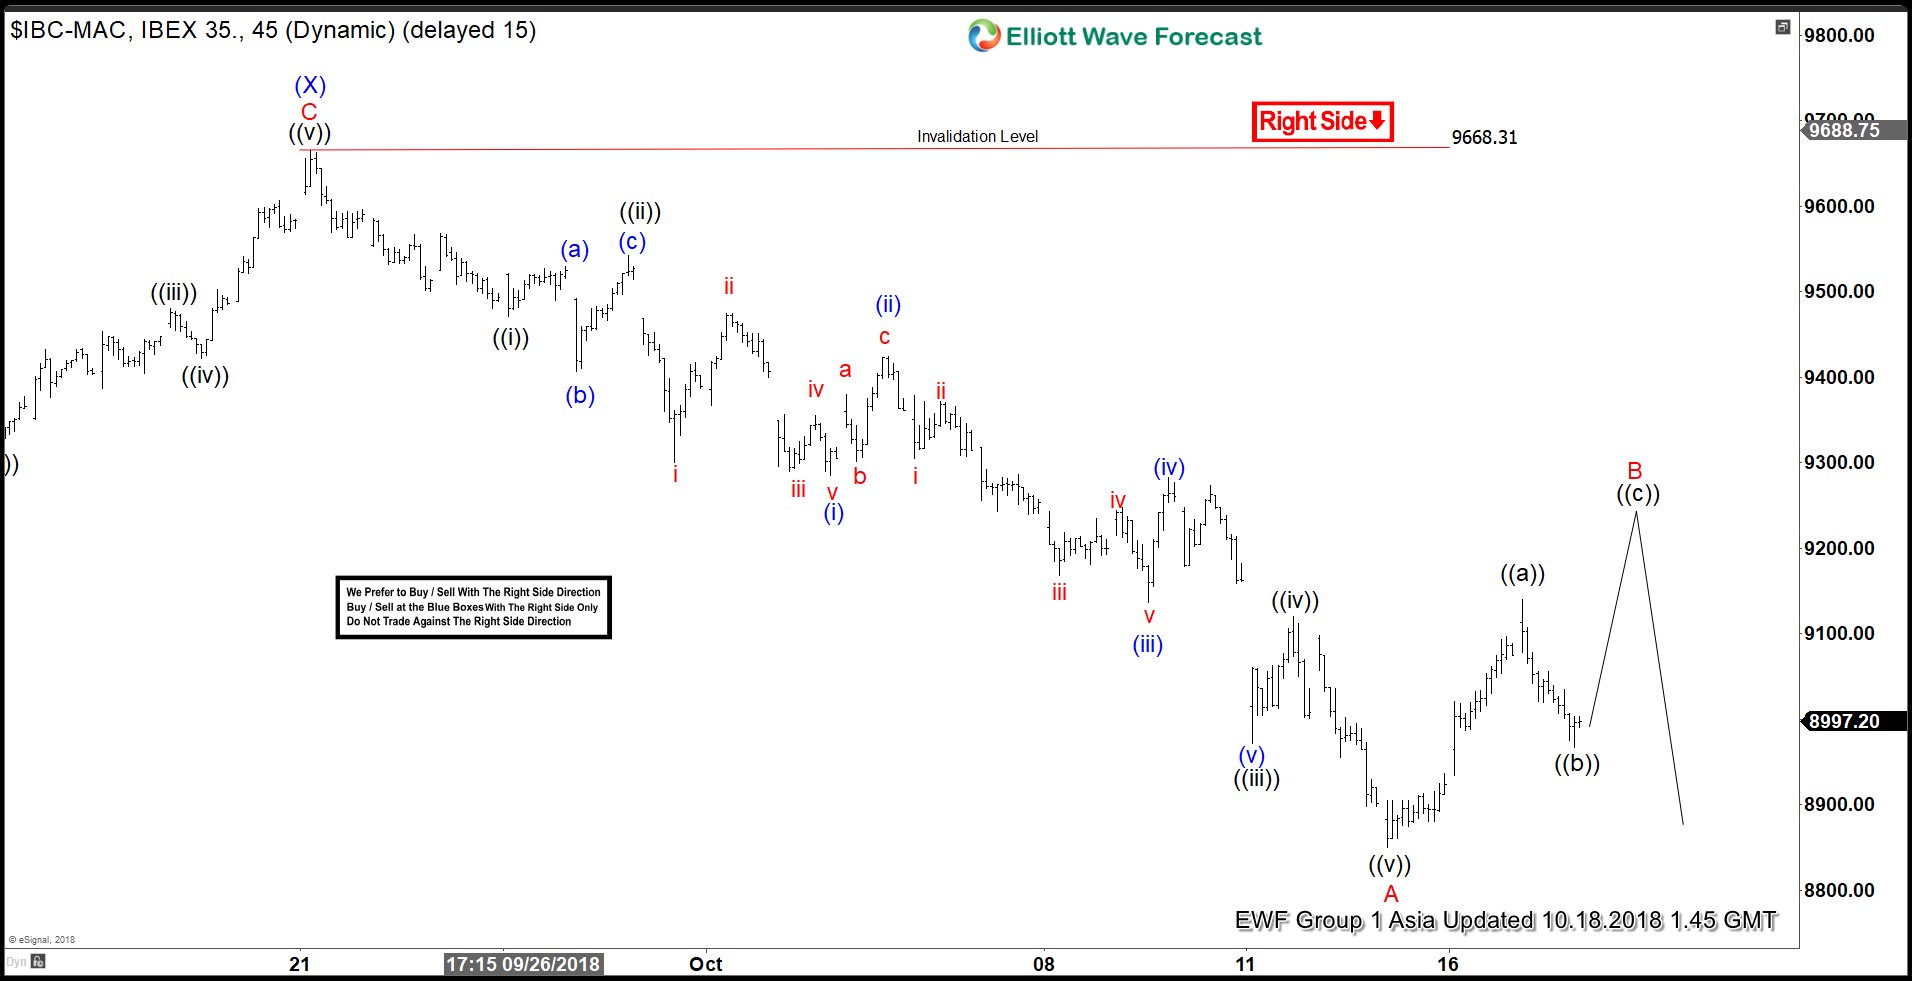
IBEX Elliott Wave Calling Rally To Fail For Further Downside
Read MoreIBEX short-term Elliott wave view suggests that a rally to 9668.31 high ended intermediate wave (X) bounce. Down from there, the index made a declined in 5 waves impulse structure. And ended Minor wave A of a zigzag structure at 8850.20 low. Where the lesser degree Minute wave ((i)) ended at 9471.20 low. Up from […]
-
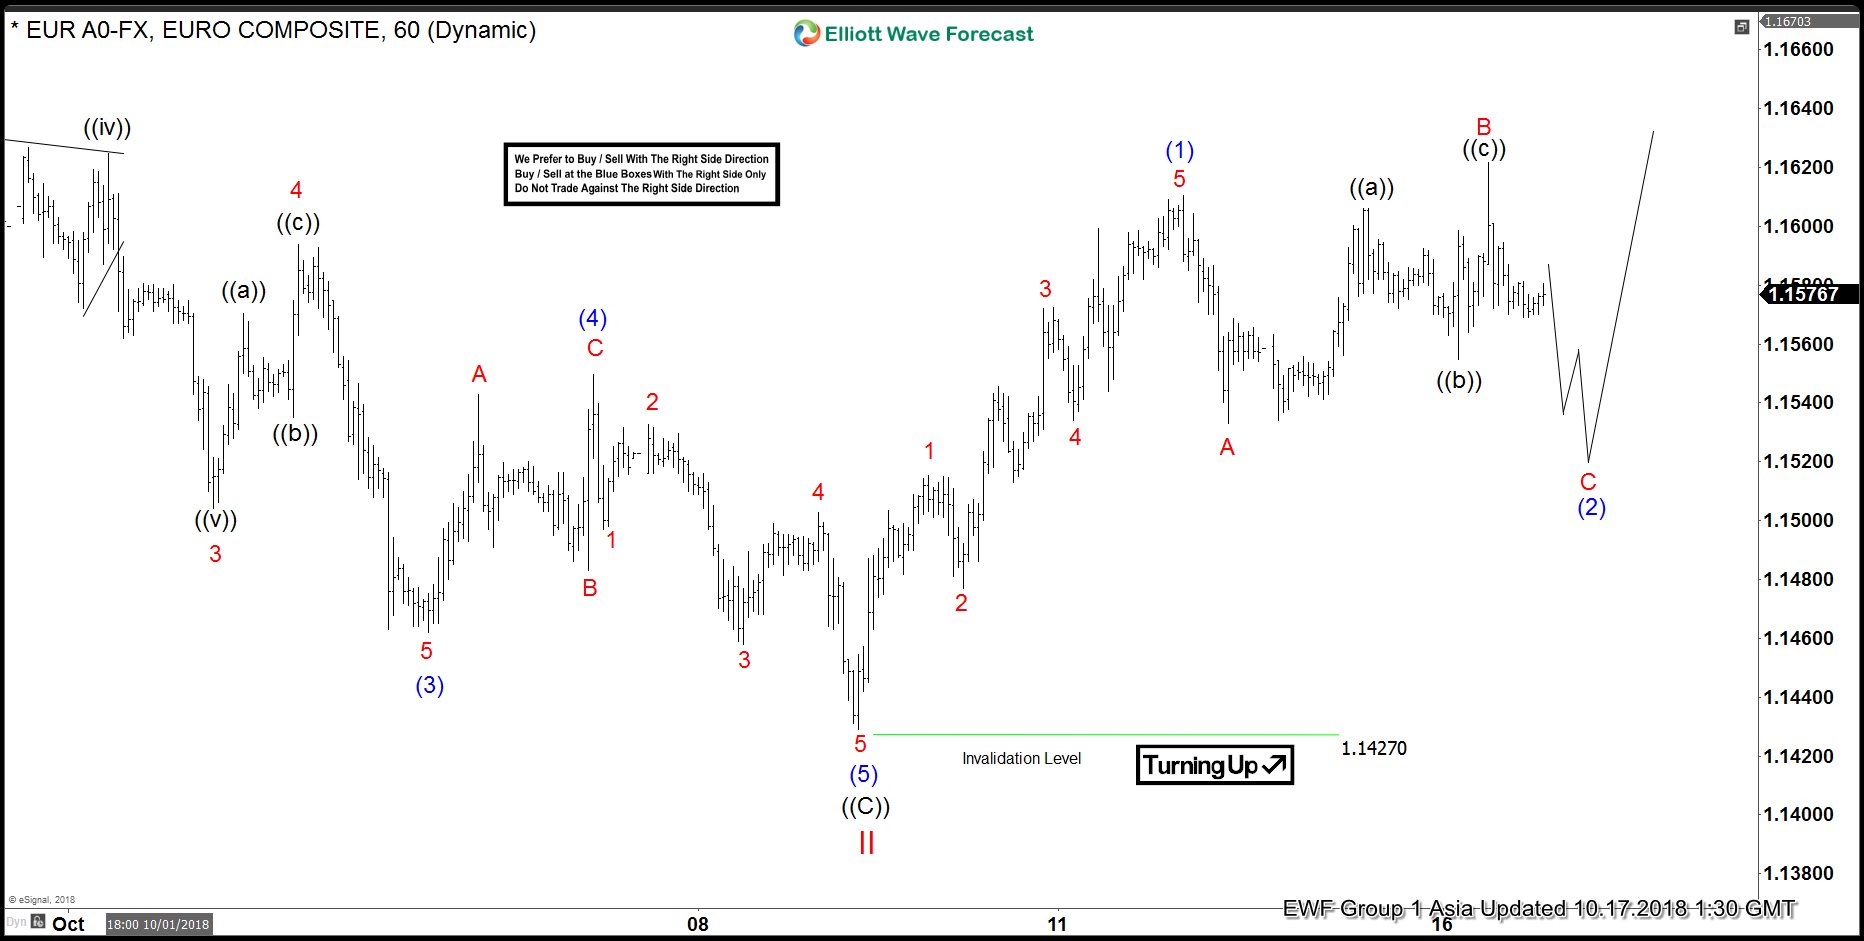
EURUSD Elliott Wave: Ready For Next Leg Higher
Read MoreEURUSD short-term Elliott wave view suggests that the decline to 1.1427 low ended cycle degree wave II pullback. The internals of that pullback unfolded as a Flat structure which ended the correction against 8/15/2018 low. Up from 1.1427 low, the pair is expected to resume the next leg higher in cycle degree wave III. The […]
-
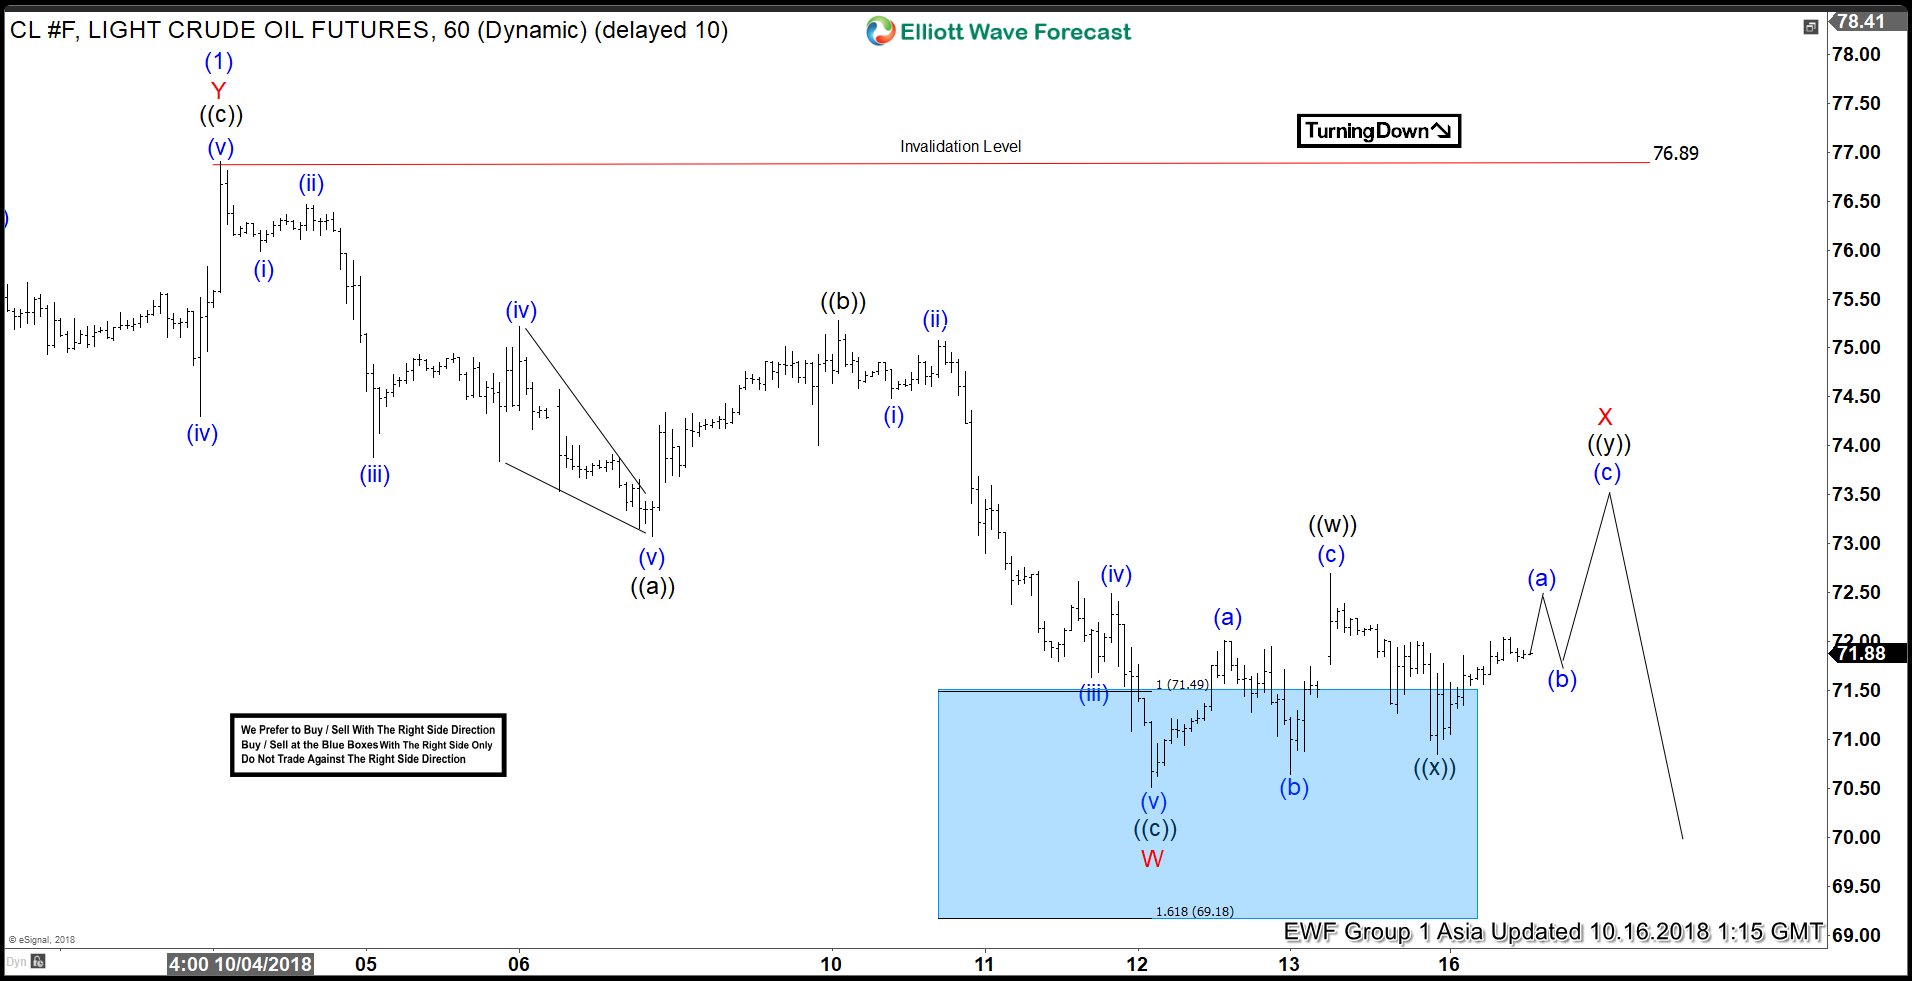
Another Leg Lower Can Enter OIL Into Buying Area?
Read MoreOIL ticker symbol $CL_F short-term Elliott wave view suggests that a rally to 76.89 high ended the cycle from 8/15/2018 low in intermediate wave (1). The internals of that rally higher unfolded in a corrective structure thus suggests the instrument can be doing ending diagonal structure in primary wave ((5)) higher. Down from there, intermediate […]