
-
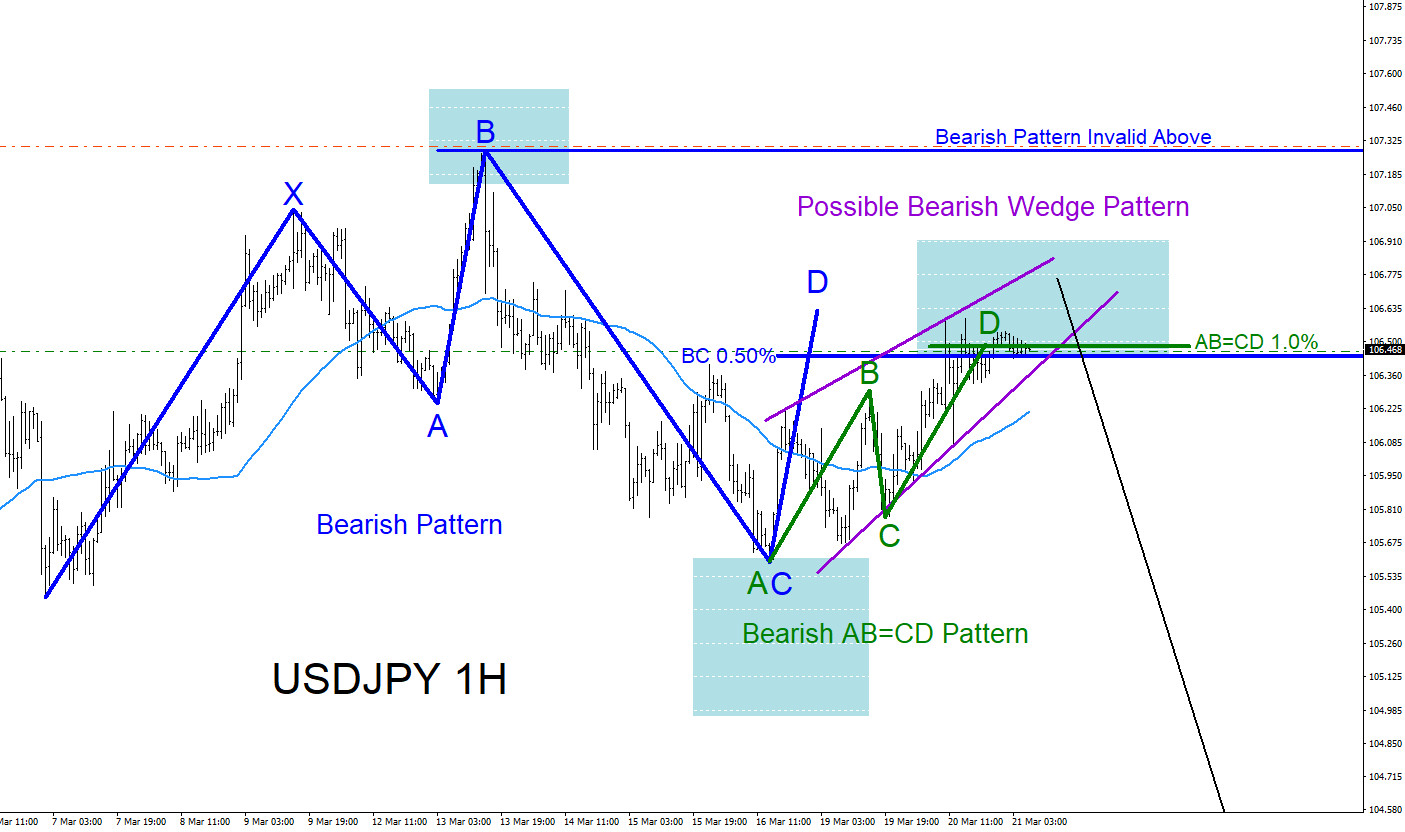
USDJPY : Trading Market Patterns
Read MoreUSDJPY 1 Hour Chart 3.21.2018 USDJPY was showing market patterns telling traders that the possiblity of the pair moving lower was coming. On March 21/2018 I posted the above USDJPY 1 hour chart trade setup on Twitter @AidanFX calling that the pair will make another move lower. Market patterns were clearly visible for bears to […]
-
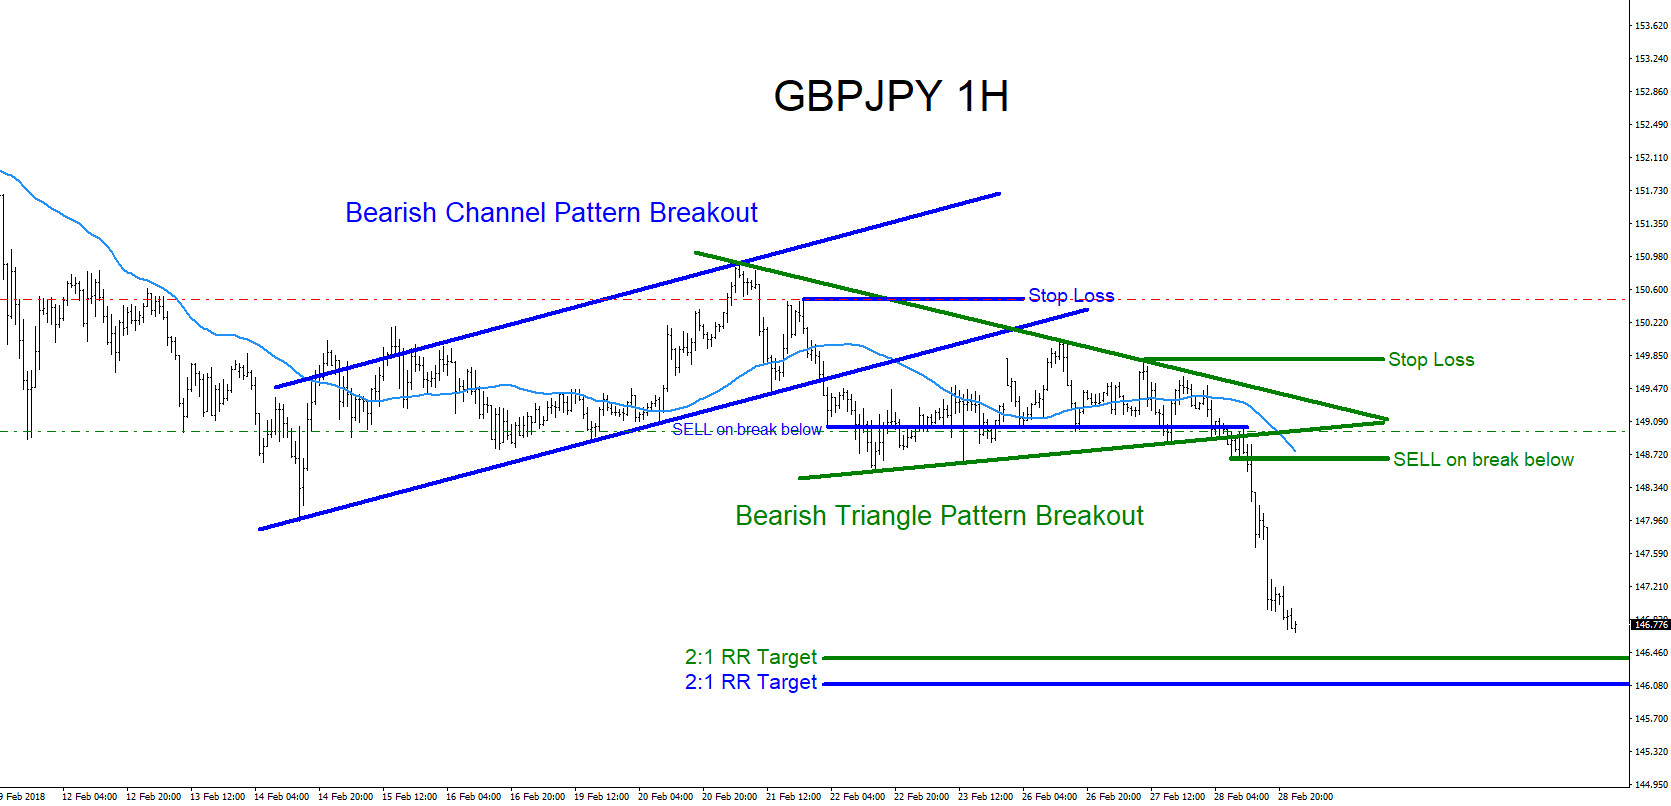
GBPJPY : Trading Market Patterns
Read MoreGBPJPY Elliott Wave pattern, Harmonic pattern, Head and Shoulder pattern, Channel pattern, Wedge pattern, Triangle pattern, Cup and Handle pattern, W. Wave pattern, Double and Triple Bottom/Top patterns, Pennant pattern, Flag pattern are all market patterns that every trader sees everyday on every time frame. These market patterns all have precise trading entry levels and […]
-
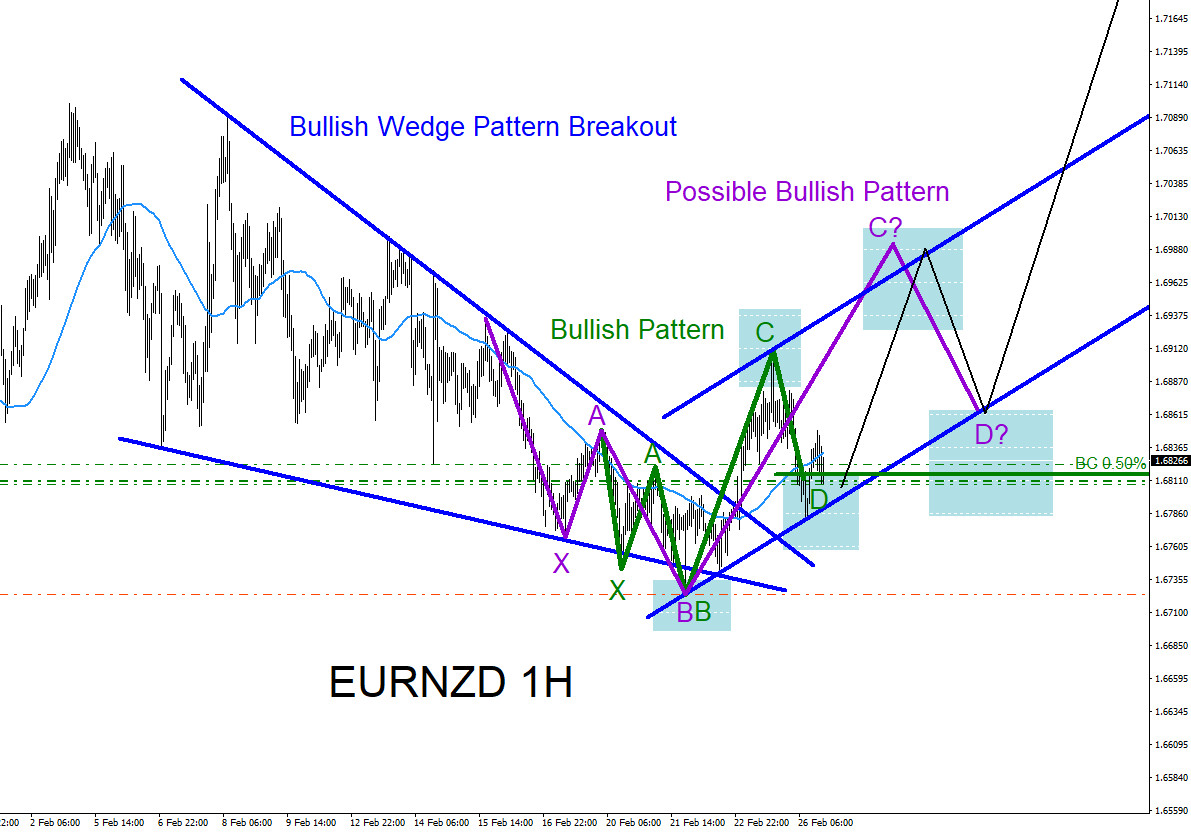
EURNZD : Calling Another Move Higher
Read MoreEURNZD Technical Analysis 2.26.2018 Looking at the 1 hour timeframe of EURNZD, the pair has found a temporary bottom on February 21/2018 and was followed by a good bounce higher. The bounce higher from the February 21 lows has done an Elliott Wave five wave impulse pattern calling for a continuation higher after a small […]
-
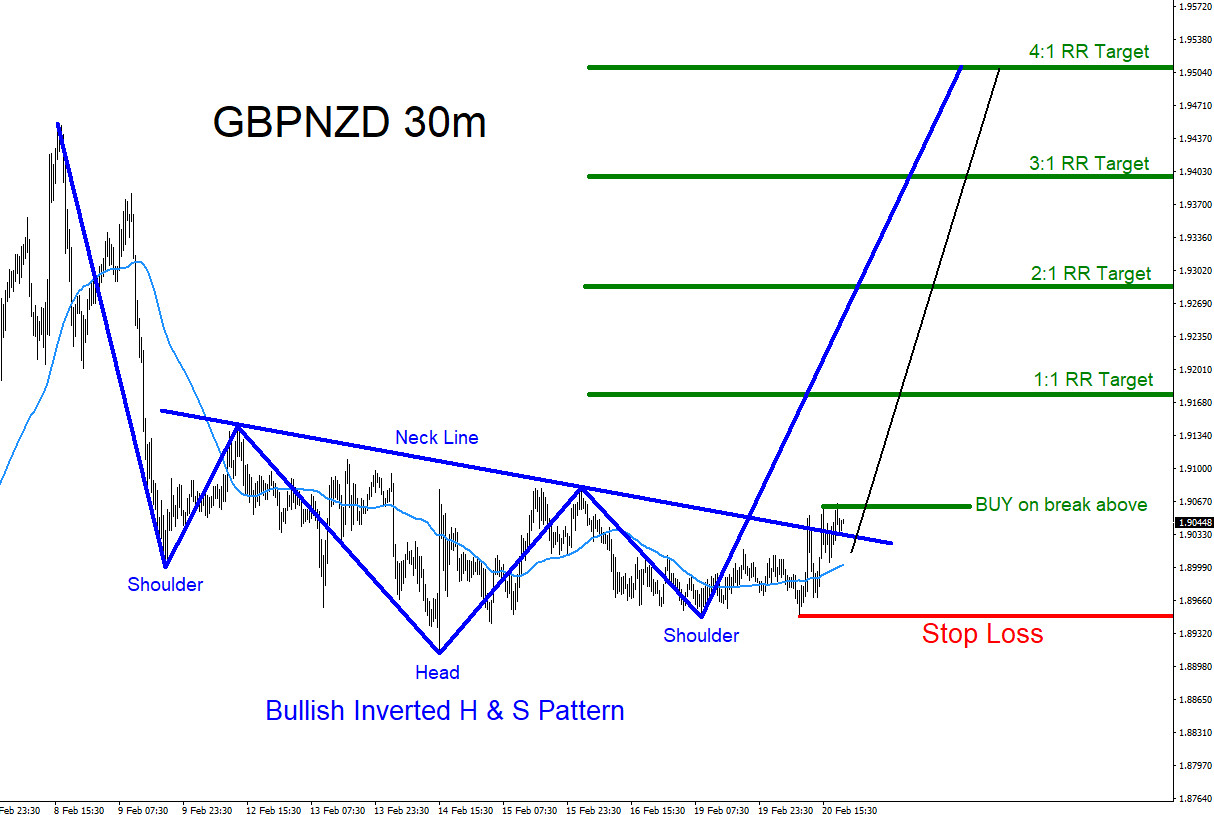
GBPNZD : Possible Breakout Higher
Read MoreGBPNZD Possible BUY/LONG Trade Setup GBPNZD is forming a bullish inverted Head and Shoulders pattern. Price has already broke above the neck line which can be a signal that possibly more bulls will be entering LONGS and can start pushing the pair higher. Traders should watch for a good strong break above the green BUY […]
-
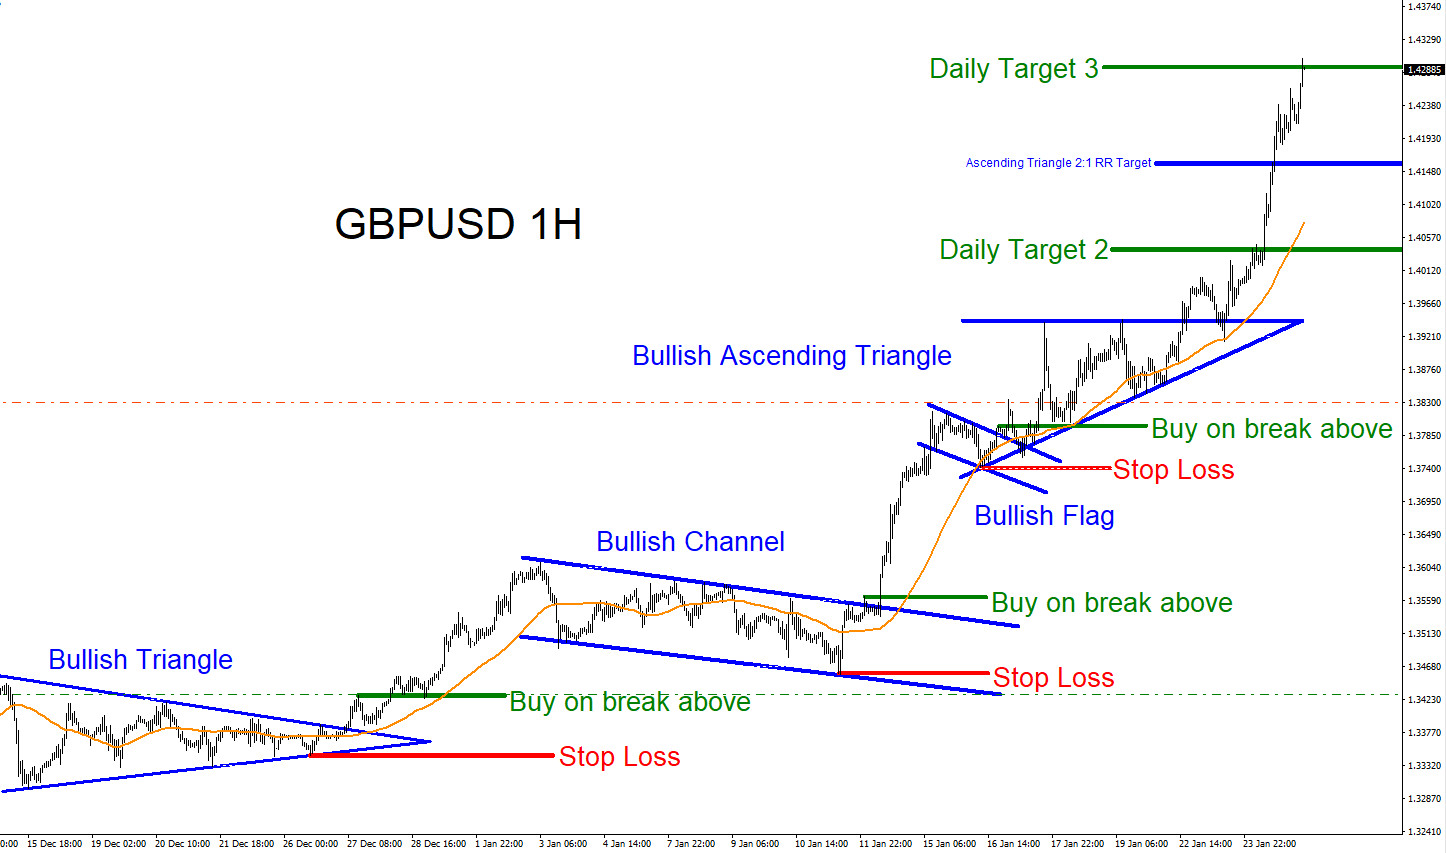
GBPUSD : Trading Market Pattern Breakouts
Read MoreGBPUSD Technical Analysis 1.26.2018 GBPUSD from December 28/2017 till January 25/2018 has produced 4 market pattern breakouts where traders could have entered LONG positions and rode the market rally to the upside. Since December 28/2017 the pair has extended over 900 pips to the upside. The chart below will show how any trader could have […]
-
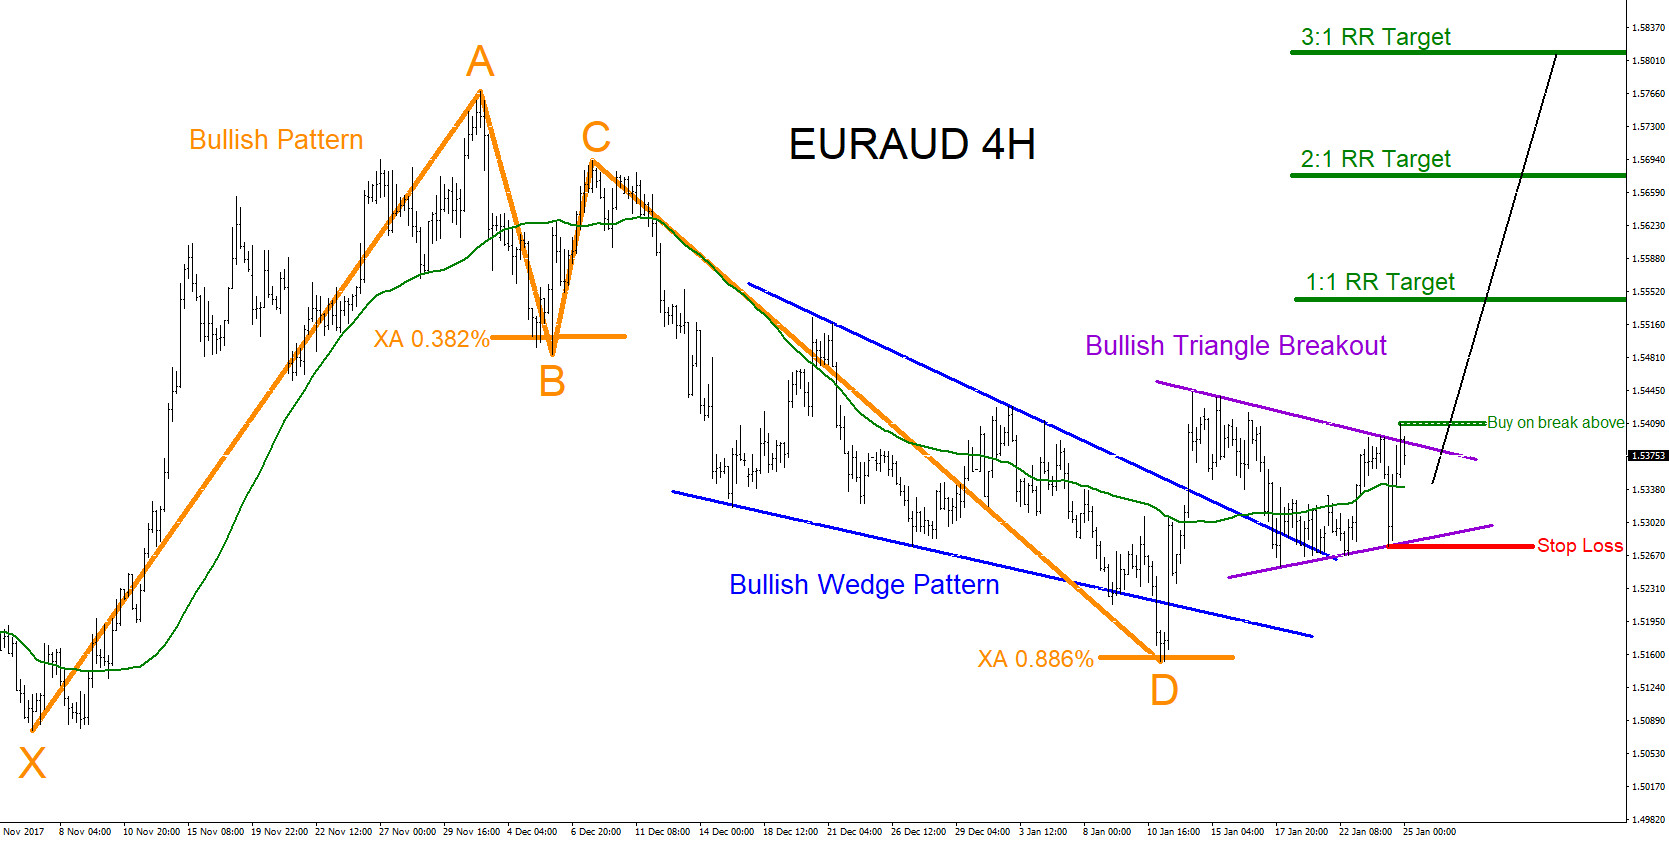
EURAUD : Will Pair Push Higher?
Read MoreEURAUD Technical Analysis 1.25.2018 EURAUD has potential to push higher. Bullish patterns are visible and just waiting for price to start rallying to the upside. On the chart below the orange bullish pattern already triggered buys at the XA 0.886% Fib. retracement level and bounced higher. On the bounce higher the pair broke above the […]