
-
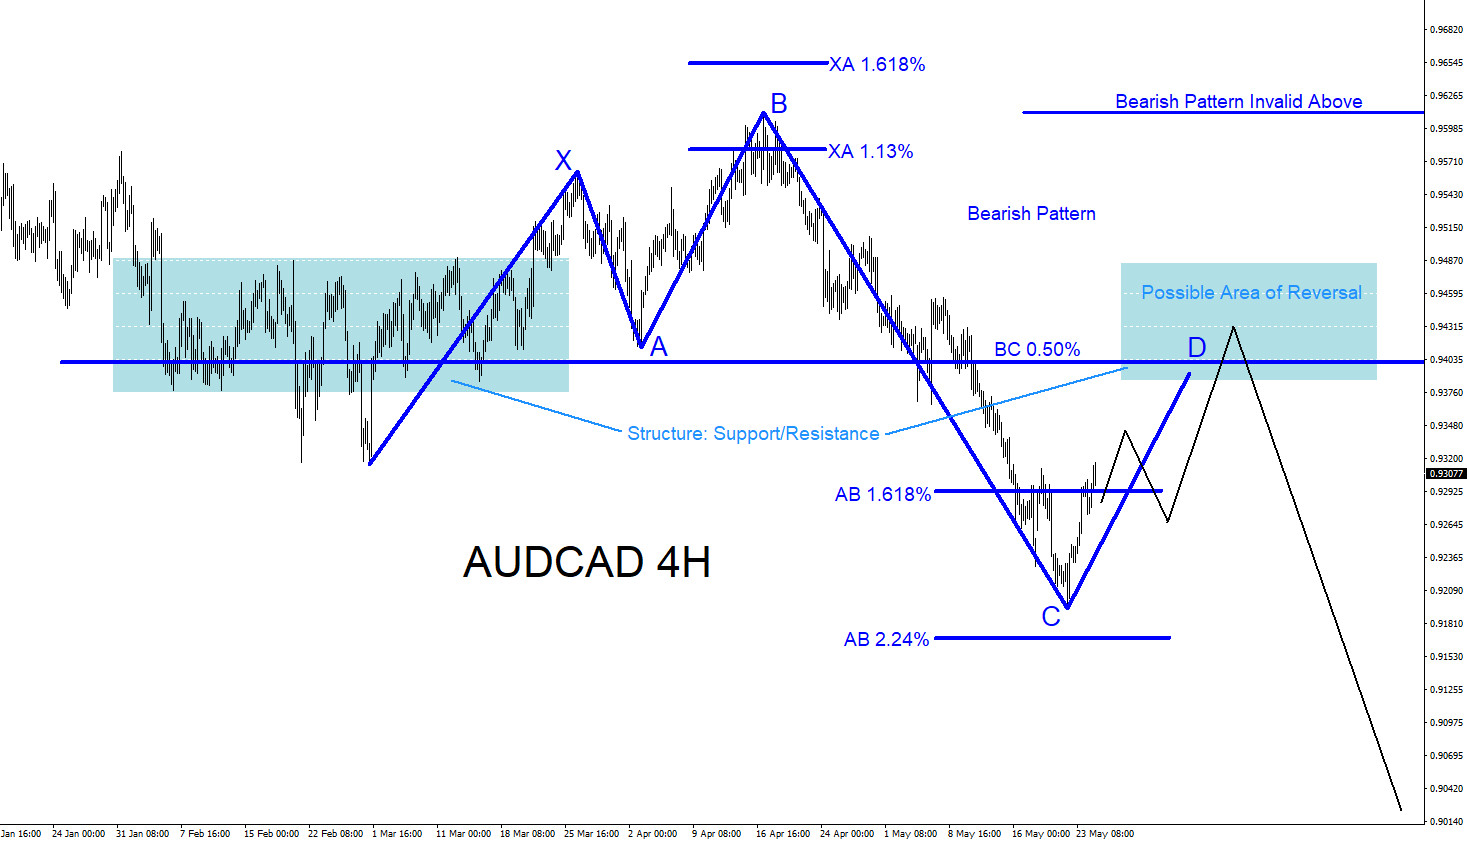
AUDCAD : Will Pair Continue Lower?
Read MoreAUDCAD Technical Analysis May 24/2019 AUDCAD remains bearish as long as the April 17/2019 high remains untouched. On the 4 hour chart there is a clear visible bearish pattern that can be seen. The blue bearish pattern triggers SELLS at the BC 0.50% Fib. retracement level. Price has still not reached this level so traders […]
-
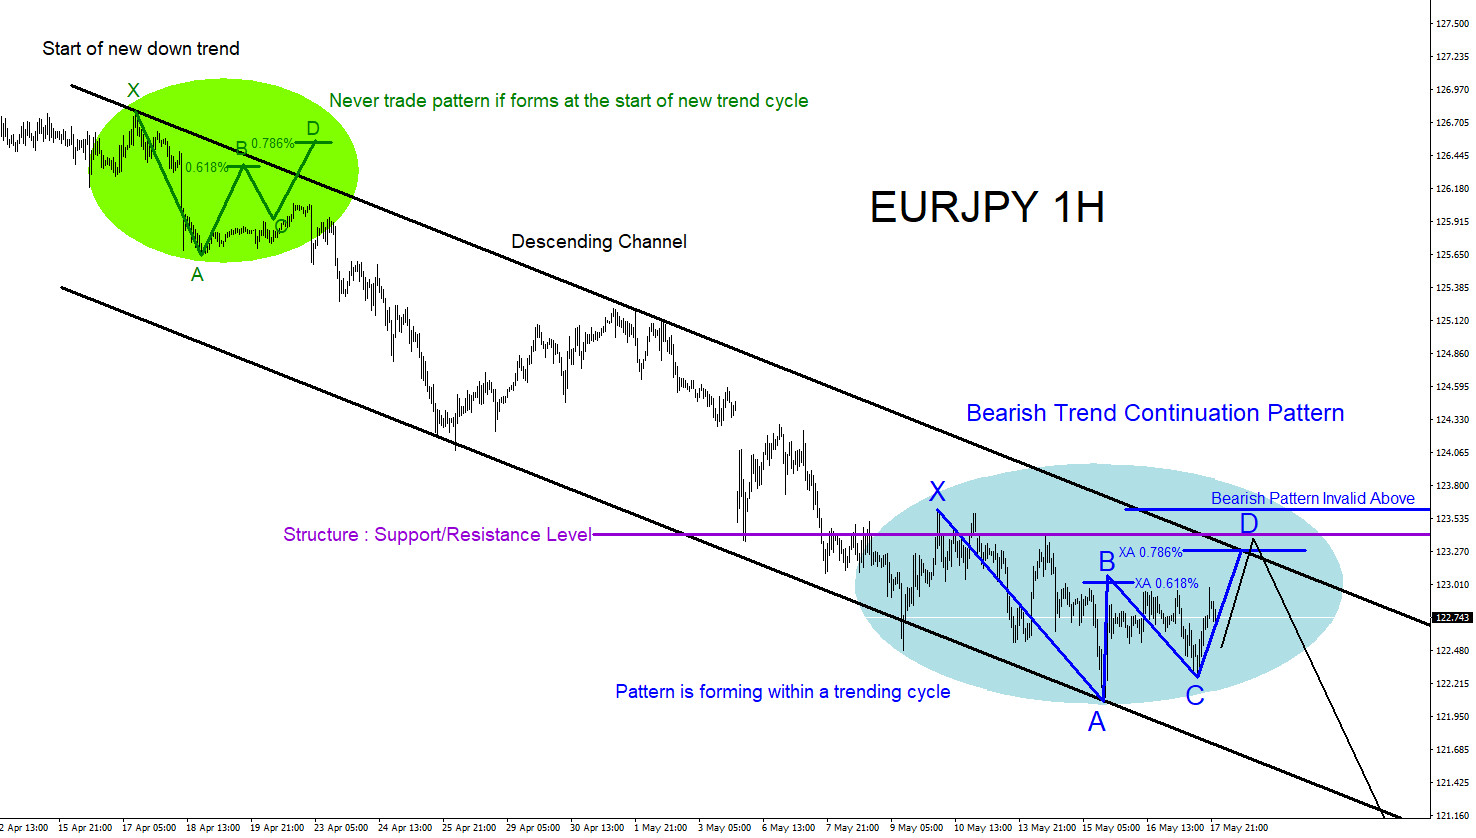
EURJPY : Trend Continuation Market Pattern Forming?
Read MoreEURJPY Technical Analysis May 17/2019 EURJPY can be possibly forming a bearish Gartley pattern. A Gartley pattern is a continuation of trend market pattern. This market pattern must form within a trending cycle and should never be traded if it forms at the beginning of a new trend cycle. The Gartley market pattern needs 5 […]
-
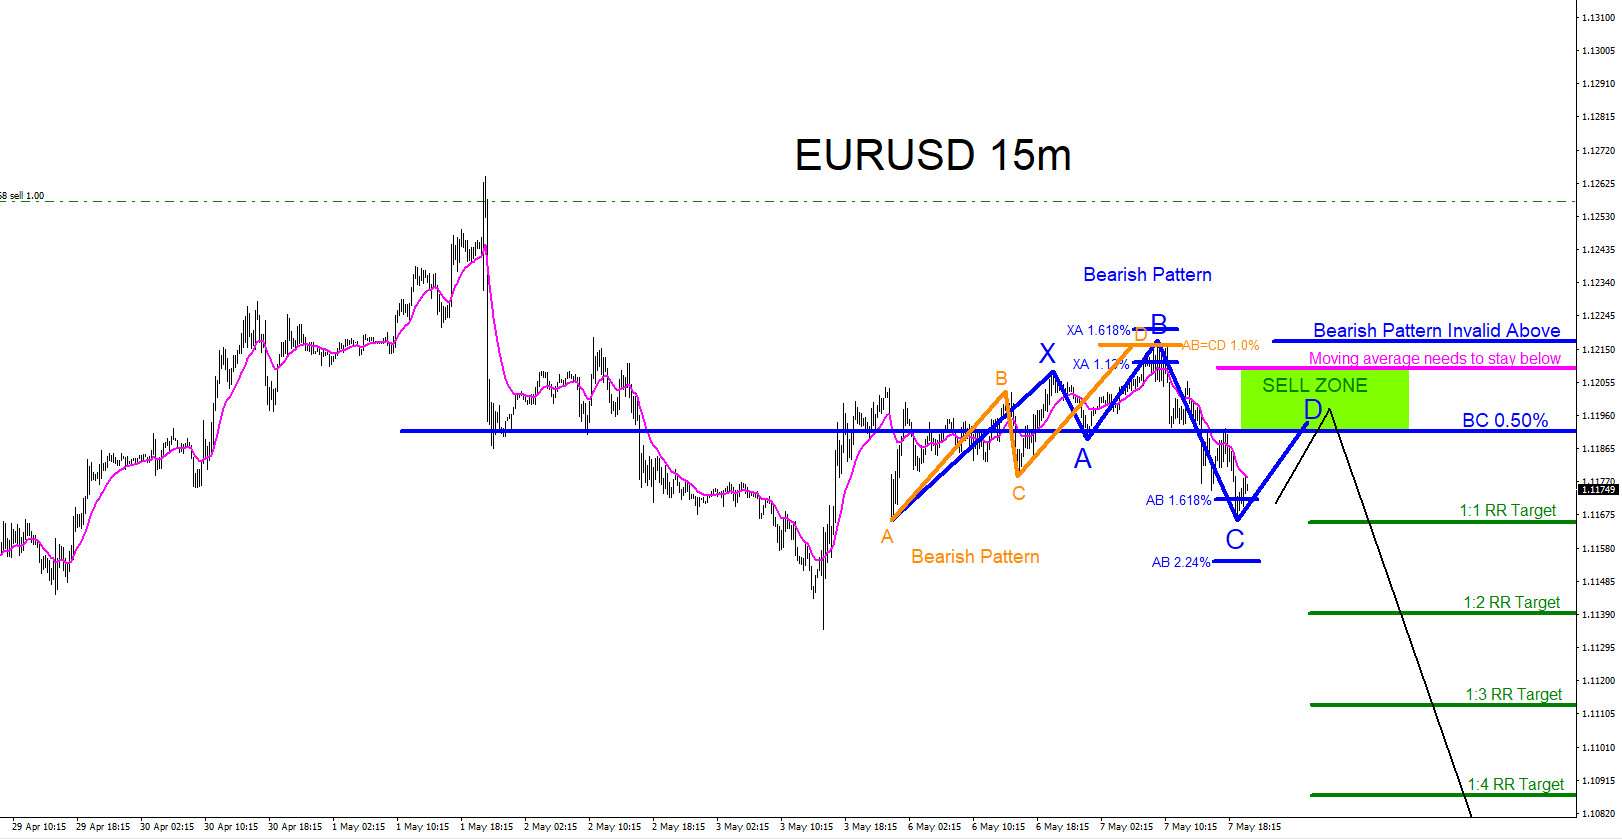
EURUSD : Sell Trade Setup
Read MoreEURUSD Technical Analysis May 7/2019 EURUSD : Bearish market patterns can be seen on the EURUSD 15 minute chart. In the chart below blue bearish pattern triggers SELLS at the BC 0.50% Fib. retracement level. The orange bearish pattern already has triggered SELLS at the AB=CD 1.0% Fib. extension level signalling for more downside in […]
-
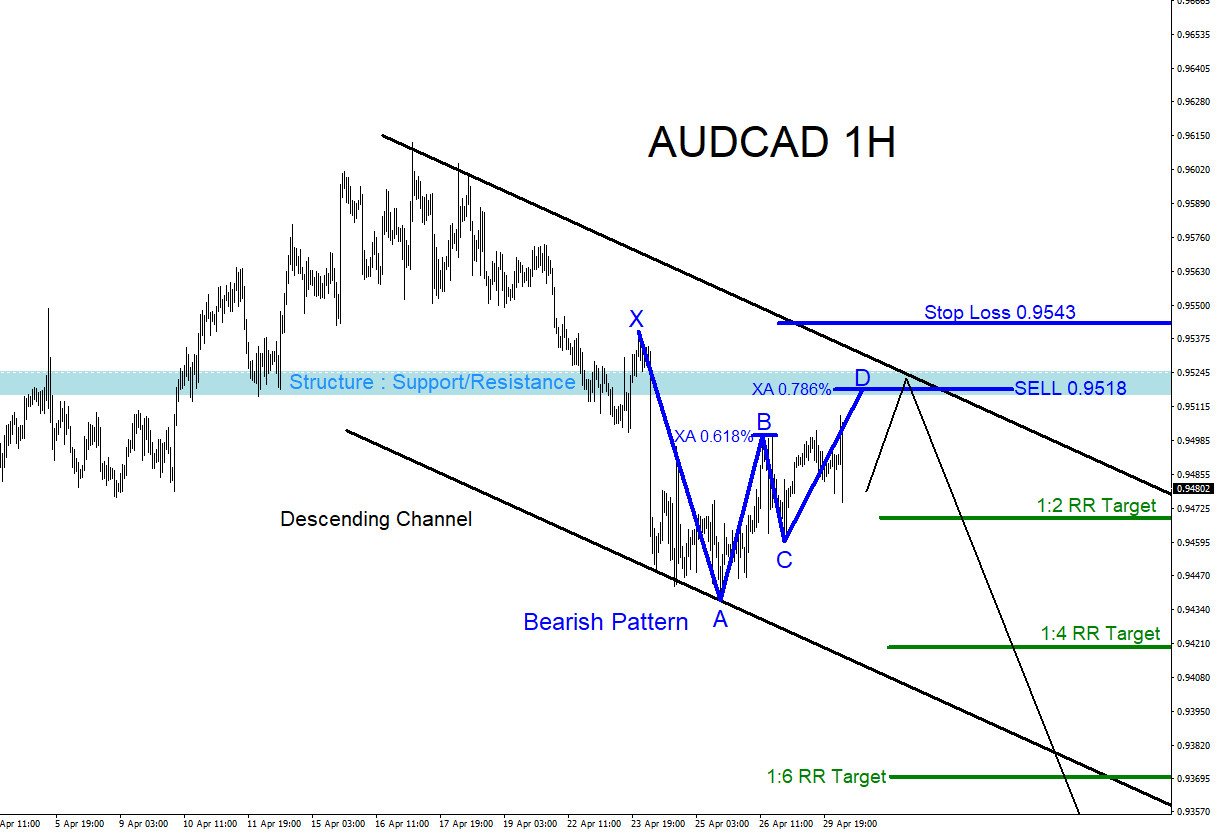
AUDCAD : SELL Trade Setup
Read MoreAUDCAD Technical Analysis April 30/2019 AUDCAD : A bearish market pattern is forming on the 1 hour chart but has yet to trigger entry. In the chart below the blue bearish pattern still needs to make a small push higher to tag the XA 0.786% Fib. retracement level where price can see a possible reversal […]
-
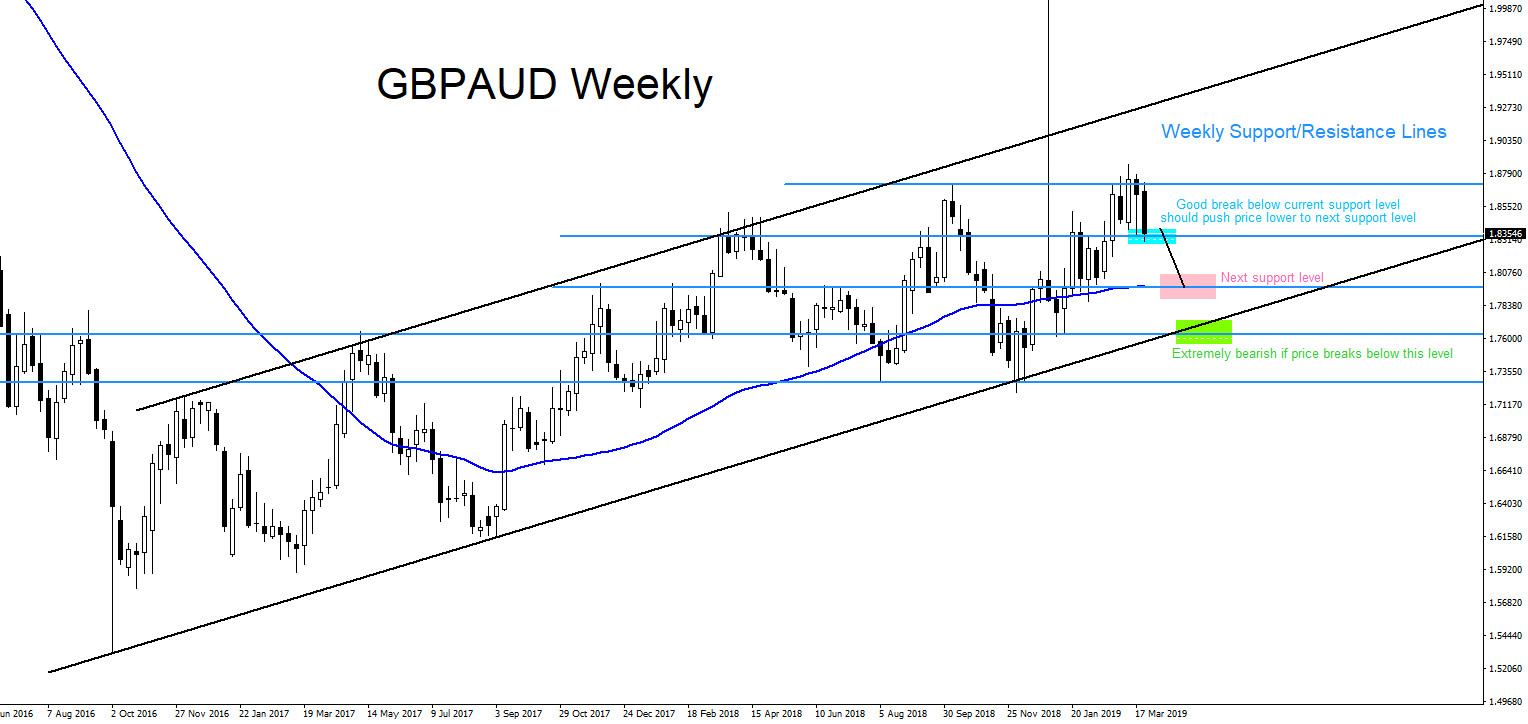
GBPAUD : Top Down Analysis
Read MoreGBPAUD Technical Analysis April 2019 Every trader should always view the market in the “bigger picture” first. Viewing the market starting from the higher time frame down to the lower time frames will offer a trader a better perspective on the possible price movements that the market can do. A “top down analysis” will offer […]
-
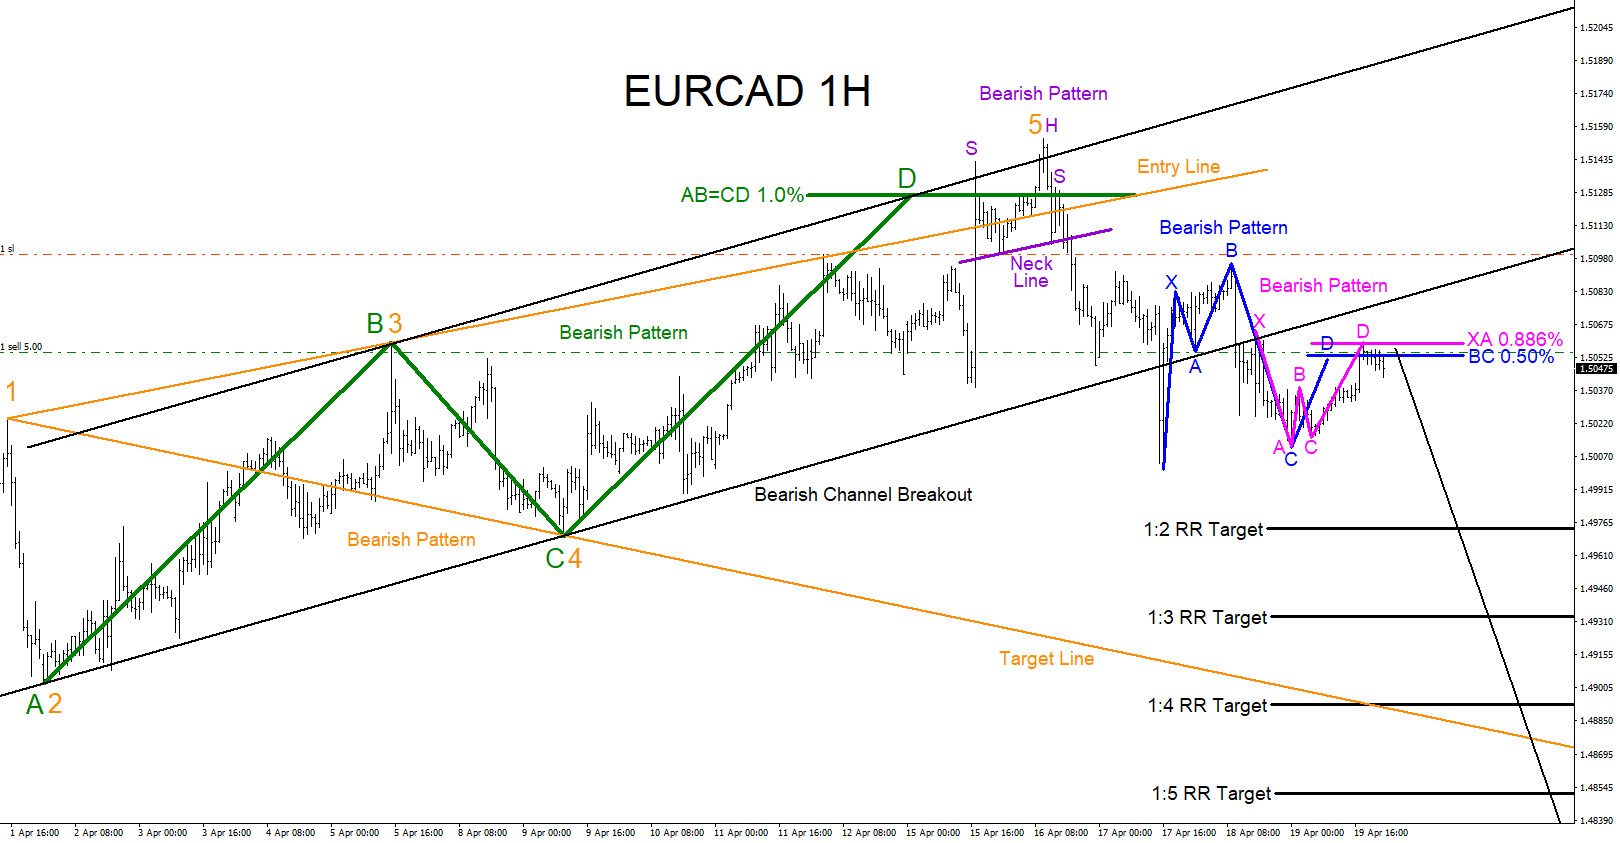
EURCAD : Bearish Patterns Calling Lower?
Read MoreEURCAD Technical Analysis April 21/2019 EURCAD : Bearish market patterns can be seen on the EURCAD pair. In the first chart below both the blue and pink bearish patterns already triggered SELLS on the 15 minute time frame. Blue bearish pattern triggered SELLS at the BC 0.50% Fib. retracement level and the pink bearish pattern […]