
-
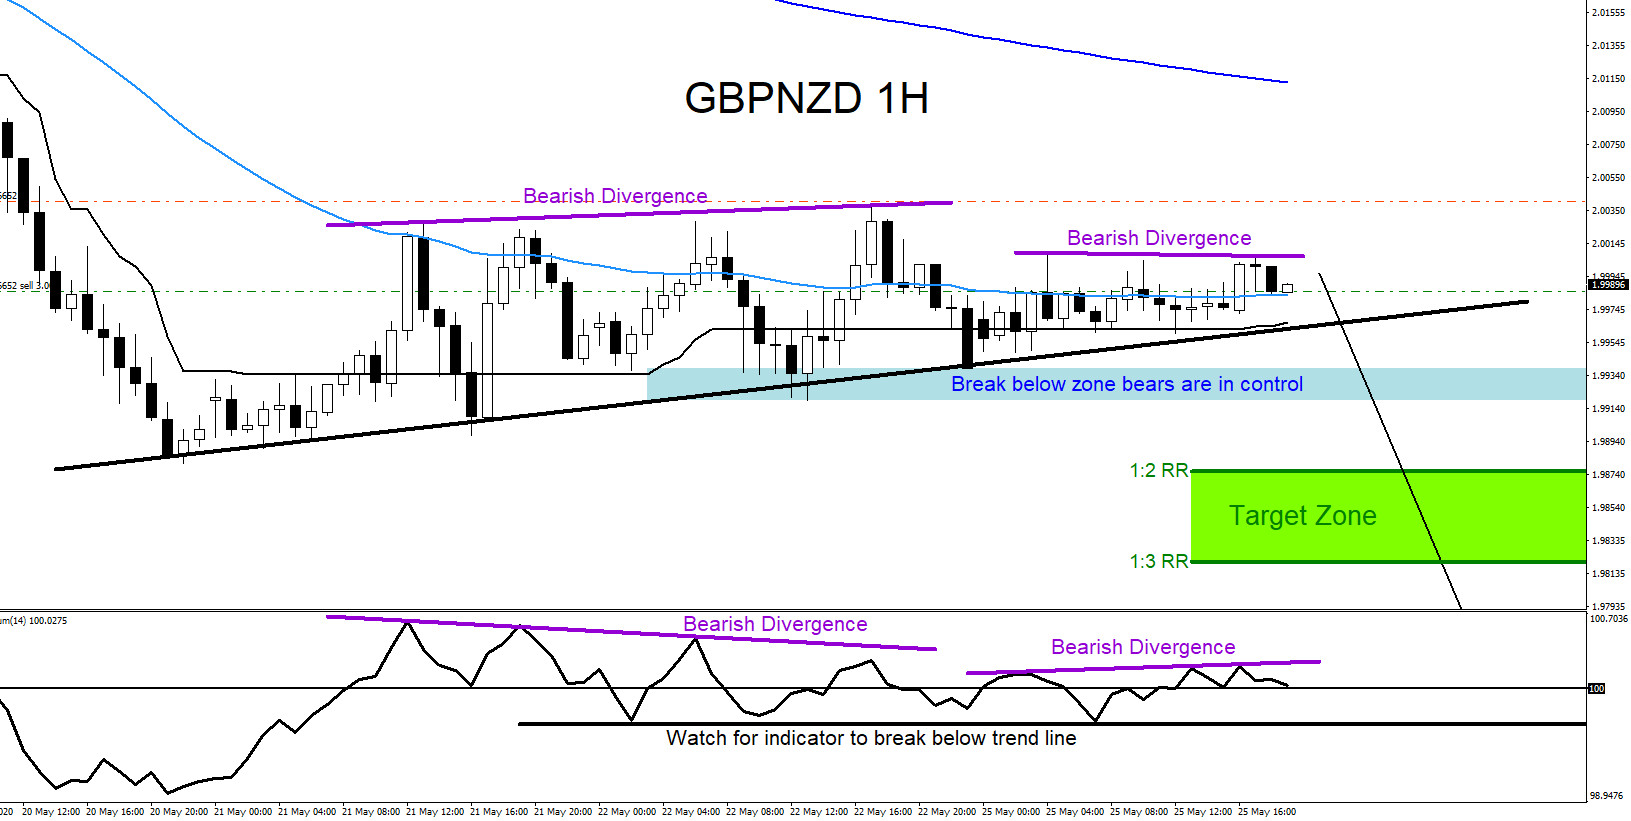
GBPNZD : Trading the Move Lower
Read MoreOn May 25 2020 I posted on social media Stocktwits/Twitter @AidanFX “GBPNZD will be watching for selling opportunities“. GBPNZD has been trending lower since April 2020 so the clear path will be to trade with the trend and not against it. The chart below was also posted on social media StockTwits/Twitter @AidanFX May 25 2020 showing that […]
-
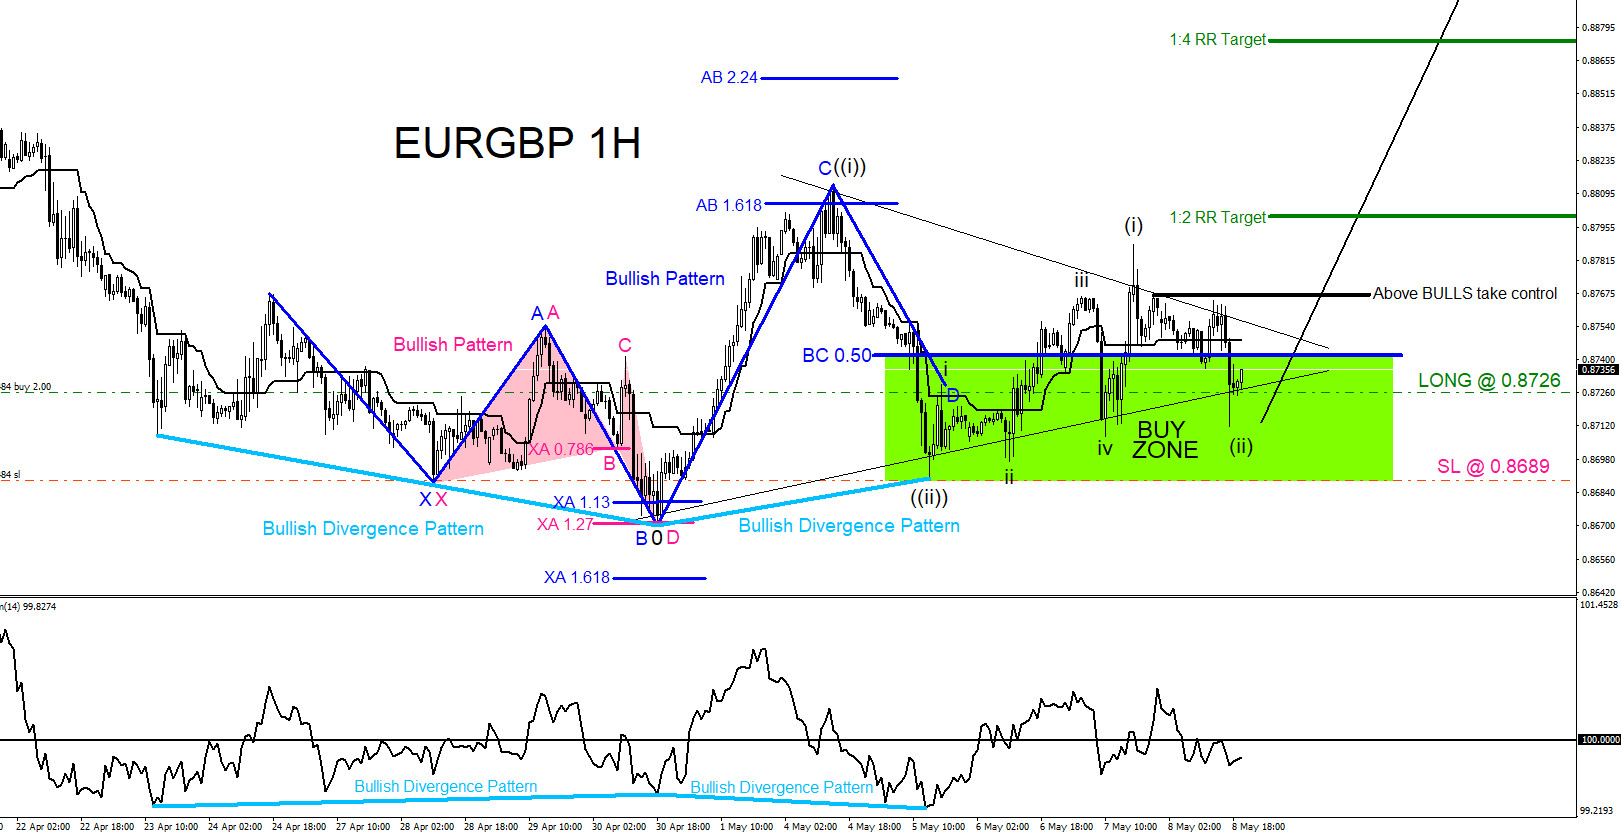
EURGBP : Market Patterns Calling the Move Higher
Read MoreEURGBP Technical Analysis On May 5/2020 I posted on social media (Stocktwits/Twitter) @AidanFX “$EURGBP will be watching for possible buying opportunities.“ EURGBP 1 Hour Chart May 8.2020 : The charts below was also posted on social media (StockTwits/Twitter) @AidanFX May 8/2020 showing that a bullish pattern (blue) has formed and price has entered the buy zone looking […]
-
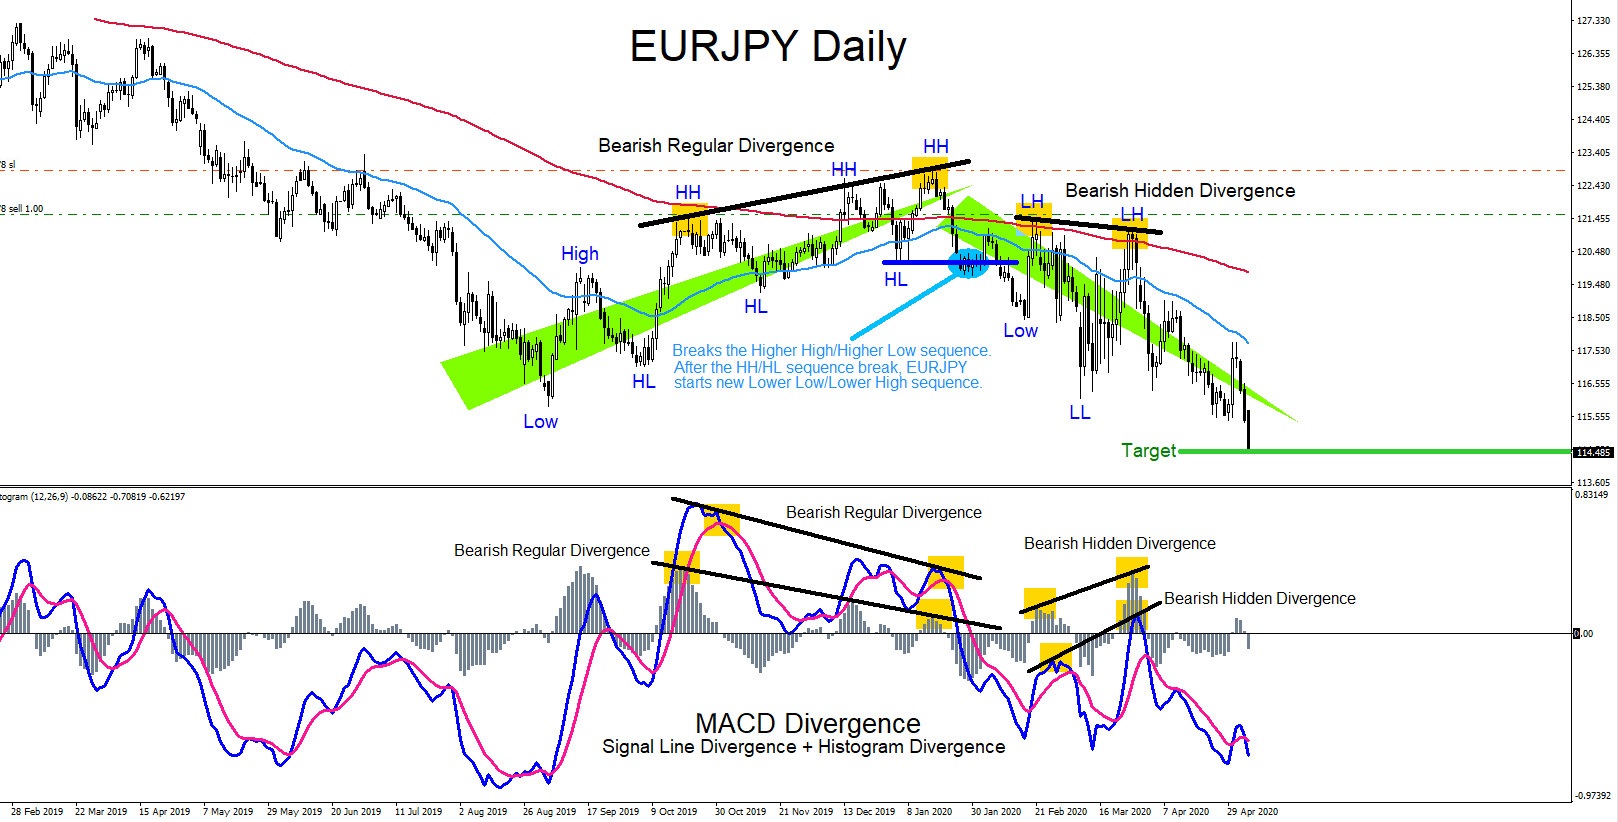
Divergence Trading Patterns
Read MoreDivergence trading patterns can signal traders of possible trade setups. There are 2 types of divergence patterns, regular divergence and hidden divergence. Both patterns can signal a trader on which side to trade the market. A divergence pattern is when price is moving in one direction but the oscillator indicator is moving in a different direction. […]
-
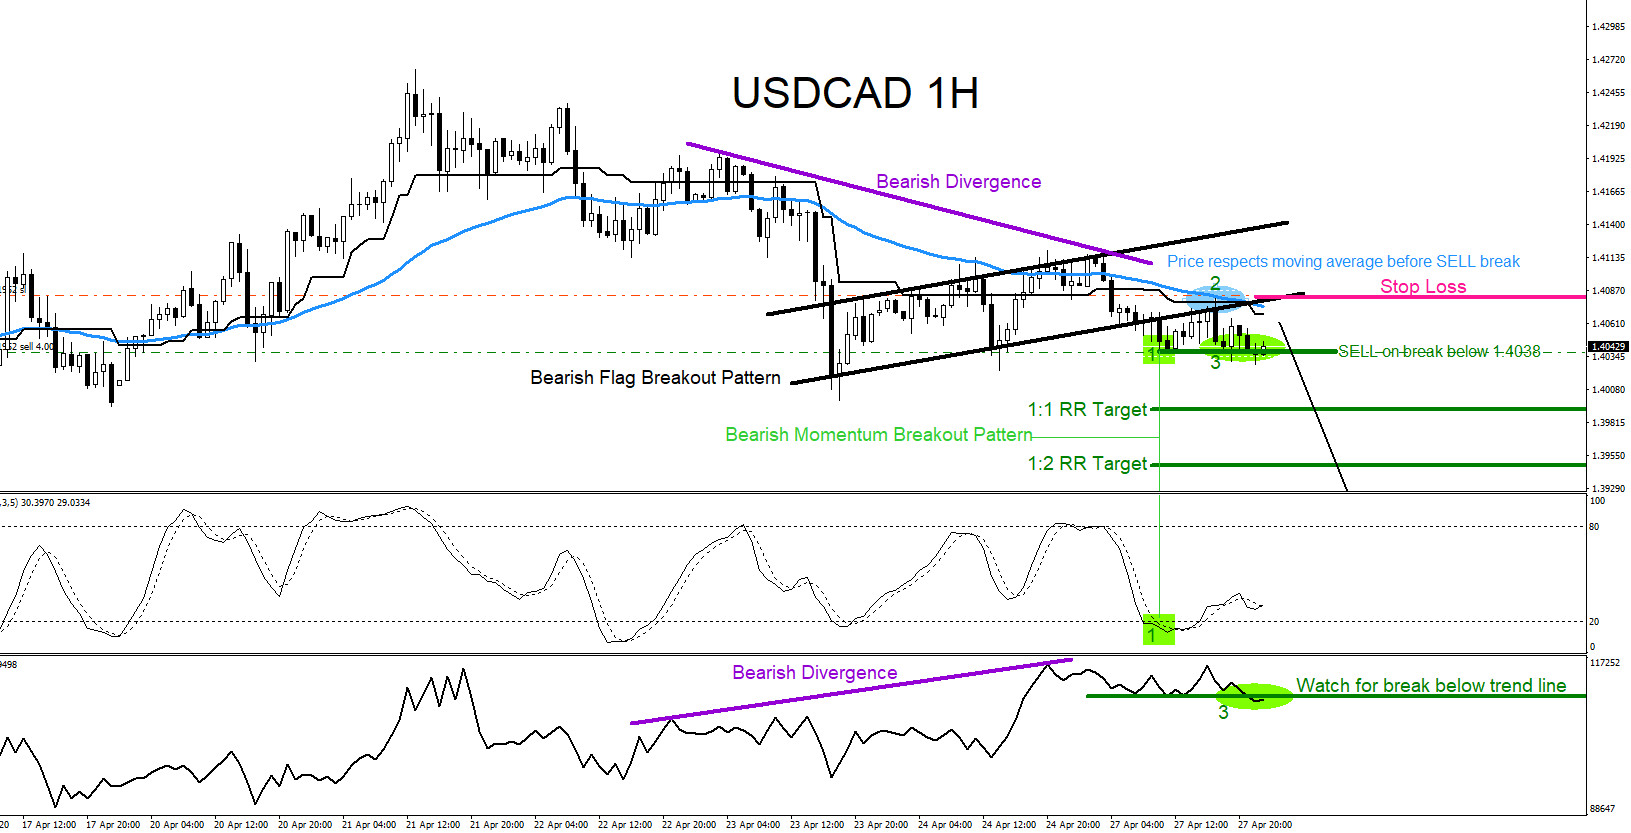
USDCAD : Trading the Breakout Lower
Read MoreUSDCAD Technical Analysis On April 27/2020 I posted on social media (Stocktwits/Twitter) @AidanFX “USDCAD Still possible the pair can extend lower below 1.4000. Possible momentum breakout lower at 1.4038“ USDCAD 1 Hour Chart April 27.2020 : The chart below was also posted on social media (StockTwits/Twitter) @AidanFX April 27/2020 showing that a bearish flag breakout pattern (black) […]
-
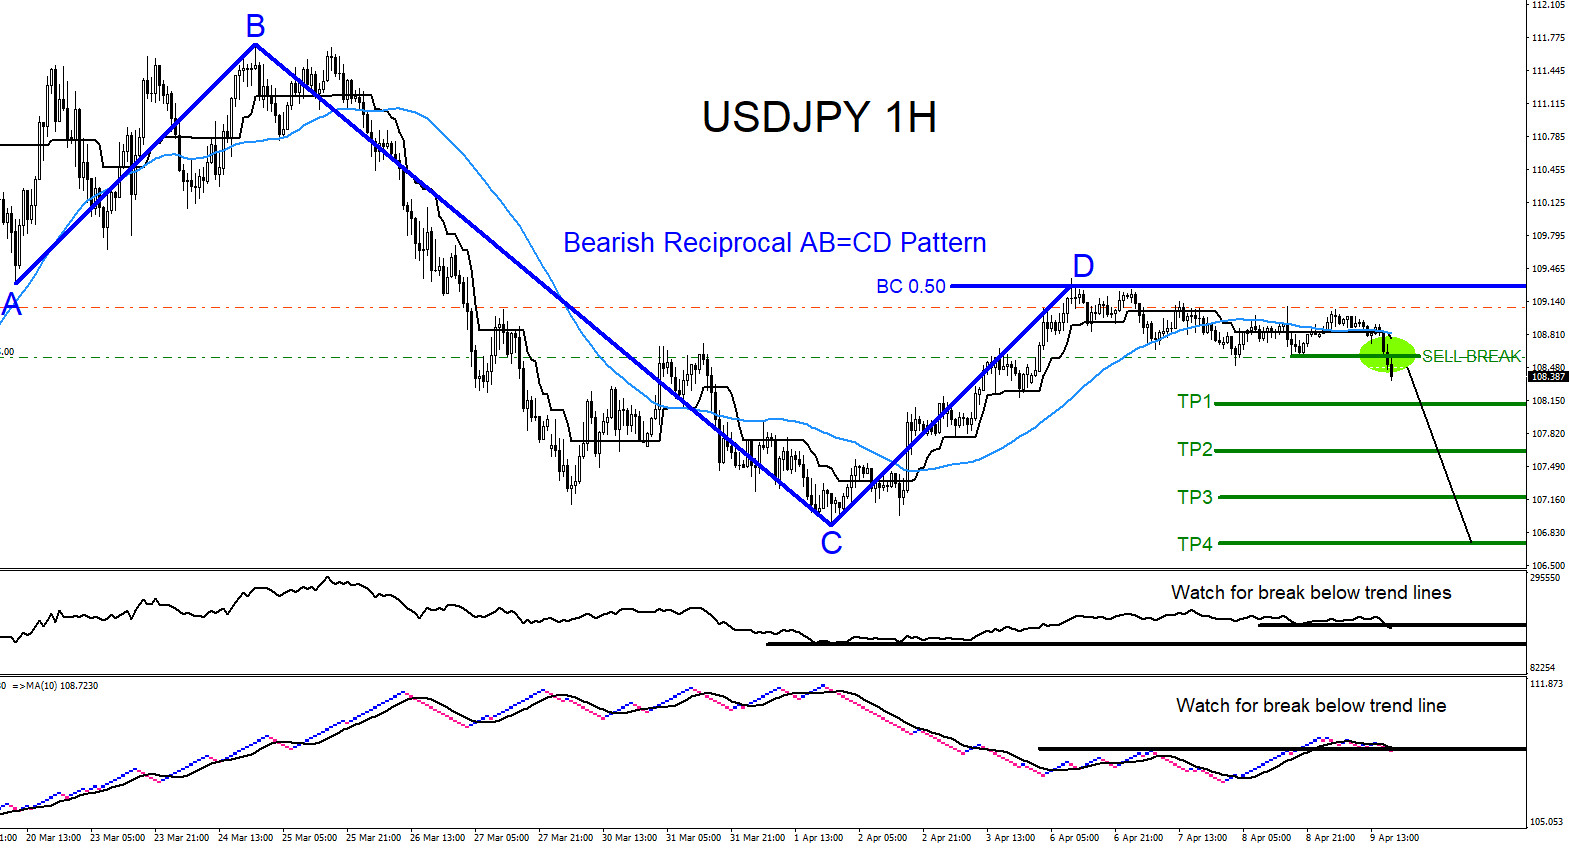
USDJPY : Calling the April 2020 Move Lower
Read MoreUSDJPY Technical Analysis On April 8/2020 I posted on social media (Stocktwits/Twitter) @AidanFX “USDJPY Break below 108.60 can push the pair lower towards 108 area“ USDJPY 1 Hour Chart April 9.2020 : The chart below was also posted on social media (StockTwits/Twitter) @AidanFX April 9/2020 showing that a bearish reciprocal AB=CD pattern (dark blue) has formed […]
-
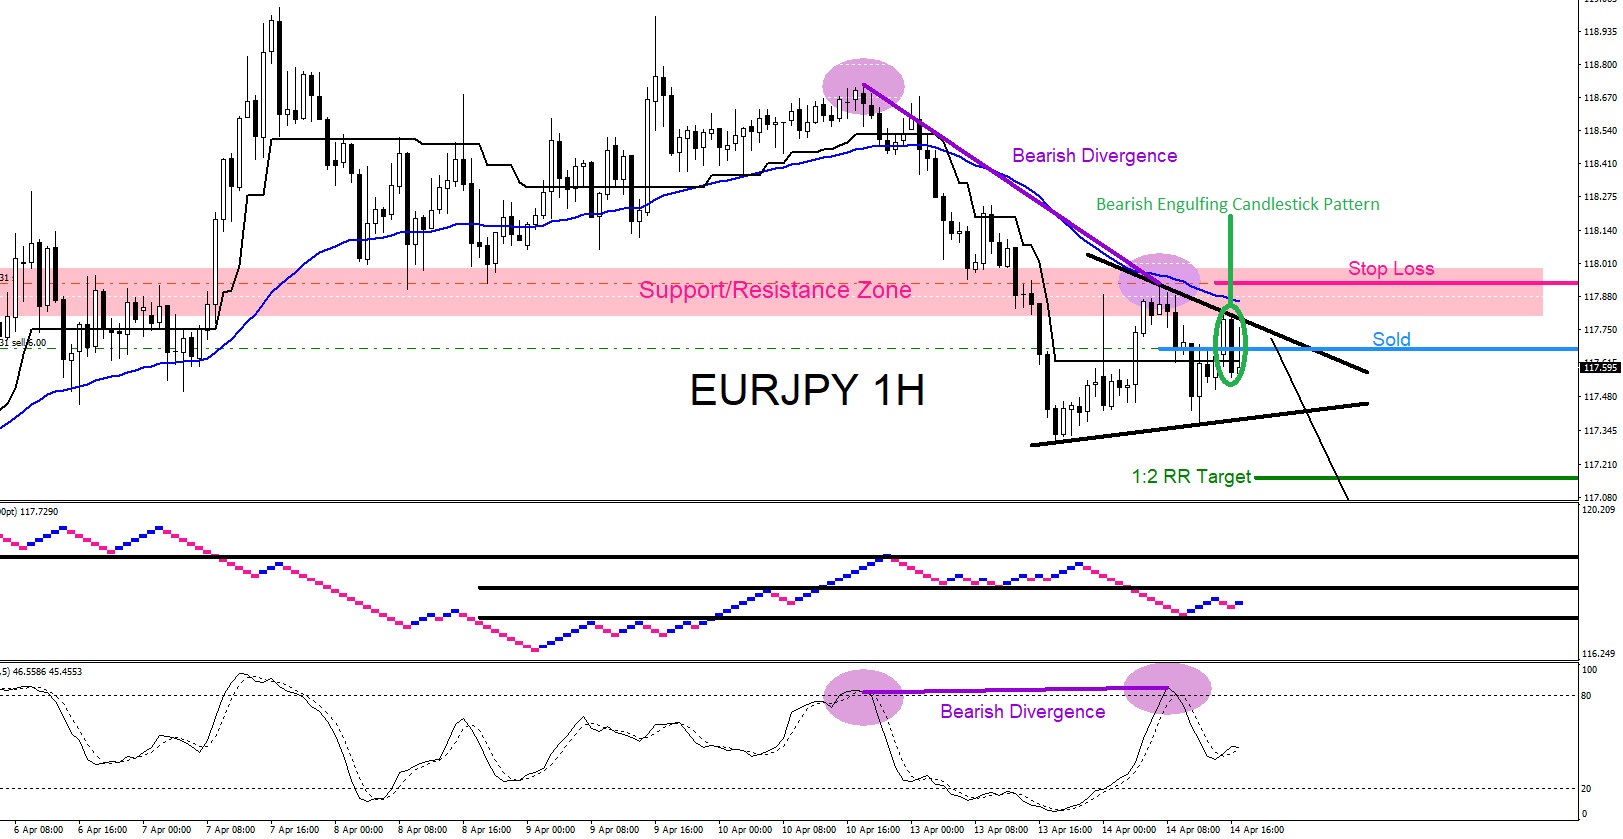
EURJPY : Market Patterns Calling the Move Lower
Read MoreEURJPY Technical Analysis On April 14/2020 I posted on social media (Stocktwits/Twitter) @AidanFX the SELL trade setup “Sell EURJPY @ 117.67 Stop Loss @ 117.93 Target @ 117.15“ EURJPY 1 Hour Chart April 14.2020 : The chart below was also posted on social media (StockTwits/Twitter) @AidanFX April 14/2020 showing that price hit a clear Support/Resistance Zone (pink) […]