-

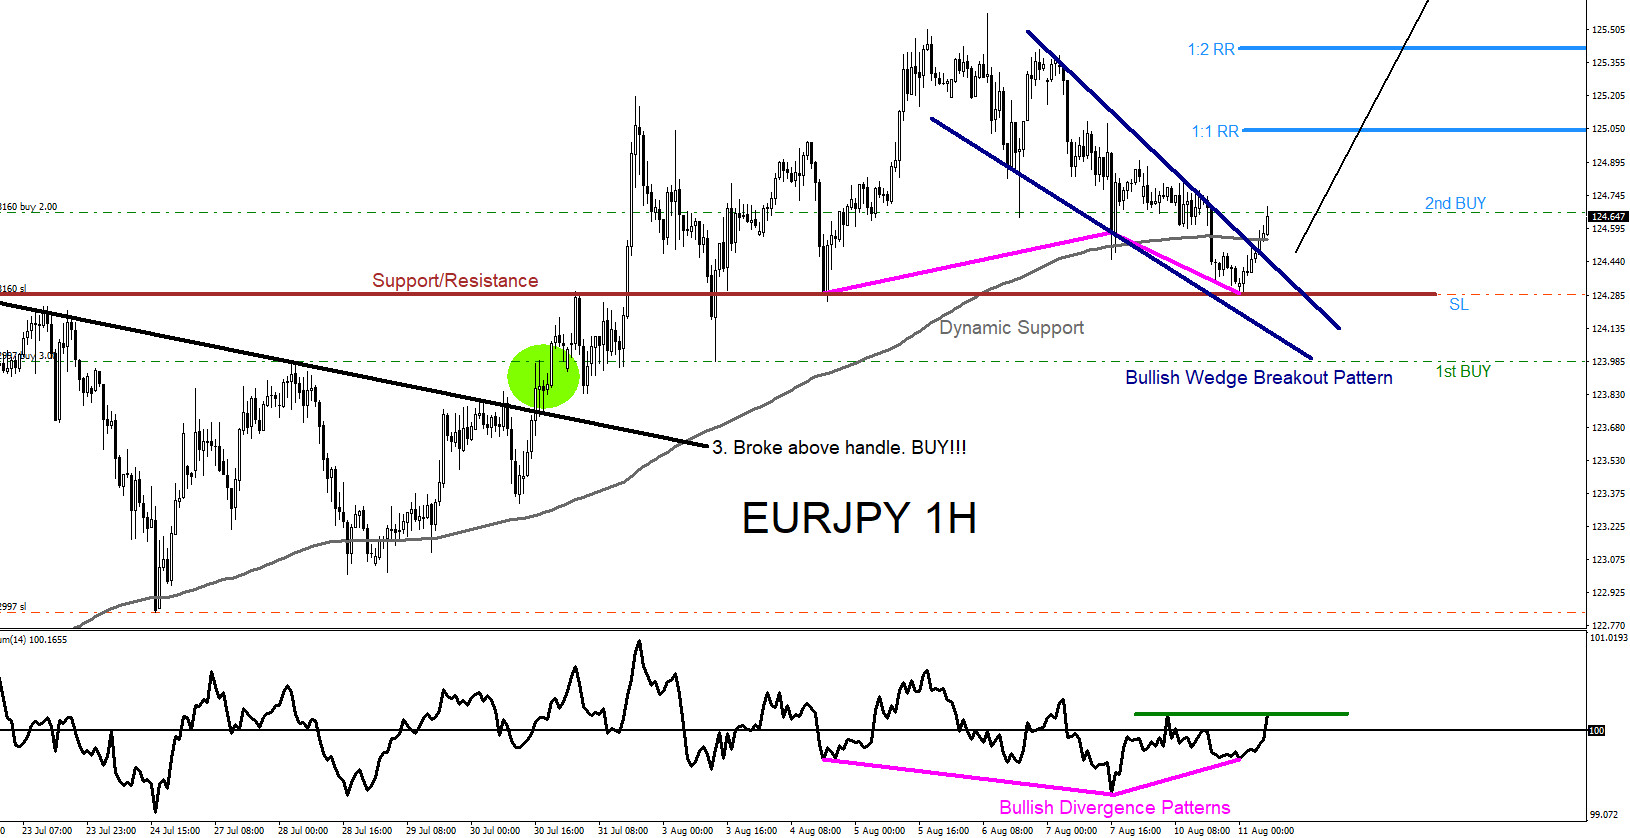
EURJPY : Visible Market Patterns Signalling the Move Higher
Read MoreOn July 29 2020 I posted on social media Stocktwits/Twitter @AidanFX “EURJPY if we break above 123.98 then i will looking to BUY “ The chart below was also posted on social media StockTwits/Twitter @AidanFX July 29 2020 showing that a bullish Cup & Handle pattern was clearly visible on the 4 hour chart calling […]
-

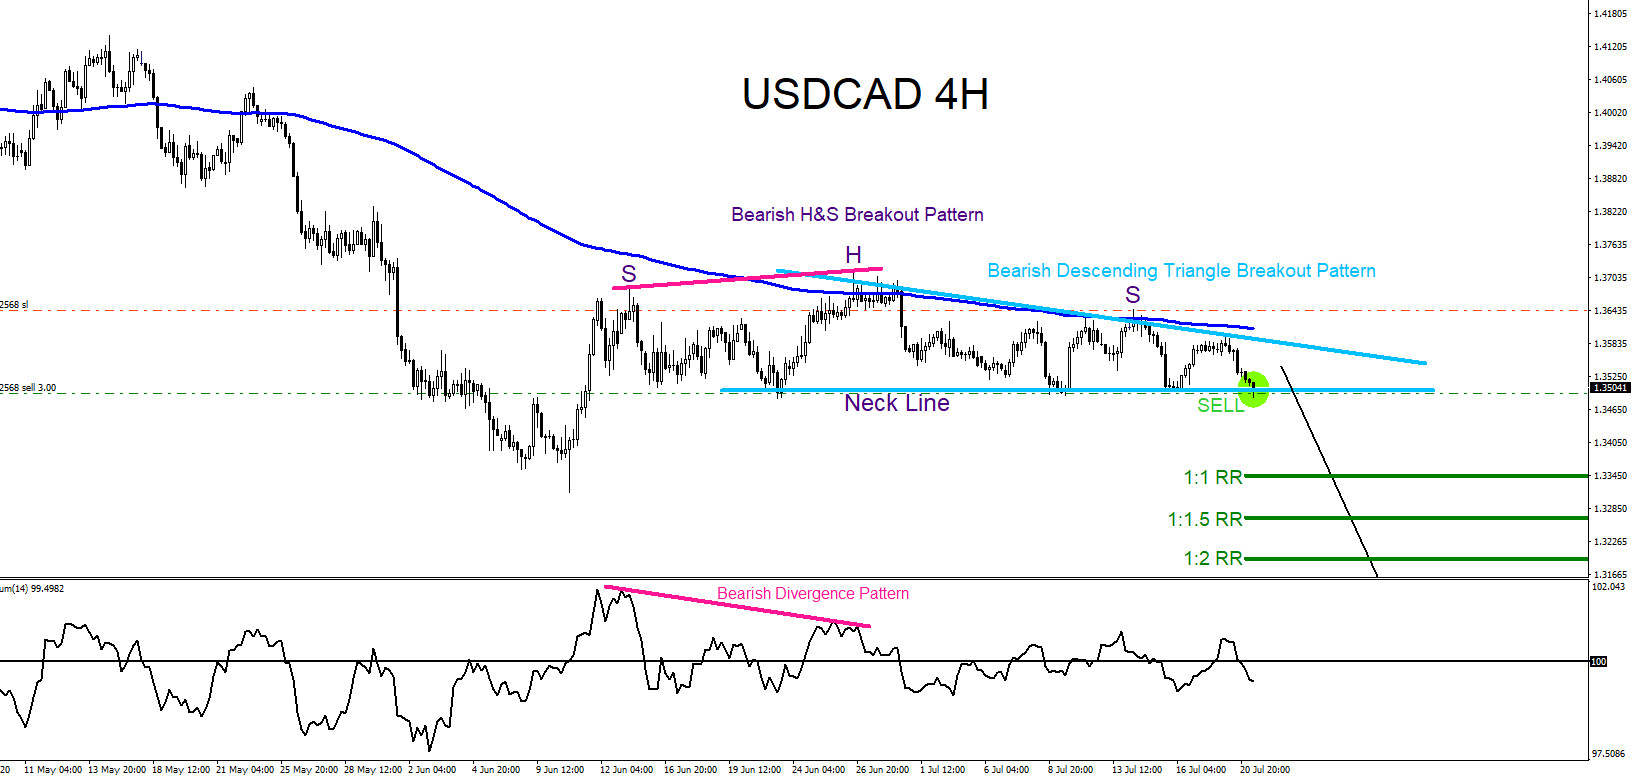
USDCAD : Market Patterns Signalling the Move Lower
Read MoreThe chart below of the USDCAD pair was posted on social media StockTwits/Twitter @AidanFX July 21 2020 showing that a bearish market pattern (light blue descending triangle) formed and triggered SELLS when price broke below the triangle. A bearish Head and Shoulders (purple) pattern also signalled sellers to enter on the breakout below the neckline […]
-

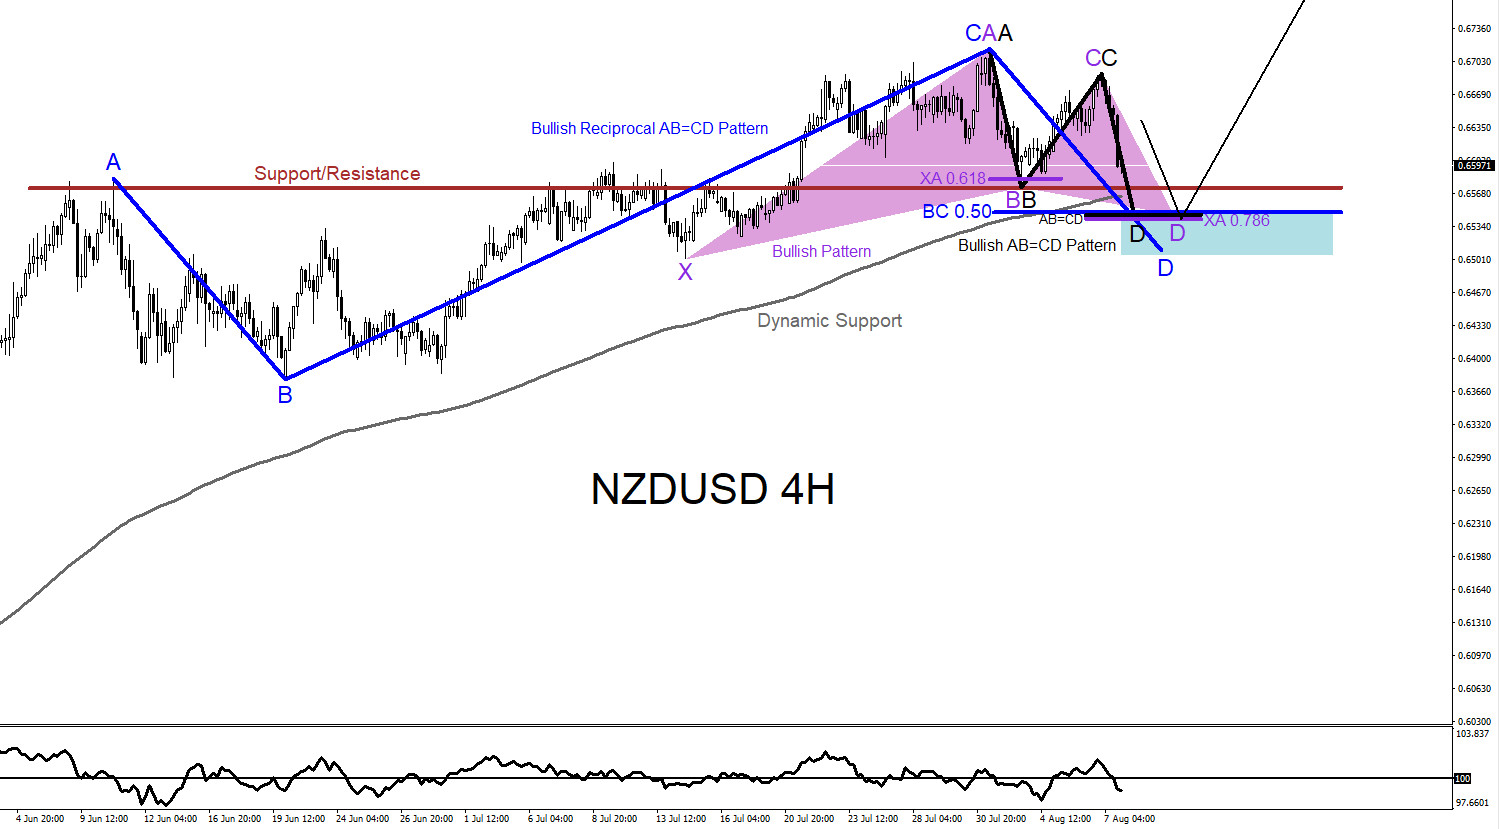
NZDUSD : A Dip Lower Will Find Bulls
Read MoreNZDUSD Technical Analysis August 8/2020 NZDUSD remains bullish as long as the June 22/2020 0.6378 low remains untouched. In this analysis of the NZDUSD pair, market patterns will be used to determine where price can possibly reverse and bounce higher from. In the chart below, there are several possible bullish patterns that can trigger BUYS […]
-

GBPCAD : Bullish Market Patterns Calling the Move Higher
Read MoreOn July 23 2020 I posted on social media Stocktwits/Twitter @AidanFX “GBPCAD Watch for BUYS against 1.6975 stops“ The charts below was also posted on social media StockTwits/Twitter @AidanFX July 23 2020 showing that bullish market patterns were clearly visible on the 1 hour chart calling for a move higher. Bullish pattern (orange) triggered buyers […]
-

GBPJPY : Market Patterns Signalling the Move Higher
Read MoreOn July 15 2020 I posted on social media Stocktwits/Twitter @AidanFX “GBPJPY LONG/BUY at 134.47 Stop Loss at 133.97 Target 1 at 134.97 Target 2 at 134.47 Target 3 at 134.97“ The chart below was also posted on social media StockTwits/Twitter @AidanFX July 15 2020 showing that a bullish market pattern (light blue) formed signalling buyers […]
-

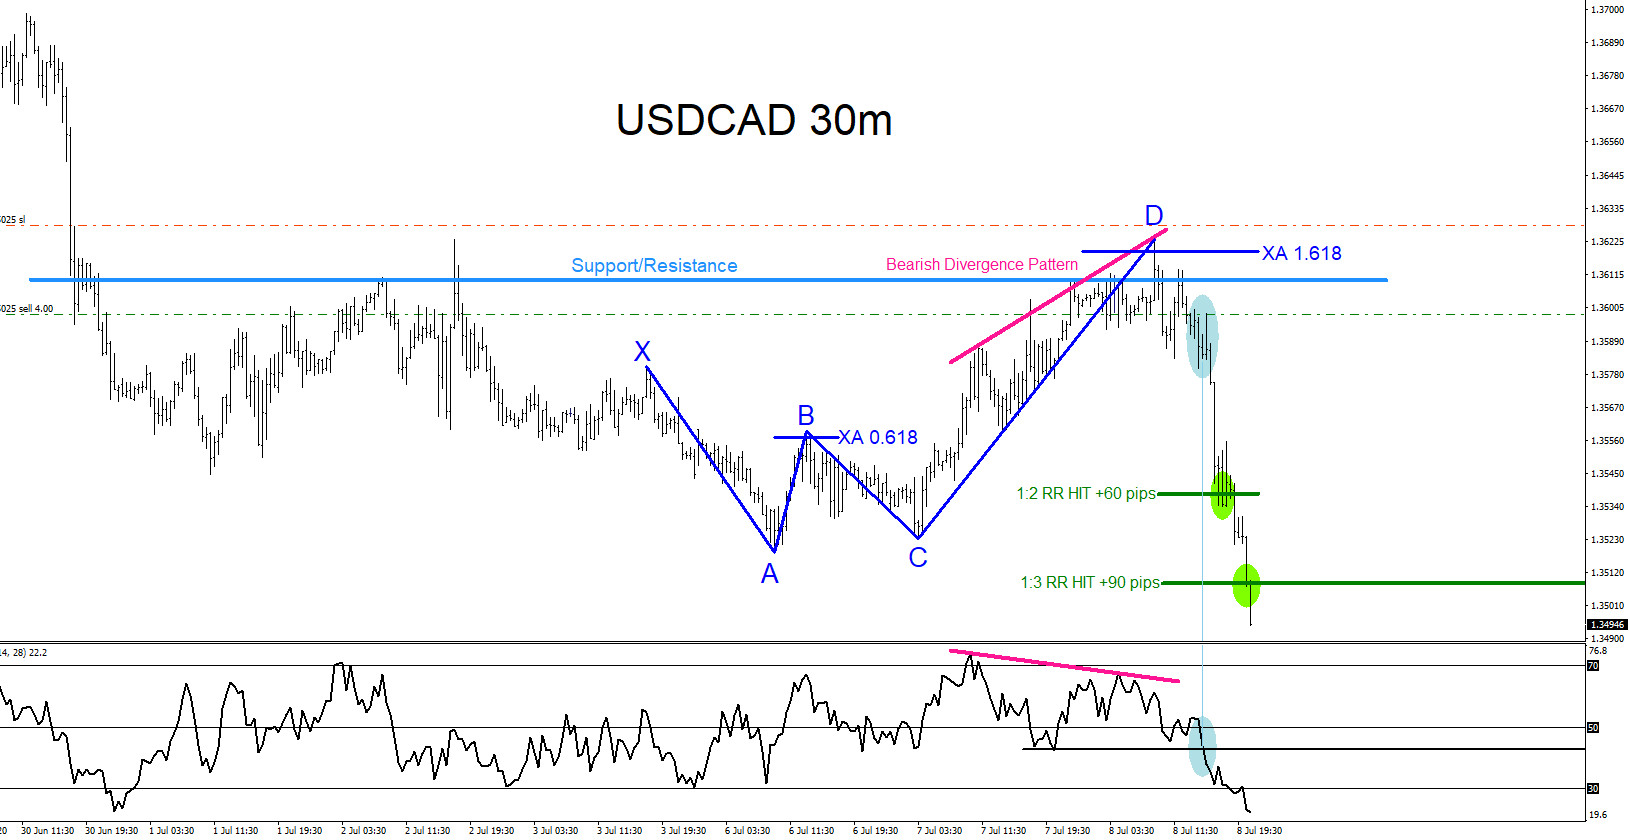
USDCAD : Market Patterns Signalling the Move Lower
Read MoreOn July 7 2020 I posted on social media Stocktwits/Twitter @AidanFX “USDCAD I will continue looking for SELLS as long price stays below 1.3624. It’s entering the area where can possibly turn lower.“ The chart below was posted on social media StockTwits/Twitter @AidanFX July 8 2020 showing that a bearish market pattern (blue) formed signalling sellers […]