
-
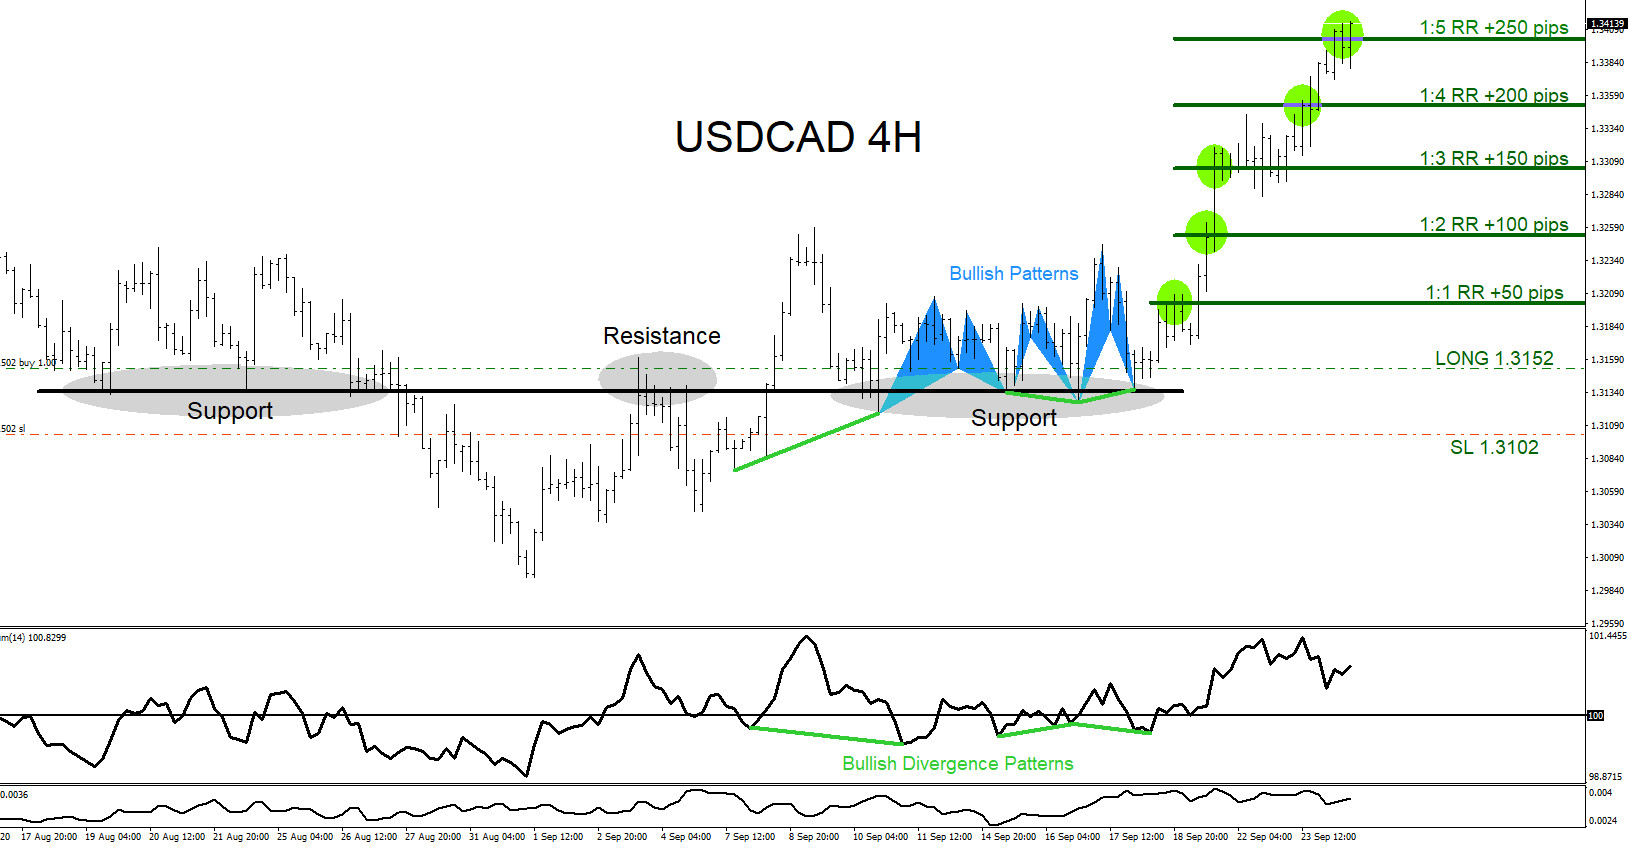
USDCAD : Market Patterns Calling the Move HIgher
Read MoreOn September 17 2020 I posted on social media Stocktwits/Twitter @AidanFX “USDCAD Will be looking for BUYS as long price stays above 1.3126.” The chart below was also posted September 17 2020 showing that bullish market patterns were visible calling for a move higher. Bullish Pattern (grey) triggered BUYS with a combination of a bullish divergence pattern […]
-
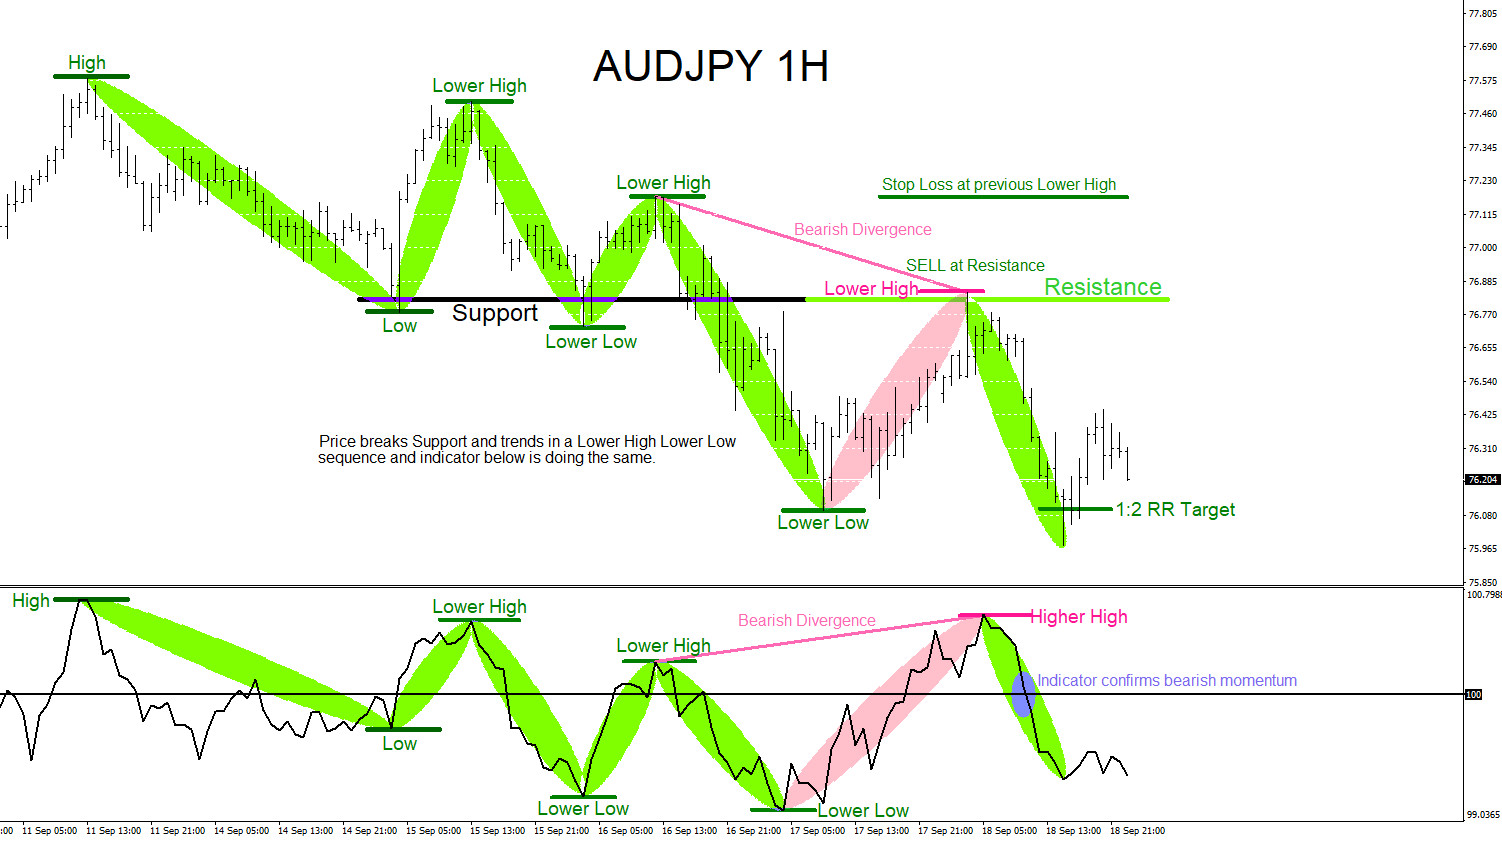
AUDJPY : Support Becomes Resistance
Read MoreOn September 10/2020 AUDJPY registered a temporary top and started to trend lower. When a market is trending it will make higher highs and higher lows in a bullish trend and lower lows lower highs in a bearish trend. Support and Resistance levels/zones are the basics of technical market analysis and traders use these levels/zones […]
-
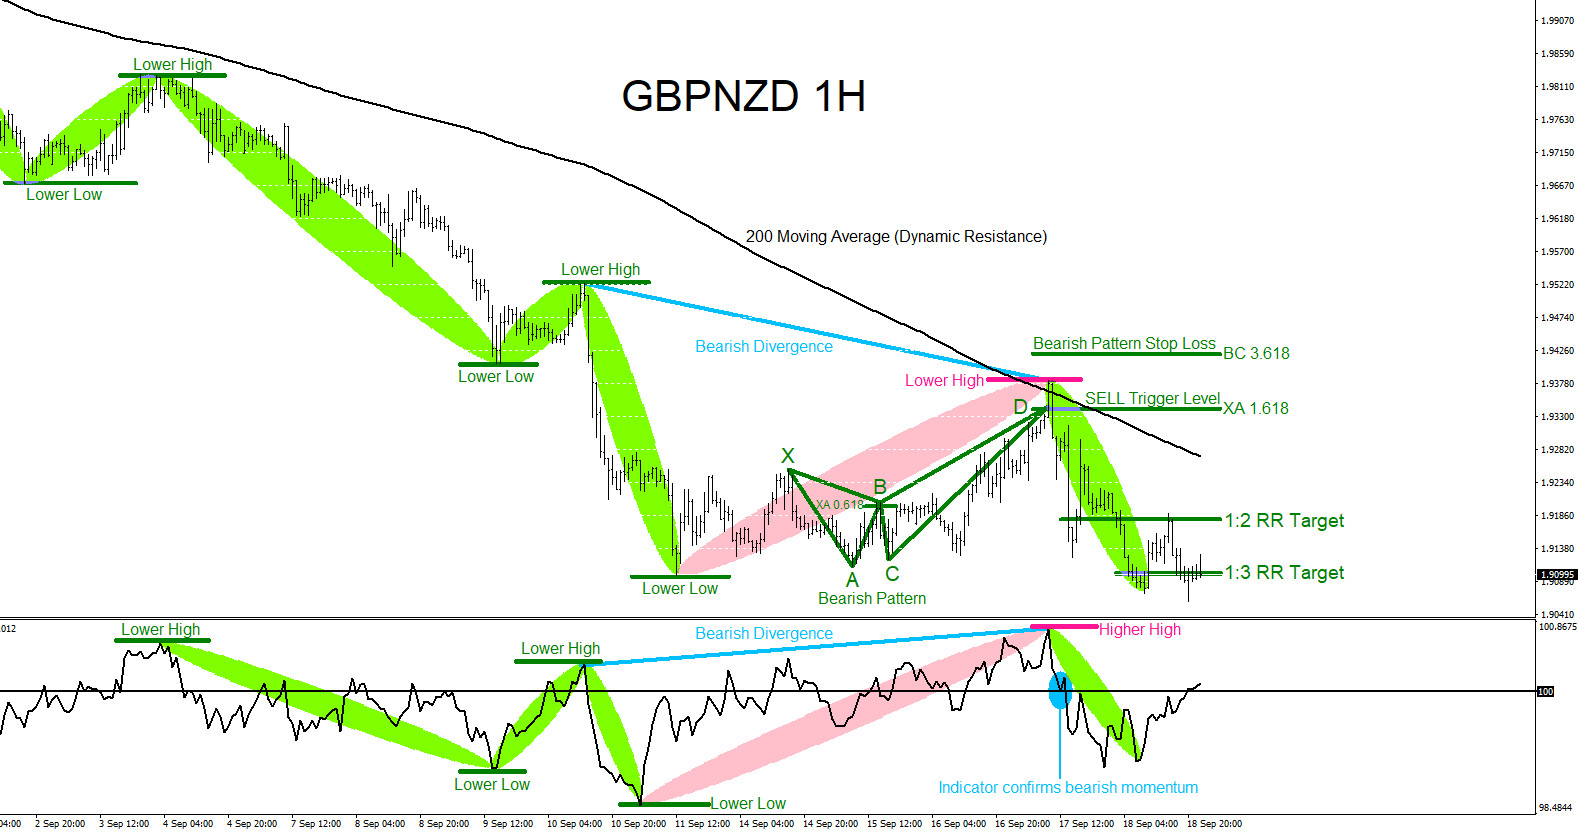
GBPNZD : Trading with the Trend
Read MoreTowards the end of August 2020 the GBPNZD pair reversed and has been trending lower since. At EWF we always encourage traders to trade with the trend and not against it. Looking at the 1 Hour chart, GBPNZD was clearly trending lower and was in a correction mode at the start of last week which […]
-
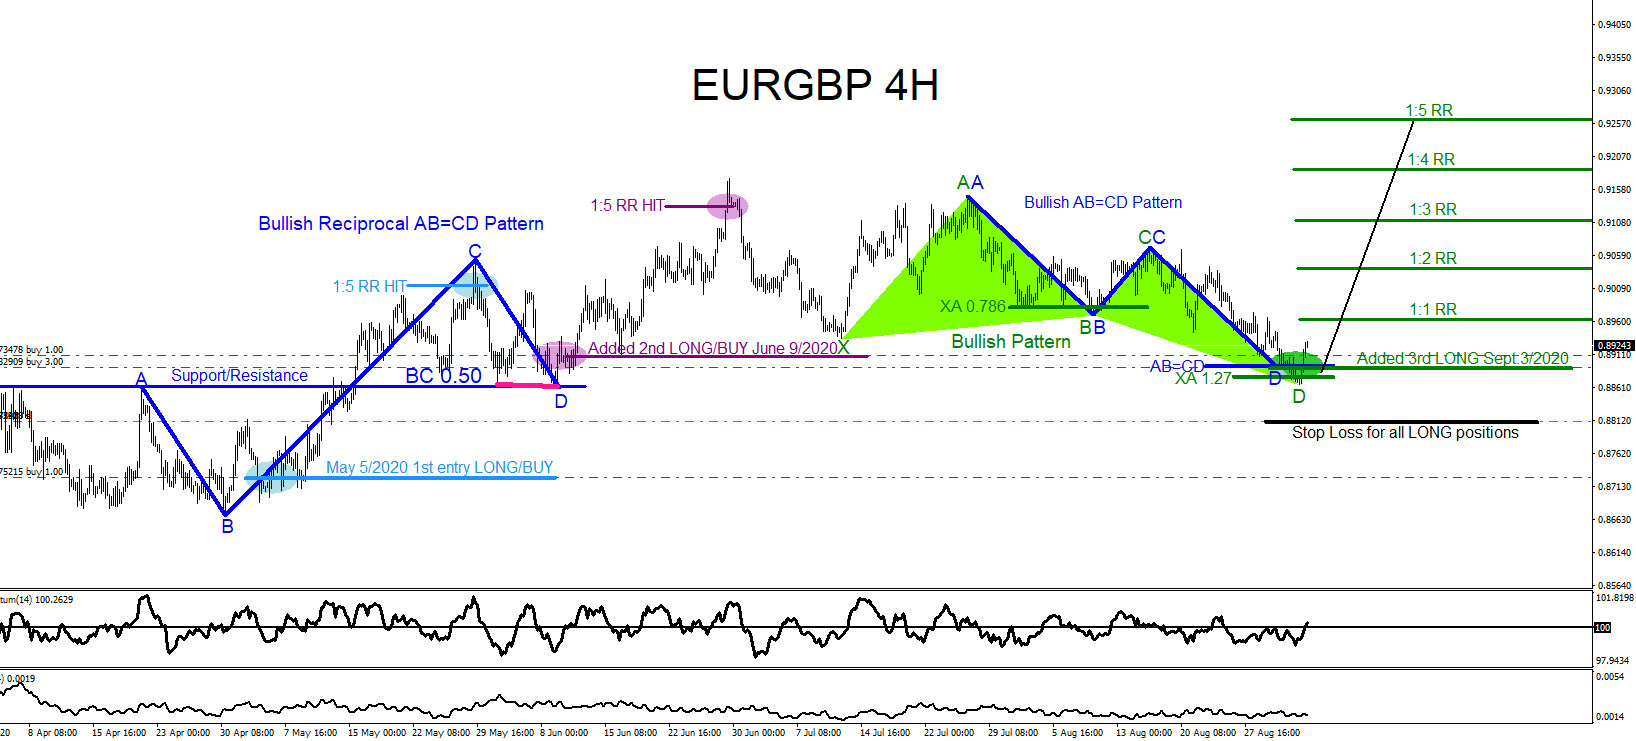
EURGBP : Using Market Patterns to Trade the Move Higher
Read MoreOn September 3 2020 I posted on social media Stocktwits/Twitter @AidanFX “LONGSIDE EURGBP“. The chart below was also posted September 3 2020 showing that bullish market patterns were visible on the 4 hour chart calling for a move higher. Bullish Pattern (green) triggered BUYS at the XA 1.27 Fib. retracement level and the bullish AB=CD pattern […]
-
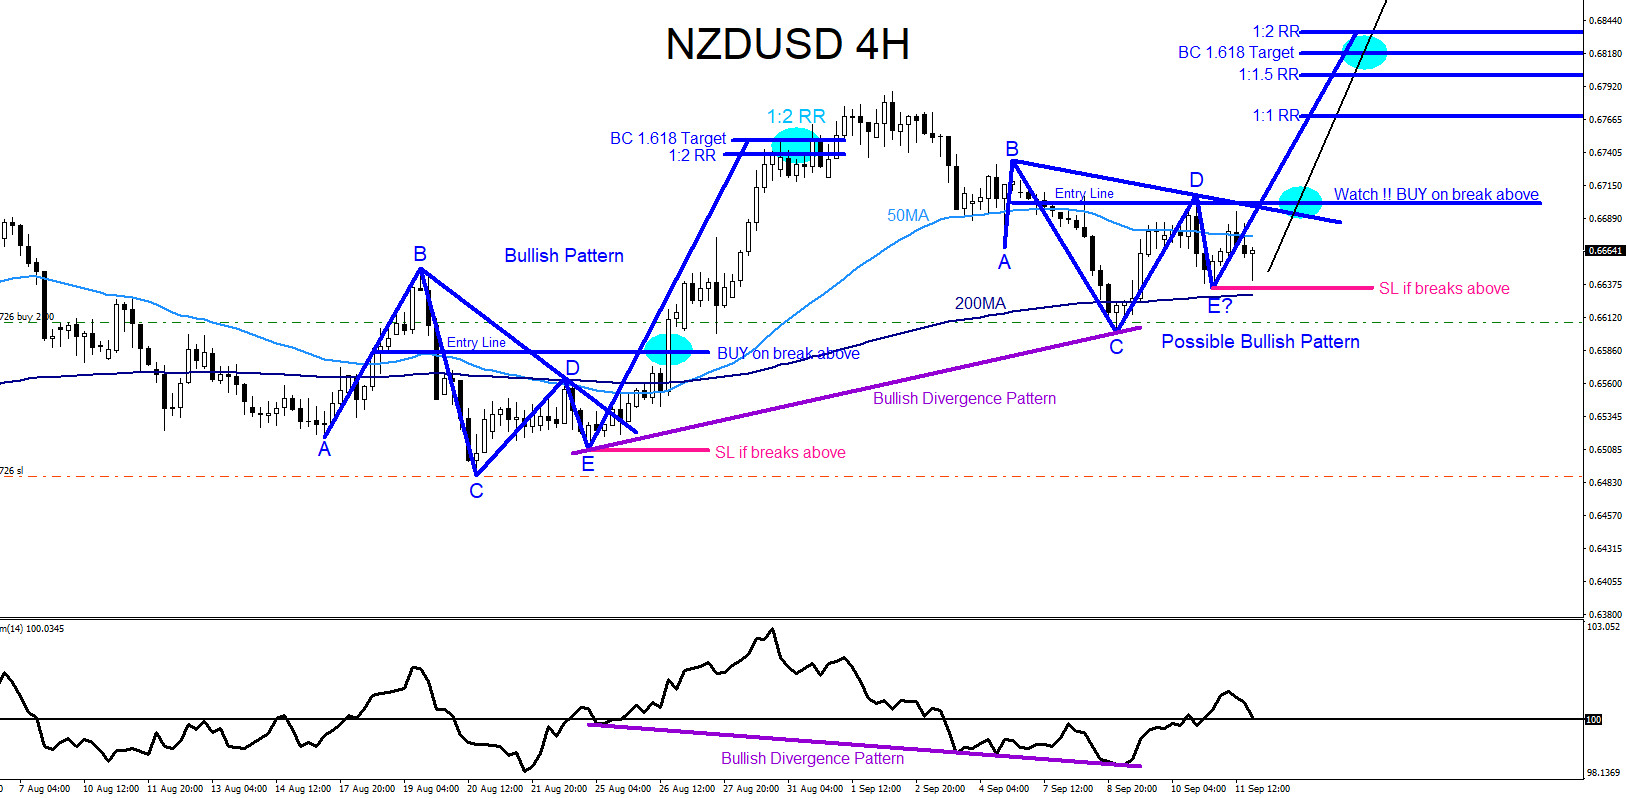
NZDUSD : Possible Move Higher?
Read MoreNZDUSD Technical Analysis September 9/2020 NZDUSD remains bullish as long as the August 20/2020 0.6488 low remains untouched. In this analysis of the NZDUSD pair, market patterns will be used to determine possible trade entries. In the chart below, there is a possible bullish pattern that can trigger BUYS for another push higher. Possible blue […]
-
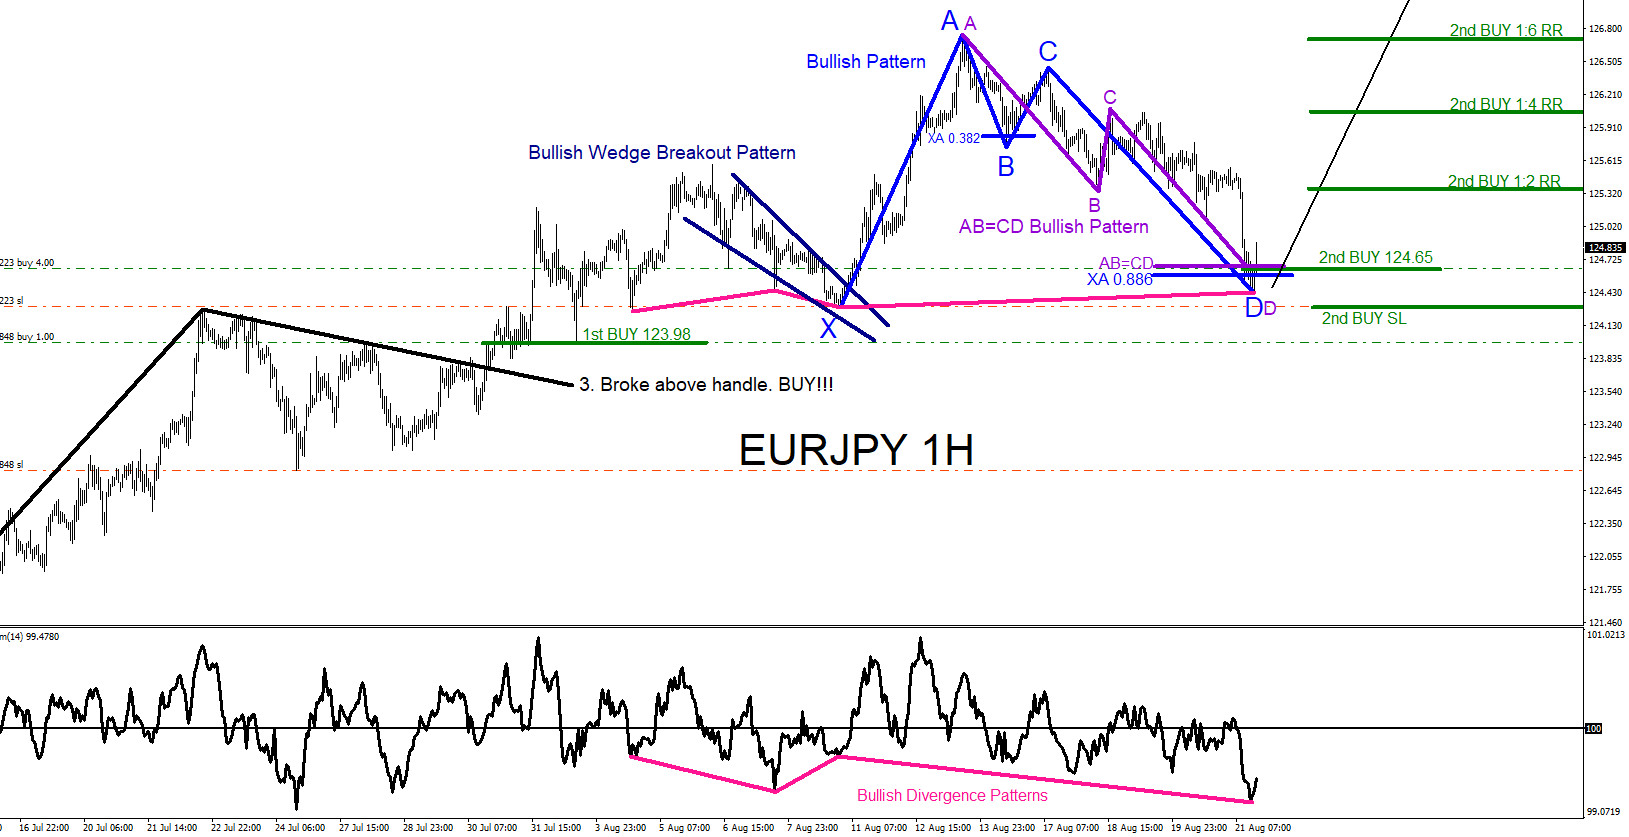
EURJPY : Market Patterns Continue to Call the Move Higher
Read MoreOn August 21 2020 I posted on social media Stocktwits/Twitter @AidanFX “Added LONG/BUY EURJPY” The chart below was also posted on social media StockTwits/Twitter @AidanFX August 21 2020 showing that bullish market patterns were visible on the 1 hour chart calling for a move higher. Bullish Pattern (blue) triggered BUYS at the XA 0.886 Fib. […]