Hello Traders! In this technical blog, we will follow up on the past performance of iShares 20+ Year Bond ETF ($TLT) forecast. We will also review the latest 4H count and explain why the ETF should remain supported.
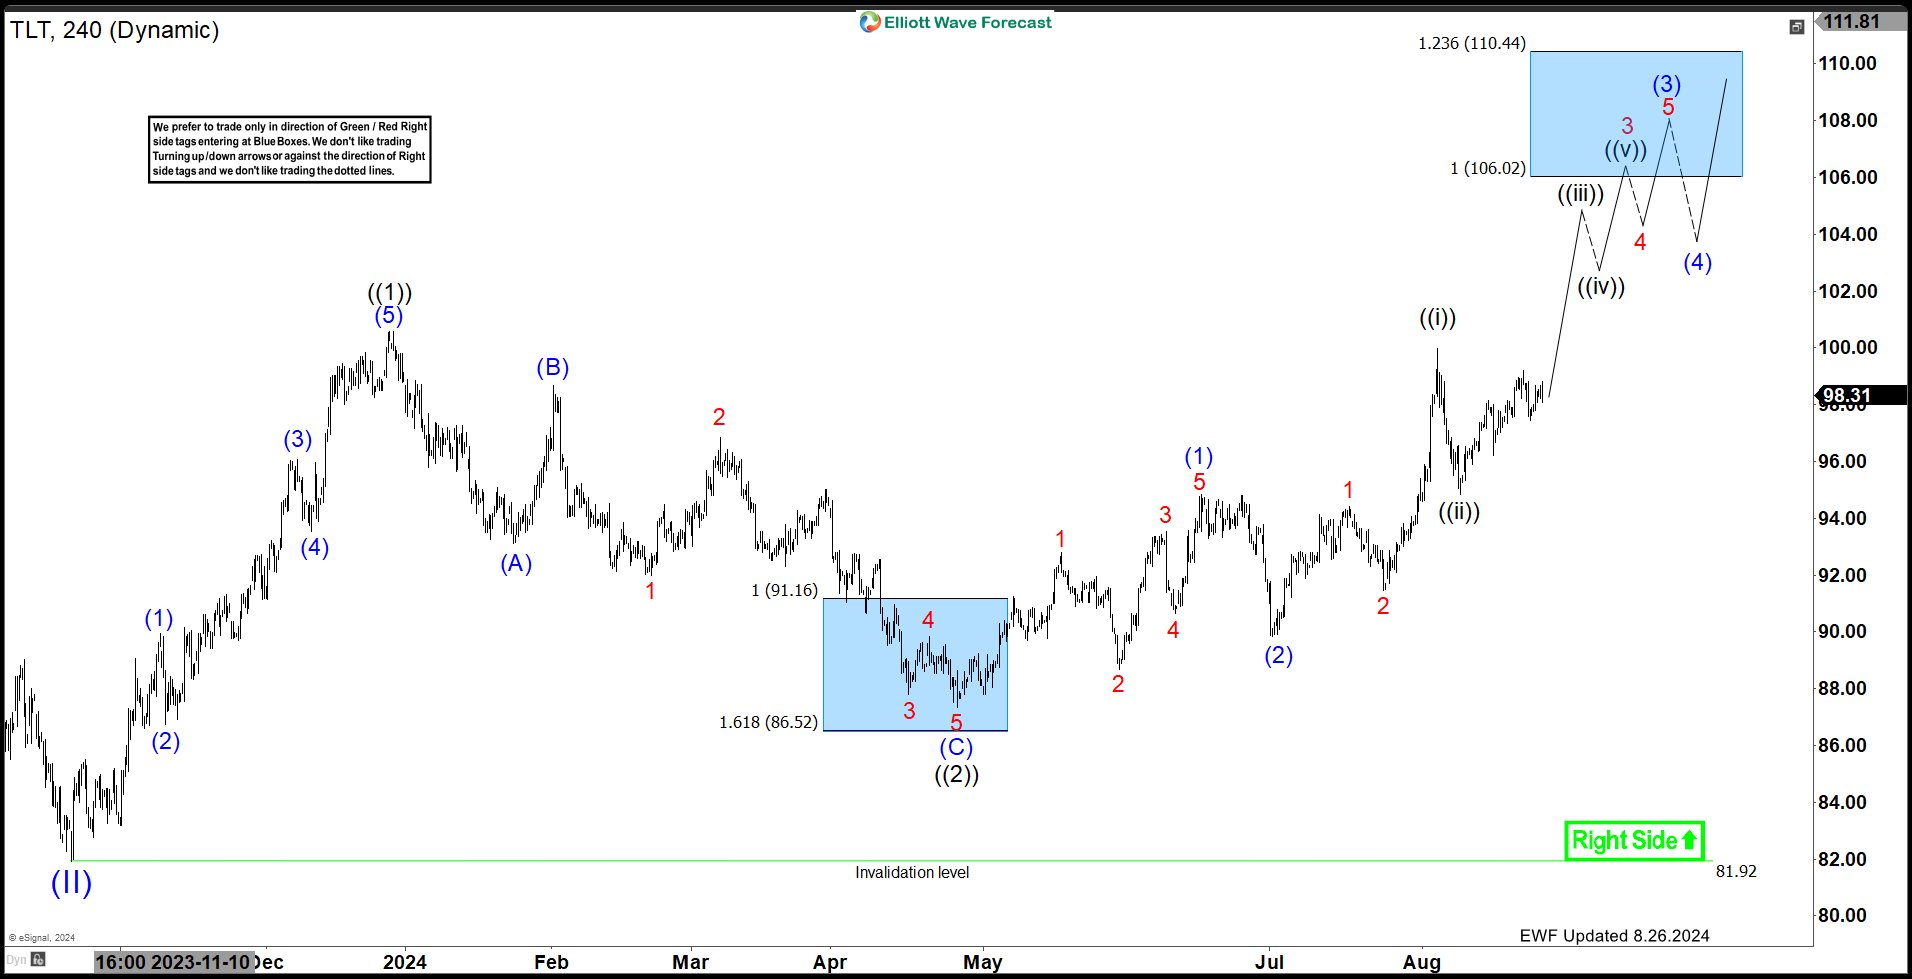
$TLT 4H Elliott Wave View – August 26, 2024:
In our last article, we explained that $TLT was showing a bullish sequence from Oct 2023 low due to the 5 waves impulse. We also suggested that a a break above black ((1)) at $100.57 will confirm that the next leg higher has started.
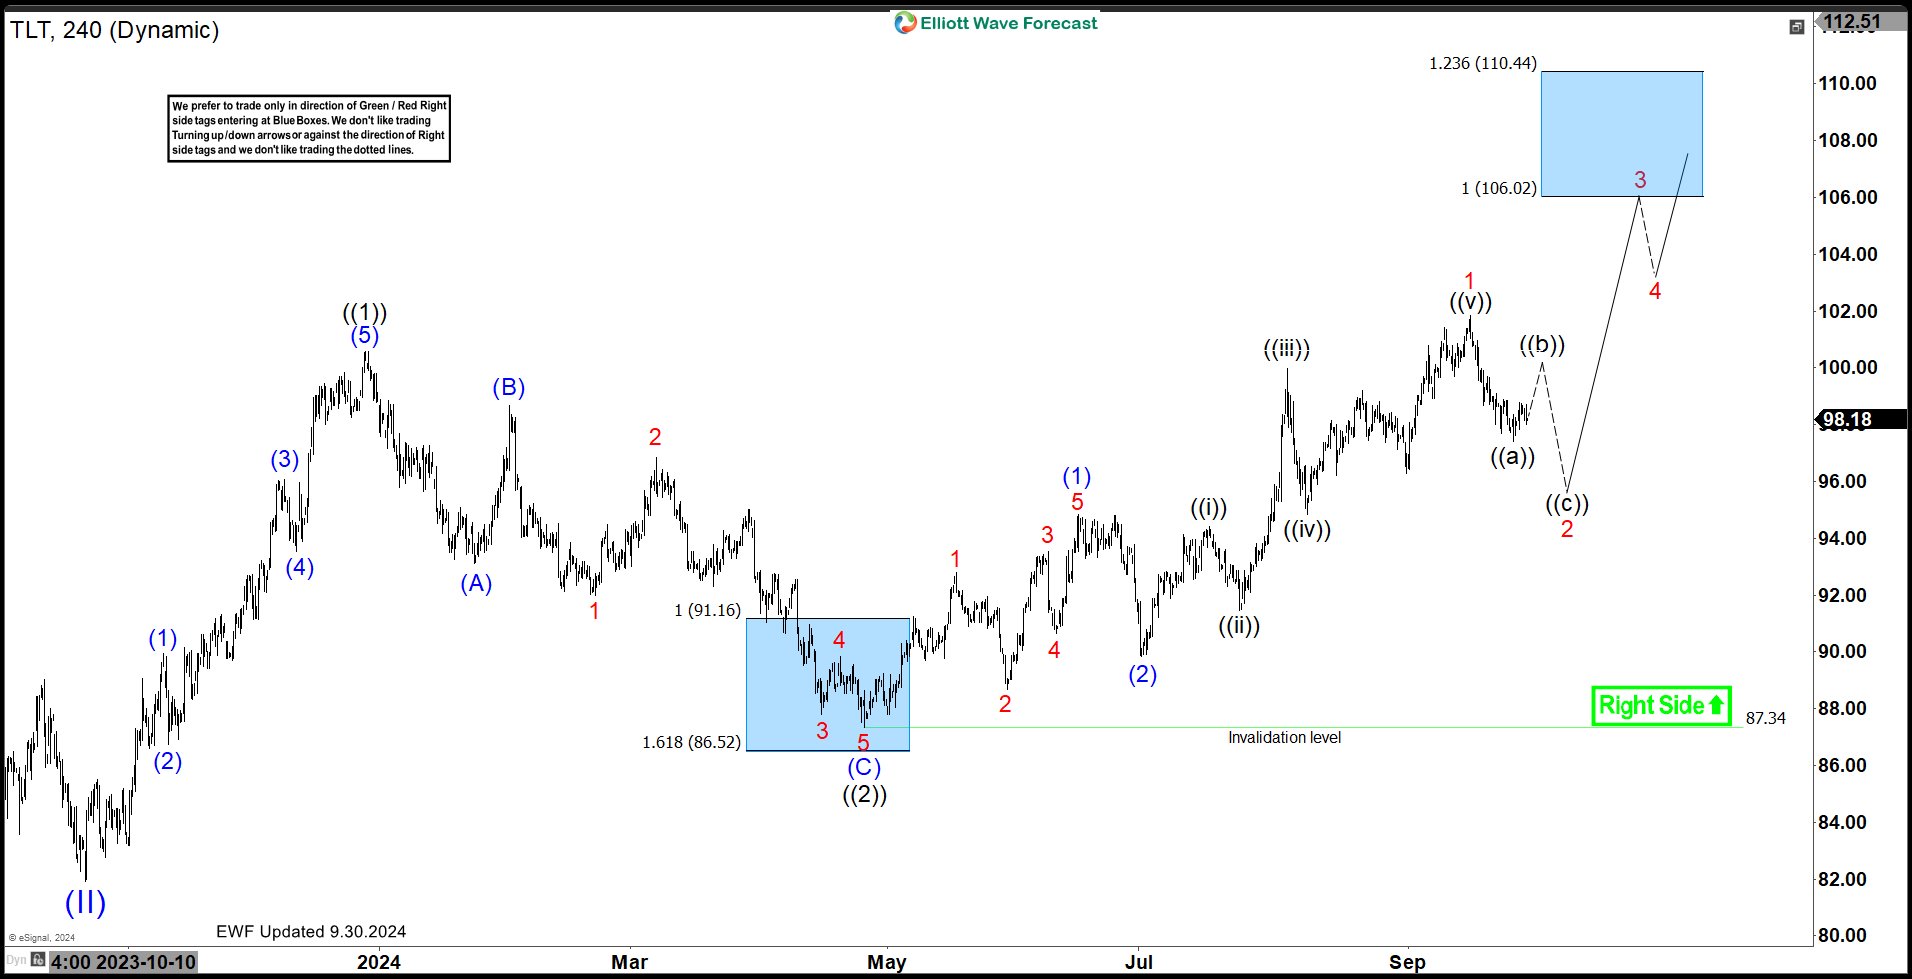
$TLT 4H Elliott Wave View – September 30, 2024:
The latest 4H update is showing a break above black ((1)) at $100.57. As a result, the structure has opened a bullish sequence towards $106 – 110 area. The cycle from July 2024 at blue (2) ended and a pullback to correct it is unfolding in 3 or 7 swings. We like to wait for a connector and another leg lower to buy the dip in 3 swings against the July low.
$TLT Elliott Wave Video Analysis
Elliott Wave Forecast
At Elliott Wave Forecast, we cover 78 instruments, providing comprehensive analysis and updates. Please note that not every chart is a trading recommendation. Official Trading Recommendations are available in our Live Trading Room. If you’re not a member yet, Sign Up for 14 days Trial to access new trading opportunities and enhance your trading strategy.
Welcome to Elliott Wave Forecast!
Back


