Hello traders. Welcome to a new ‘blue box’ blog post where we discuss our most recent trade setups shared with Elliottwave-Forecast members. In this one, we will discuss the Qs – QQQ (Investico QQQ ETF).
The Invesco QQQ ETF tracks the Nasdaq-100 Index, focusing on 100 large non-financial companies, mainly in technology, healthcare, and consumer sectors. It’s a popular choice for investors seeking exposure to large-cap tech companies.
The post-COVID recovery for U.S. markets began in October 2022, and since then, the market has sustained a bullish cycle, producing a series of higher highs and higher lows. In such bullish sequences, we prefer to buy pullbacks in 3, 7, or 11 swings. The QQQ ETF has followed a similar pattern, with its price recovering from every pullback before July 2024.
Notably, the bullish impulse sequence that started in October 2022 still appears incomplete, leading us to continue buying this ETF on dips. The most recent pullback occurred between July and August 2024, followed by a resurgence that has yet to break the previous high from July 2024. However, a higher-high sequence emerged when the ETF breached its August high, presenting an opportunity within the shorter cycles.
QQQ Elliott Wane Analysis – 10.01.2024 Update
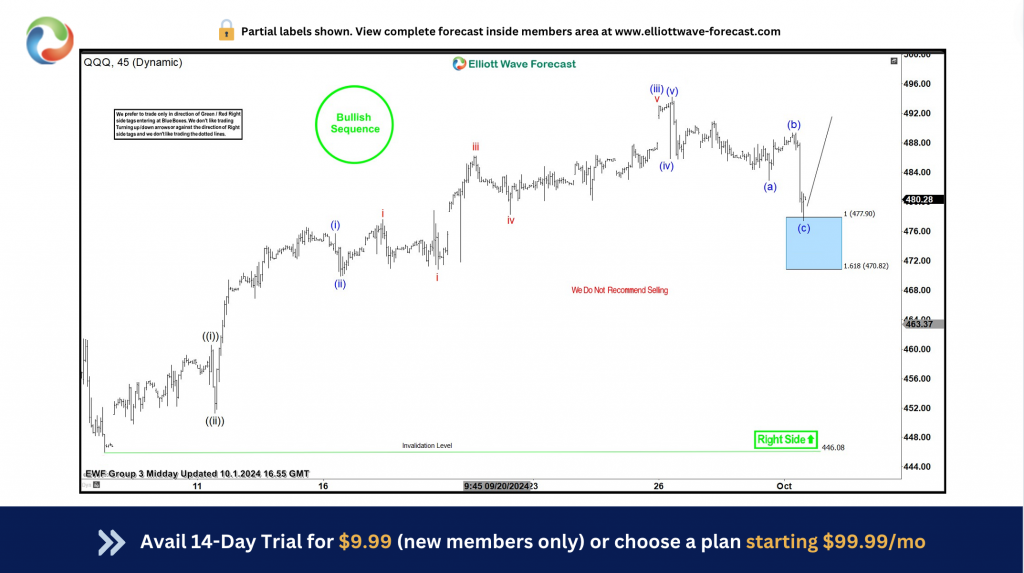
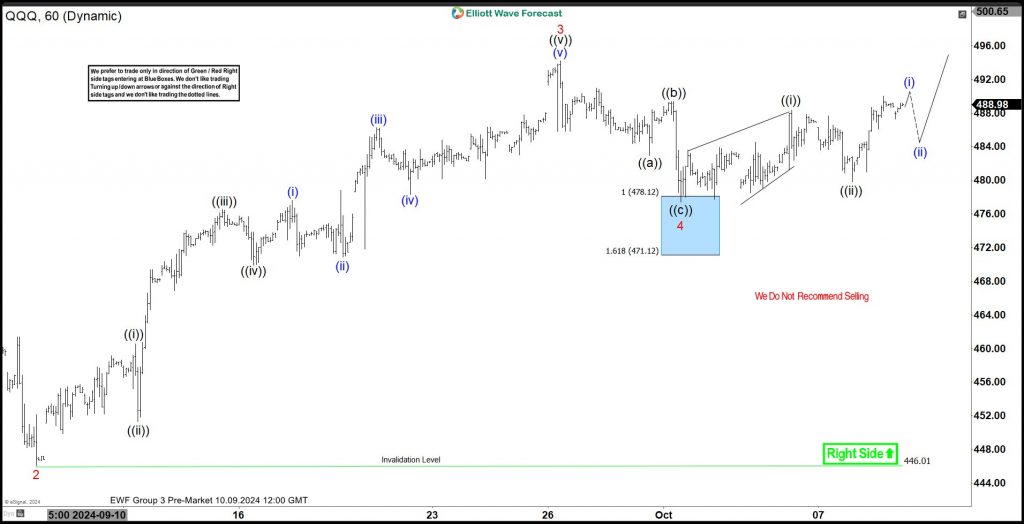
We identified an impulse wave sequence in the shorter cycles after the price broke above the August 2024 high. Consequently, we informed our members that we would look to buy the next 3, 7, or 11 swings pullback at the equal leg. To illustrate this, the abridged chart above illustrated end of wave 4, highlighting the blue box area, indicating a buy at 477/478 with a stop at 470.
Our plan was to adjust the stop to either the entry point or the low of wave (c) once the price made a significant bounce to what we call the “risk-free area.” At that point, we typically close half of the position for profit and reduce the stop on the remaining portion. This strategy aims to create a risk-free trade.
QQQ Elliott Wane Analysis – 10.09.2024 Update
We shared the chart on 10/09/2024, showing the expected price bounce from the blue box. Members have already closed half of their positions for profit and adjusted the rest to breakeven. This allows them to hold the remaining position risk-free until the target is reached. This frees up capital to allocate toward other opportunities. However, if the price turns lower from this point to form a deeper wave 4, we won’t hesitate to buy again. In that case, we will provide an updated chart with a new blue box for members to follow.
About Elliott Wave Forecast
At www.elliottwave-forecast.com, we update one-hour charts four times daily and four-hour charts once daily for all 78 instruments. We also conduct daily live sessions to guide clients on the right side of the market. Additionally, we have a chat room where moderators answer market-related questions. Experience our service with a 14-day trial for only $9.99. Cancel anytime by contacting us at support@elliottwave-forecast.com.
