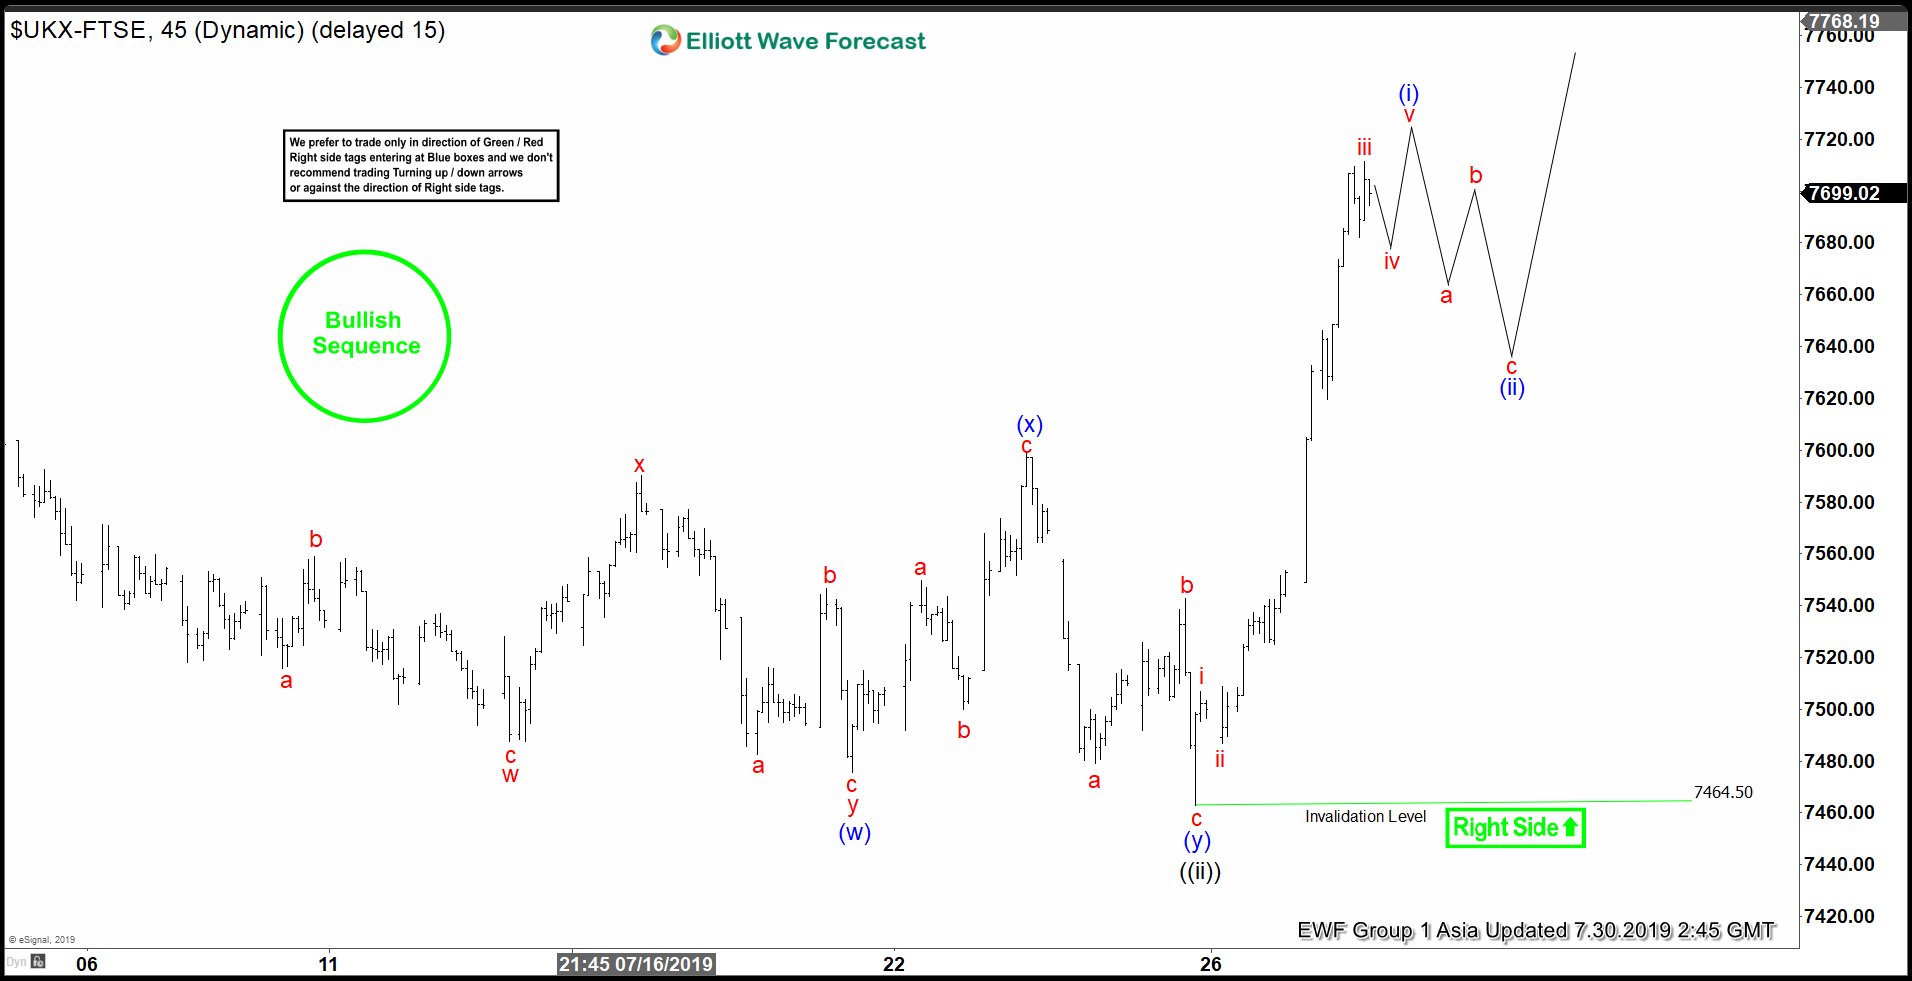
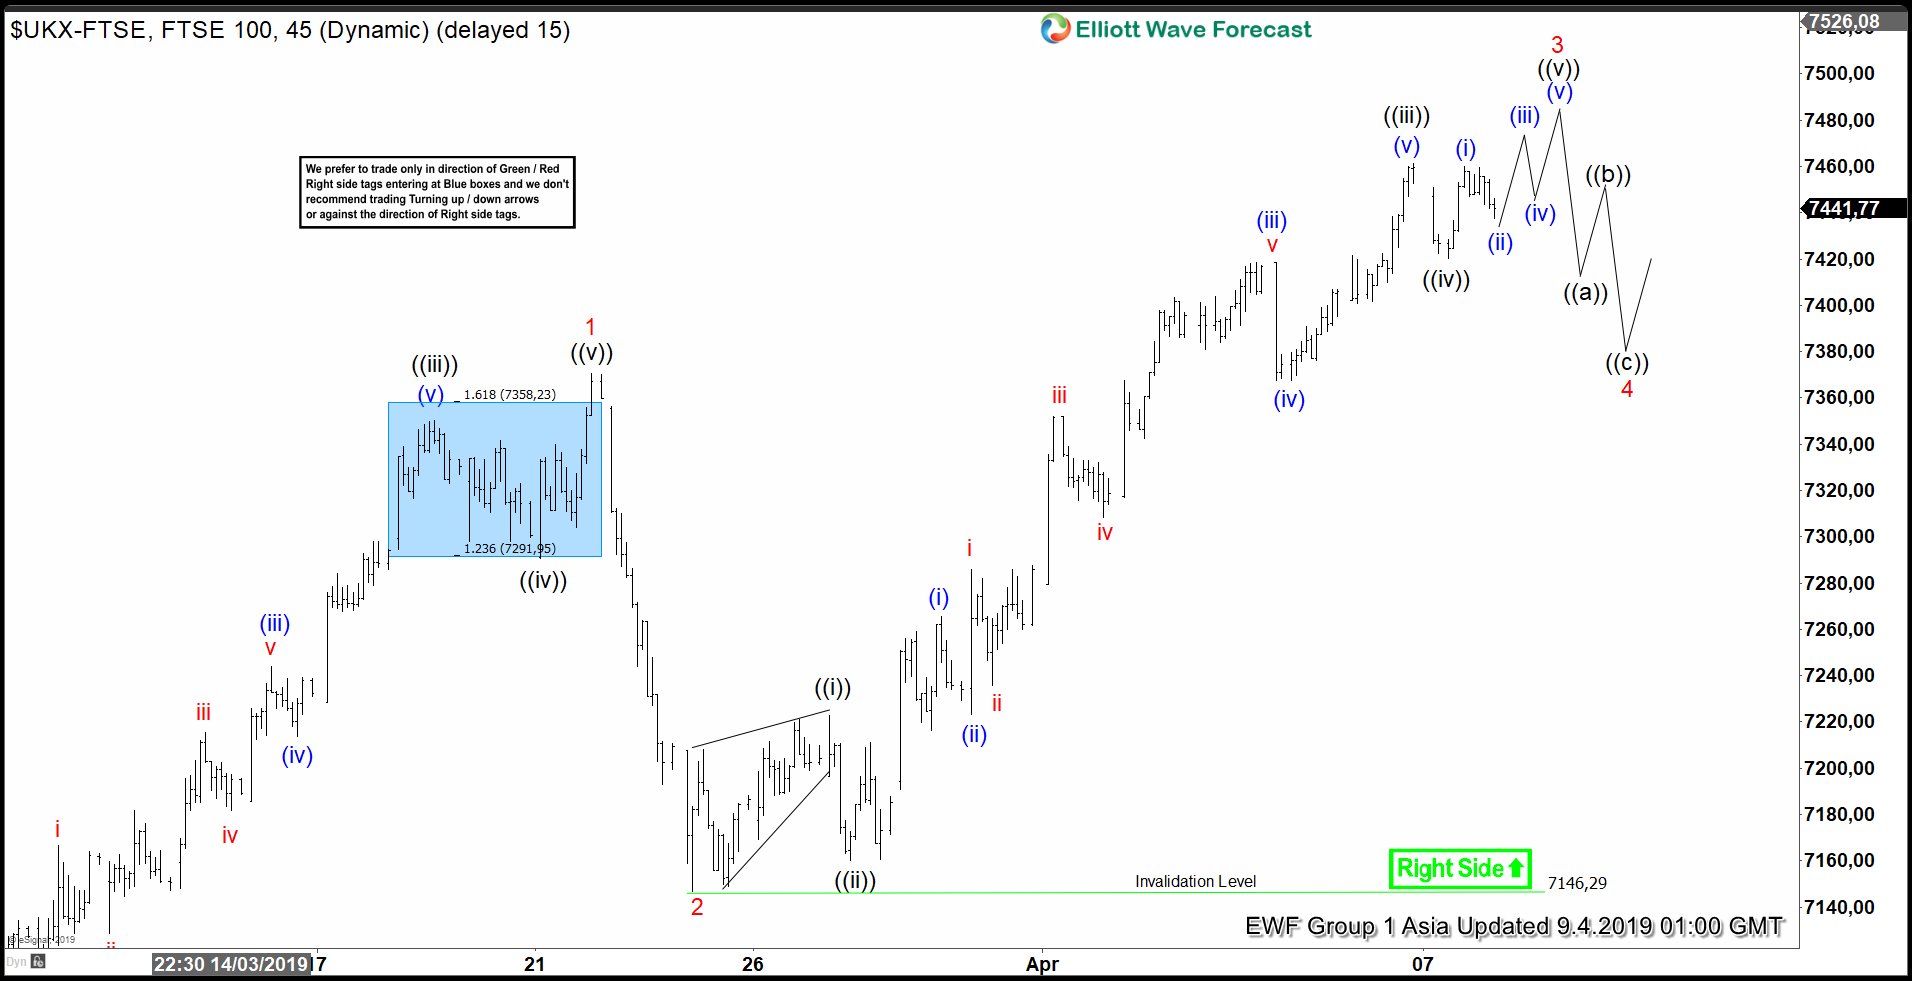
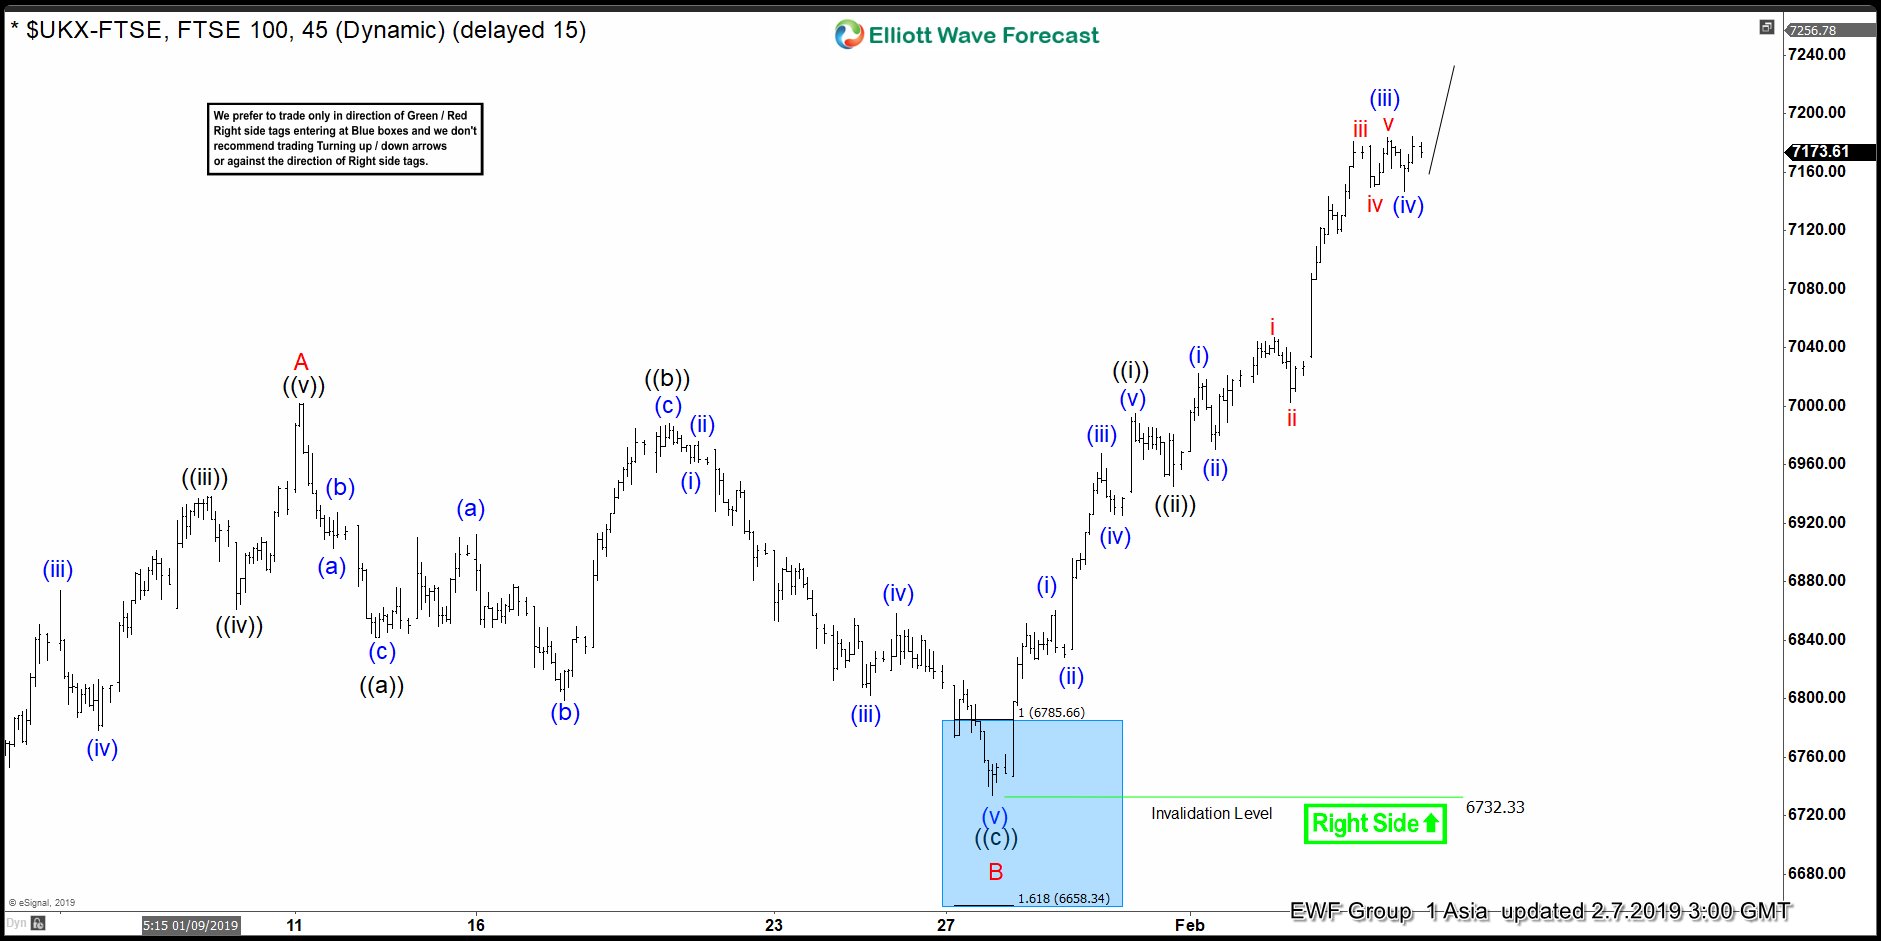
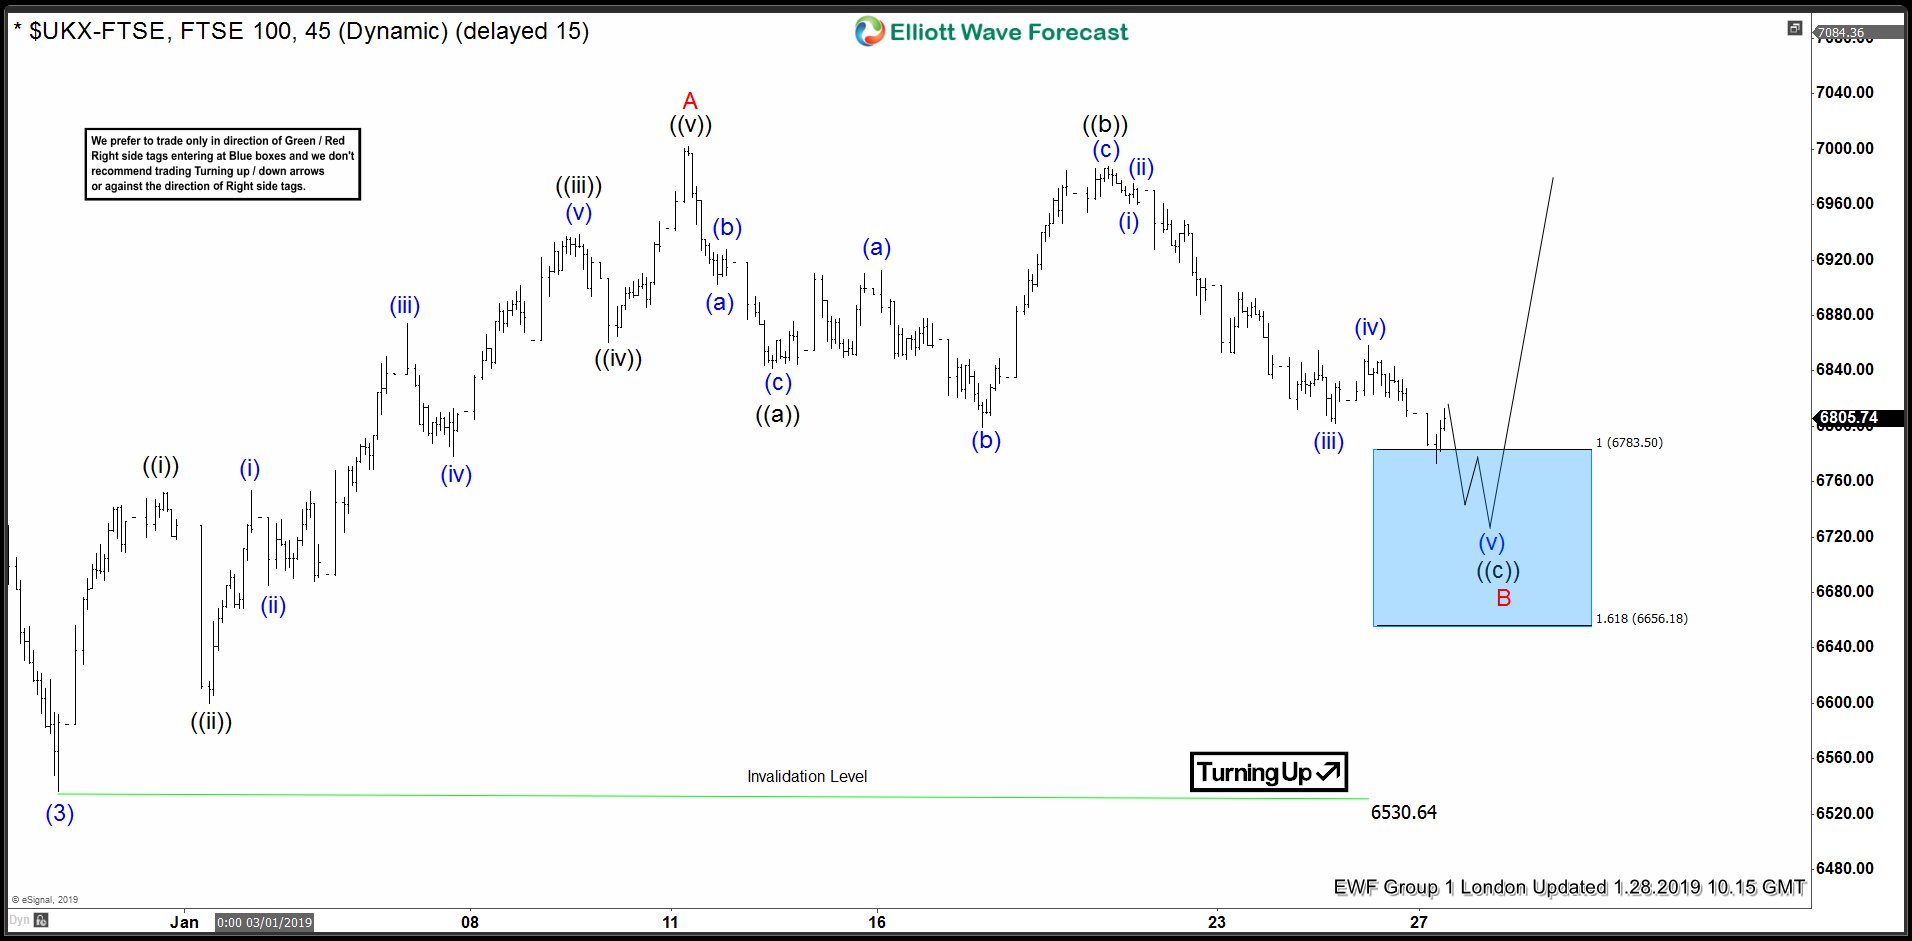
FTSE shows a bullish Elliott Wave sequence from October 3, 2019 low favoring further upside. The rally from October 3 low is unfolding as a double three Elliott Wave structure. On the chart below, we can see wave ((w)) ended at 7431.94 and pullback in wave ((x)) ended at 7199.40. Internal structure of wave ((x)) unfolded as a zigzag where wave (a) ended at 7258.46, wave (b) ended at 7404.47, and wave (c) of ((x)) ended at 7197.33. The Index has resumed higher and broken above wave ((w)), suggesting then ext leg higher in wave ((y)) has started.
Weave ((y)) is in progress as a zigzag Elliott Wave structure. Up from 7199.40, wave i ended at 7242.16 and wave ii ended at 7203.23. Index resumes higher in wave iii towards 7421.3, wave iv ended at 7384.96, and wave v of (a) ended at 7446. Index is now in wave (b) pullback to correct the cycle from November 21 low before the rally resumes. We don’t like selling the proposed pullback. As far as pivot at 7199.4 remains intact, expect dips to find support in 3, 7, or 11 swing for further upside. Potential target higher is 100% Fibonacci extension from October 3 low towards 7609 – 7707 area.

